Definitions Graph of an inequalitythe set of all


 b) c) d) x < -6 x > -6 x<6 x>6")
- Slides: 20
Definitions � � Graph of an inequality---the set of all points on a number line which represents all solutions Solution of an inequality—value which makes the inequality TRUE
Let’s compare the graphs of the two inequalities
CLOSED CIRCLE � If the endpoint is a solution, use a shaded in circle at the point. ≤ or ≥ OPEN CIRCLE � If the endpoint is not a solution, use an open circle at that point. < or >
Investigation v Write the following inequality v Do each of the following steps by beginning with the original inequality at each step and analyze how it affects the inequality: v Add any number to both sides of the inequality v Subtract any number from both sides of the inequality v Multiply or divide both sides by a positive number v Multiply or divide both sides by a negative number
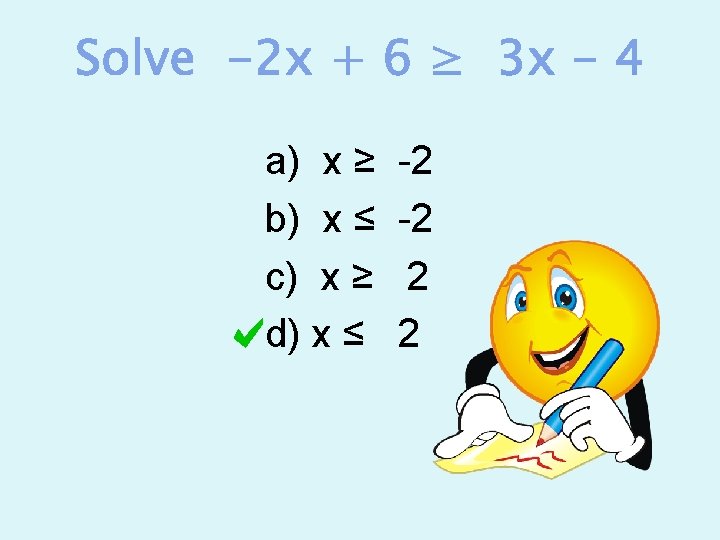
If you multiply or divide each side by a negative number, reverse the inequality.
-8+n≥-9 +8 +8 n≥-1 All numbers greater than OR equal to -1
-7 x<-21 -7 -7 x>3
Let’s Try to Check � You can’t CHECK all the solutions of an inequality, so choose several SOLUTIONS and check those. � Some in the shaded area, some not in the shaded area, and the “critical” point.
3 x+6≤ 7 -6 -6 3 x≤ 1 3 3 x≤ 1/3
-3 x+9>6 -9 -9 -3 x>-3 -3 -3 x<1 Don’t Forget —Reverse the inequality if multiplying or dividing by a negative number
2 x-3≥ 4 x-1 -2 x -3≥ 2 x-1 +1 +1 -2≥ 2 x 2 2 -1≥x x≤-1
2 x+12≥ 7 x+7 -2 x 12≥ 5 x+7 -7 -7 5≥ 5 x 5 5 1≥x x≤ 1
An amusement park charges $5 for admission and $1. 25 for each ride. You go to the park with $25. Write an inequality that represents the possible number of rides you can go on. What is the maximum number of rides you can go on? x= max number of rides 1. 25 x + 5 ≤ 25 x ≤ 16; You can ride 16 or less rides!!!
You have $18. 50 to spend on pizza. It costs $14 plus $0. 75 for each additional topping (tax is included). Solve an inequality to find the maximum number of toppings the pizza can have. x= max number of toppings. 75 x + 14 ≤ 18. 50 x ≤ 6; You can have 6 or less toppings!!!
Assessment Card Create a real life example involving an inequality in which the following graph would be its solution.
Which graph shows the solution to 2 x - 10 ≥ 4?
a) b) c) d) x < -6 x > -6 x<6 x>6