Defining the gender variable in entrepreneurship Gender stereotypes

Defining the gender variable in entrepreneurship. Gender stereotypes Dr. Marina Ranga University of Warsaw Faculty of Management 5 June 2019

Outline 1. Women’s role of in economic development and the gender gap 2. Women’s entrepreneurship as a potential source of economic and social development 3. The Global Entrepreneurship Monitor (GEM) – correlations of entrepreneurial activity with various factors, incl. gender 3. Characteristics of women entrepreneurs (age, education, motivation, personality traits, barriers to entrepreneurship) 4. Gender stereotypes

Women’s role of in economic development Women make up at least 40% of the workforce in more than 80 countries (Pew Research Center 2017)

Pew Research Center 2017

• In the next decade nearly 1 billion women are likely to enter the global labour force, but their economic potential is largely unrealised. • If female employment rates matched those of men, GDP would increase by 5% in America, 9% in Japan and more in developing countries by 2020. (The Economist 2012)

• Female consumers control about $20 trillion in annual consumer spending globally, and that figure could go up to $28 trillion by 2014. • Female consumers accounted for $13 trillion in total yearly earnings in 2009, that could go up to $18 trillion by 2014. • In aggregate, women represent a growth market bigger than China and India combined—more than twice as big. (Harvard Business Review, 2009)

The gender parity gap across health, education, politics and the workplace widening for the first time since 2006 (World Economic Forum Global Gender Gap Report 2017) • Only 68% of the world’s gender gap is now closed, in a slight deterioration compared to 2016 (gap 68. 3%) and 2015 (gap 68. 1%). • Decline caused by a widening of the gender gap across all four pillars: • Educational Attainment • Health and Survival • Economic Opportunity • Political Empowerment • Reversal driven by declining gender equality in the workplace and political representation • At the current rate of progress, the global gender gap will take 100 years to close, compared to 83 last year • The workplace gender gap will take 217 years to close.

Women’s entrepreneurship as a potential source of economic and social development • Growing number of women starting/running new businesses in the world • Women’s new businesses contribute to: 1. Wealth creation and sharing 2. Jobs creation 3. Balanced Regional Development by setting up new businesses, especially in less developed and backward areas. 4. Increasing living standards of people in a community • Focus on what women do and do not accomplish compared to men in the founding, development and growth of the businesses. • No single profile of the woman entrepreneur – variations by: • Type of participation: as self-employed or partner • Industry, age, education level, and growth aspirations. • Place, contexts (physical place, politics, religion, culture), geographies • Access to opportunities, markets, resources, capital.
 account for")
Women-Owned Business in the US • Women-owned firms (51% or more shares) account for 39% of all private firms and contribute 8% of employment and 4. 2% of revenues. • 20% of firms with revenue > $1 million is woman-owned. • 4. 2% of all women-owned firms have revenues of 1 million or more. American Express OPEN "The State of Women-Owned Businesses 2017”

Women-Owned Business in the EU Women make up 52% of the total European population but only 34. 4% of EU self-employed and 30% of start-up entrepreneurs (2012). Only 29% of active entrepreneurs were women in Europe-37 (28 EU countries, Albania, FYROM, Iceland, Israel, Turkey, Liechtenstein, Montenegro, Norway and Serbia) in 2012. The top five countries with the highest entrepreneurship rates for women were Greece, Albania, Portugal, Italy and Croatia (2012). https: //ec. europa. eu/growth/smes/promoting-entrepreneurship/we-work-for/women_en

An ‘entrepreneurial revolution’? Unemployment growth in the 1970 s/1980 s due to growing numbers of job seekers, little success of governments to reverse the trend Changes in industry: increasing industrial output through increased productivity did not automatically lead to more jobs Changes in employment structure: replacement of mass long-term employment resulting from the Industrial Revolution by more flexible structures (part time, temporary contracts, teleworking) Changes in economy structure: shift from manufacturing to services, split of larger firms into smaller firms concentrating on core activities (since the 1980 s) in order to reduce costs and risks Rapid, pervasive technological change small firms have better flexibility, speed of response than large firms, capacity to generate jobs
")
The Global Entrepreneurship Monitor (GEM)

• First edition in 1999 – 20 years of reporting • Comprehensive set of indicators on E constructing detailed profiles of entrepreneurs in each economy studied. • Captures both informal and formal activity, enables cross-national comparisons with a rigorous methodology • Tracks societal attitudes, perceptions of E • Measures multiple phases of the E process: rates of E across multiple phases of the process, profiles of entrepreneurs (demographics, motivations, ambitions), characteristics of their businesses • GEM national teams for data collection, a central data team for supervision and data processing
 Language Name English The Influence of GEM on Policy 2017")
Special topic reports (selected) Language Name English The Influence of GEM on Policy 2017 -2018 English GEM 2017 Middle East and North Africa Report Spanish GEM 2015 / 2016 Latin America and Caribbean Regional Report English GEM 2016 / 2017 Report on Senior Entrepreneurship English GEM 2016/2017 Women's Entrepreneurship Report English Europe’s Hidden Entrepreneurs: Entrepreneurial Employee Activity and Competitiveness in Europe English GEM 2015 Report on Social Entrepreneurship English GEM 2015 / 2016 Report on Entrepreneurial Financing English Future Potential: A GEM Perspective on Youth Entrepreneurship English GEM 2014 Women's Report

The GEM framework

q National Framework Conditions: • entrepreneurial finance (informal investment, business angels, VCs, banks, government loans, grants and subsidies, crowdfunding), • government policies (specific policies, taxes, bureaucracy and regulations for entrepreneurship or for improving conditions in SMEs) • government E programs (e. g. subsidies, incubators, advisory agencies) • E education (in schools, colleges, business schools, vocational centres), building students’ entrepreneurship skills and values. • R&D transfer from universities and research centers to the business sector, commercialization of research findings on the market. • commercial and legal infrastructure: supply and affordability of professionals and firms providing services to entrepreneurs (accountants, lawyers, consultants) • physical infrastructure: high-speed Internet and cell phone service, land, buildings, reliable utilities, highways, railways, ports, and airports. • internal market dynamics and entry regulation free and open market for setting prices, changes in demand are met with changes in supply • Internal market burdens or entry regulation: no burdens for entrepreneurs upon entering markets; regulations that facilitate these efforts. • cultural and social norms: behaviour, beliefs, language and customs that encourage entrepreneurs by demonstrating acceptance, support, esteem

q Societal Values about E: • societal beliefs about E as a good career choice • societal status of entrepreneurs • media representation of E in an economy • ease to start a business q Individual attributes: • demographic characteristics (gender, age, etc. ) • self-perceptions (perceived capabilities, perceived opportunities, fear of failure) • motives for starting a business (necessity versus opportunity). q Entrepreneurial activity: • By phase of the business process (nascent, new business, established business, discontinuation), • By potential impact (job creation, innovation, internationalization) • By type of activity: total early-stage entrepreneurial activity (TEA), social entrepreneurial activity (SEA), employee entrepreneurial activity (EEA).

GEM Entrepreneurship indicators

GEM Entrepreneurship indicators • Potential entrepreneurs: see opportunities in their environments, have the capabilities to start businesses, and are undeterred by fear of failure. • Intentional entrepreneurs: intend to start a business in the future (next 3 years) • Nascent entrepreneurs: have taken steps to start a new business, but have not yet paid salaries or wages for more than 3 months • New entrepreneurs: those who are running new businesses that have been in operation for between 3 months and 42 months. • Established business owners: those who are running a mature business, in operation for more than 42 months, business is sustainable • Discontinued entrepreneurs: those who, for whatever reason, have exited from running a business in the past year. • Total early-stage Entrepreneurial Activity (TEA): includes the phases of: • (i) nascent entrepreneurship and • (ii) new entrepreneurship/business ownership
 Entrepreneurs by necessity (Push factors): Dissatisfaction with a salaried")
Necessity vs. Opportunity (Push/Pull factors) Entrepreneurs by necessity (Push factors): Dissatisfaction with a salaried job or current position at work (frustration, glass ceiling, boredom, dominance of masculine business culture – ‘old boys’ networks’) - Difficulty in finding a job - Insufficient family income - Desire for flexible schedule to balance work-family life - Entrepreneurs by opportunity (Pull factors): Wish to exploit a perceived business opportunity - Independence and self-achievement – ‘desire to control their futures and financial destinies’ - Entrepreneurial drive, desire for wealth, social status and power - Clear cut situation of necessity or opportunity is rare, most entrepreneurs are influenced by a combination of both push and pull factors.

Relationship between TEA and: • • • Level of economic development Gender Age of the entrepreneur Necessity and opportunity Innovation

TEA and the level of economic development Lower TEA in high-income countries mostly due to alternative job options and higher levels of competitiveness that can reduce the attractiveness of starting a business Higher TEA in low-income countries mostly due to a lack of jobs, low income
 by geographic region Lowest TEA in highincome")
TEA rates among adults (ages 18 -64) by geographic region Lowest TEA in highincome economies (Japan and Taiwan), except for Korea Lowest TEA in highincome economies, except for Chile Lowest TEA rates (less than 10% in most countries) Dual pattern of TEA

TEA and gender • Strong disparities between women and men entrepreneurs • Only 6 of the 49 economies surveyed by GEM 2018 show equal TEA rates between women and men (Indonesia, Thailand, Panama, Qatar, Madagascar and Angola). • More gender equality in East and South Asia and Latin America and the Caribbean: no economy where women have less than half the rate of men. • Less gender equality in Europe and North America: in six countries, women start at less than half the rate of men (Slovenia, Greece, Sweden, Switzerland, UK and Turkey). No country shows equal levels between the genders. In half of the countries here, female TEA rates are at 5% or less. • Mixed pattern in Middle East and Africa: gender equality in some countries (Angola and Madagascar), gender inequality in others (Lebanon and Sudan).
")
TEA rates by gender among adults (ages 18 -64)

Women in entrepreneurship across 74 economies GEM Report 2016 -2017

TEA and age In most economies, the highest participation in entrepreneurship among both women and men peaks in the 25 -34 age range, closely followed by the 35 -44 age range: college education, some work experience, in tune with the latest ideas, enthusiasm for pursuing new opportunities BUT o not at the point to own and manage established businesses or pursue attractive and/ or stable employment positions, no accumulated resources, credibility and connections of older entrepreneurs, financial constraints e. g. college loans, mortgages and children. o • This is true across development levels and regional groups. Women are less likely than men to start a business, the entrepreneurial gender gap increases with higher economic development. • High prevalence of TEA among the youngest adults (aged 18 -24) in Brazil, Canada, Greece, Sweden and Slovak Republic • Higher prevalence of TEA among older age groups may appear in narrow demographic groups due to particular strengths to leverage (experience, work situation, resources, contacts).

Age profiles of TEA by age group

Female Participation in TEA by age GEM Report 2016 -2017

TEA driven by necessity or opportunity • Entrepreneurship driven by necessity more frequent in low-income economies, mostly because of fewer employment opportunities • TEA driven by necessity drops as economic development level increases (Avg of 35% in low-income economies, 28% in middleincome economies, 18% in high-income economies). • Entrepreneurship driven by opportunity more frequent in higher income economies: entrepreneurs seek higher income or greater independence rather than simply maintaining income with their businesses: • Avg of 51% in high-income economies, 42% in middle-income economies, 37% of entrepreneurs in low-income economies • Entrepreneurship driven by opportunity among women increases with level of education, and E by necessity decreases E offers a work option for those with little education and few employment possibilities, as well as a career choice for highly educated women.
")
TEA rates by necessity and by opportunity among adults (ages 18 -64)

TEA driven by necessity and opportunity around the world in % of female population aged 18 to 64

Percentage of opportunity and necessity motives among female entrepreneurs by education level, for those with secondary education and above

Innovative TEA Innovative entrepreneurs develop products or services that are new to all or some customers, have no or few competitors • Latin America and Caribbean region: highest Innovative TEA in Chile (nearly half of early-stage entrepreneurs indicate themselves to be innovative) and Guatemala, lower in the other economies, particularly Brazil. • Middle East and Africa: higher innovative TEA in Lebanon and Angola, much less elsewhere in this region • East and South Asia: low innovative TEA. • Europe and North America: high innovative TEA in Canada, the US and Luxembourg, low in three countries (Russia, Poland Bulgaria) under 15% of entrepreneurs
")
TEA rates showing the proportion of Innovative TEA among adults (ages 18 -64)

TEA rates indicating proportion of Innovation TEA by region (in % of Female Population aged 18 to 64)

The EU project ‘Peer-learning activities in entrepreneurship education and women entrepreneurship’ 1. Europe has the lowest early stage female involvement in entrepreneurship. According to the 2 nd European start-up monitor, only 14. 8% of founders are female. 2. Digital start-ups launched by women perform better than those started by men, yet venture capitalists are less likely to invest in them. Start-ups with female founders got 4. 9% of the global VC in 2016, as gender stereotypes impacted the decision to invest. 3. Although the number of business angels is increasing, only 7. 4% of investors and 7. 2% of business angels in Europe are women. 4. Women’s formal education levels resemble or exceed those of men, yet women are less confident in their abilities. At EU level, 1/3 of women indicated they had sufficient skills and knowledge to start a business while half the men felt the same (cont. )

5. In almost all EU member states, women don’t think they have access to entrepreneurship training, although women in Hungary, Latvia, Estonia and Sweden thought they were more likely to have access to training. 6. More than half of women at EU level (52%) said fear of failure prevented them starting a business, over 42% of men, particularly in Greece (71%) and Poland (65%). 7. Studies in France found that only 10% of women entrepreneurs receive support from banks. In the UK, women also found it harder to access finance. Those that did access finance from banks also lacked access to other financial services (savings, insurance and digital payment methods). 8. According to a 2015 study, women were half as likely than men to be self-employed in the EU. The gap was most prominent in Ireland Malta, where men were 3 times more likely to be self-employed. This is caused by different motivations – studies suggest that work-life balance and familial responsibilities impact women’s entrepreneurial activities.
 Age: majority of women entrepreneurs in their 30 s-40")
Characteristics of women entrepreneurs (1) Age: majority of women entrepreneurs in their 30 s-40 s Education: generally well educated, with at least secondary education Work-family linkages: general tension between personal life and career pursuit, determined by time pressure, family size and support, job satisfaction, marital and life satisfaction ◦ Marriage and children as potential constraints on women’s economic activities due to society’s gender-based expectations and competing demands. ◦ Women business owners (w. b. o) are at least as likely to be married as male b. o. , but only single w. b. o. similar to male b. o. in their ability to allocate time to business ◦ There is a general acceptance of w. b. o. ’s work by their families ◦ In some cases, being a w. b. o. actually helped family life as it provided more flexibility, autonomy and control, higher business satisfaction. ◦ Family support and encouragement important for running an enterprise
 Motivation: women primarily motivated by the need for self-determination")
Characteristics of women entrepreneurs (2) Motivation: women primarily motivated by the need for self-determination and financial independence, and employment-related factors: ◦ ◦ ◦ Lack of work recognition Women not taken seriously by their employer Lack of promotion opportunities (glass ceiling) Desire to realise personal ambitions or face a challenge Need for flexibility for family matters Loss of a job or inability to find a suitable job US study (1986) ranked women’s reasons to become business owners: ◦ ◦ ◦ ◦ 1. Independence 2. Job satisfaction 3. Achievement 4. Opportunity 5. Money 6. Status/prestige 7. Power
 Personality traits: 1. Courage to start own business, capitalize")
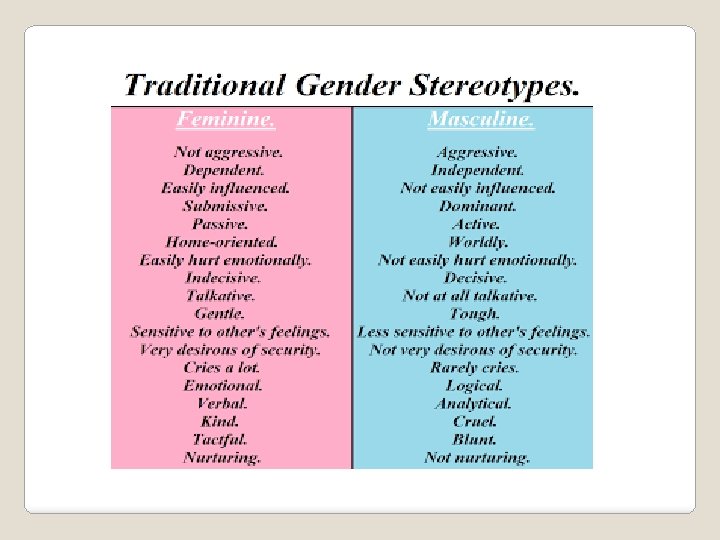
Characteristics of women entrepreneurs (3) Personality traits: 1. Courage to start own business, capitalize on opportunities that can bring profit. 2. Vision, capacity to look outside the box. 3. Passion, intense desire to succeed, capacity to work hard, especially in the early stages of business development and ownership 4. Persistence, perseverance, maintaining discipline 5. Balance 6. Creativity 7. Profit earning capacity 8. More nuanced view of financial risk than men (Kauffman Foundation 2015) 9. Greater ambitions to become serial entrepreneurs than men (ibid. ) Successful w. b. o. more associated with masculine than feminine personality traits (gender stereotypes) Typical masculine: competitive, active, independent, decisive, self-confident, aggressive, assertive, determined, strong leadership behaviour, highly developed communication skills, analytical thinking Typical feminine: understanding, warm, emotional, caring higher need for support
 Barriers to Entrepreneurship ( Kauffman Foundation 2015): 1. 2.")
Characteristics of women entrepreneurs (4) Barriers to Entrepreneurship ( Kauffman Foundation 2015): 1. 2. 3. 4. 5. Lack of available mentors Limited access to entrepreneurial finance Limited access to networks Maintaining a work-life balance (parenthood pressures, family obligations) Entrepreneurship is perceived as a masculine activity

https: //ec. europa. eu/info/sites/info/files/ebs_465 _infographic_gender_stereotypes. pdf

https: //ec. europa. eu/info/sites/info/files/ebs_465_infographic_gender_stereotypes. pdf

THANK YOU! marina. ranga@gmail. com
- Slides: 47