Defect Classification and Analysis Defect Prevention Defect Detection


 Tight Scheduling Poor Tools Market pressure No")
 wrong state wrong input data No “undo” state")


 defect ↓ quality ↑ in current and")

. p")


: n")

: Overview p Key elements of ODC n n n n")
 analyses:")


- Slides: 27
Defect Classification and Analysis
Defect Prevention & Defect Detection p Defect Prevention techniques address how to prevent “error” before it is injected: n n p Root Cause Analysis of problem Education and training Defect Detection techniques address how to find the faults: n n n Testing (with various techniques covered in this class) Reviews and inspection Formal verification (next lesson)
Defect Prevention – Root Cause Analysis p This is a structured approach to identifying the factors (causes) of problems; then followup with “addressing” and “fixing” these potential causes. p One popular graphical tool used is the “cause-and- effect” diagram, which looks like a fishbone: n n Place the problem at the right tip Place the causes on the branches (out like a fish bone)
Cause-and-Effect Diagram ( for error prevention ) Tight Scheduling Poor Tools Market pressure No version control Poor estimation skill Nodebugger Hiring problem Lack of training Poor Programmers Programming Problems Hard parts are: a) Clear problem def. b) Coming up with the potential “causes”
Cause-and-Effect Diagram (a more “specific” example) wrong state wrong input data No “undo” state No input checking numerical overflow divide by zero error in computation Program terminates unexpectedly after inpu
Inspection and Review p The main objective of an Inspection or a Review is to detect defects. p Inspections and reviews are testing of software artifacts without the actual execution of code and is especially suited for : 1. 2. 3. 4. Requirements - documents Design - documents Plans and Tests Cases – documents Customer education material - documents
Inspection as Natural Part of Software Development Inspect Document Requirements Analysis Design most often used Inspect Document less often used Inspect Code & doc. Code & Manuals Inspect Test Cases Functional Test Component Test System Test least often use Inspect Test Cases
Defect Analysis p Goal: n n (actual/potential) defect ↓ quality ↑ in current and future products.
Defect in Quality Data/Models p Defect data is quality measurement data: n n n p Extracted from defect tracking tools. Additional (defect classification) data may be available. post-release data issues Defect data in quality models: n n As results in generalized models. As response/independent variables in product specific models.
General Defect Analysis p General defect analyses: Questions n What? identification (and classification). p n n Where? distribution across location. When? discovery/observation p p p n type, severity, etc. , what about when injection occurs? harder pre-release: more data post-release: less data, but more meaningful/sensitive How/why? related to injection => use in future defect prevention.
General Defect Analysis p General defect analyses: Types n n n Distribution by type or area. Trend over time. Causal analysis.
Defect Analysis: Data Treatment p Variations of defect data: n n n p Error/fault/failure perspective. Pre-/post-release. Unique defect? Why defect fixes (DF)? n n n Propagation information (system structure, component interconnection, product evolution) Pre-release: post release: each failure occurrence.
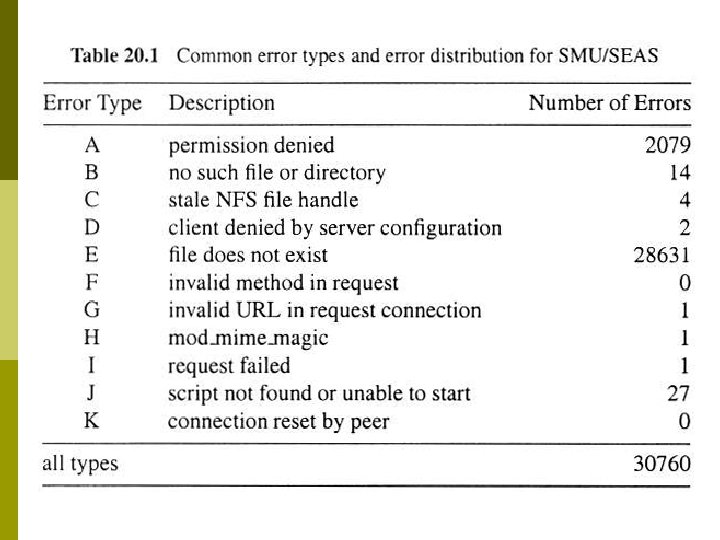
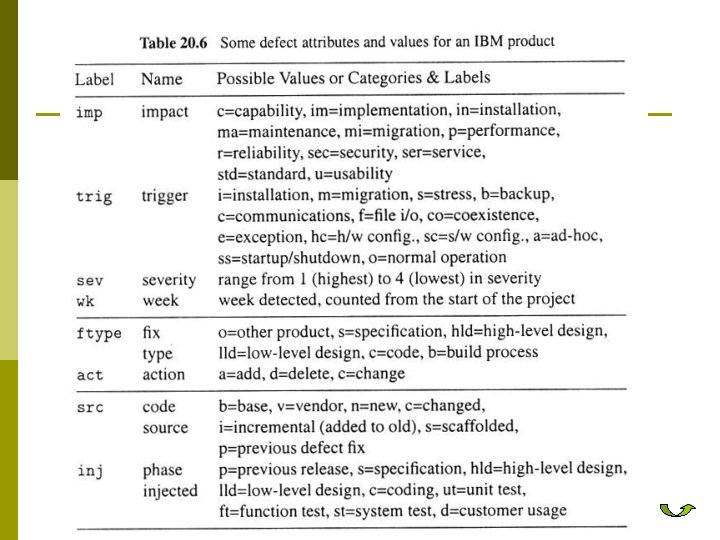
Defect Distribution Analysis p What: Distribution over defect types. n n n p Types/sub-types. Defect types related to product's “domain". Tied to quality attributes Web example: Table 20. 1 (p. 341) n n Defect = “error" in web community. Dominance of type E error (93%): “missing files". Type A error (6. 76%): “permission denied” requires further analysis All other types: negligible
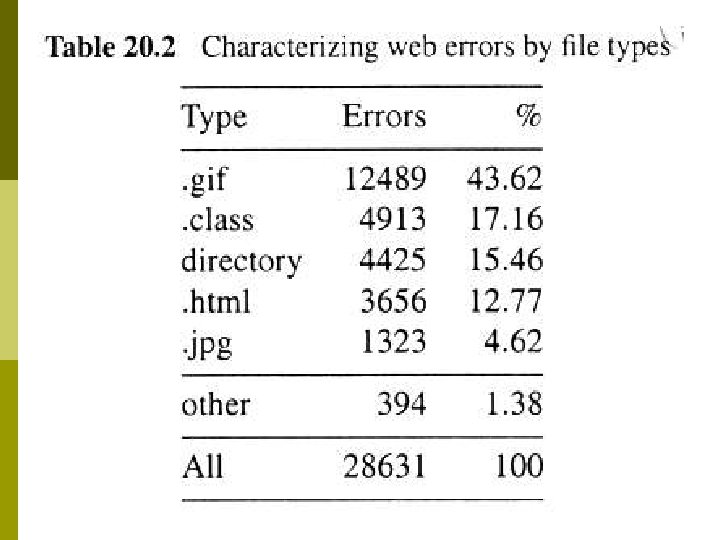
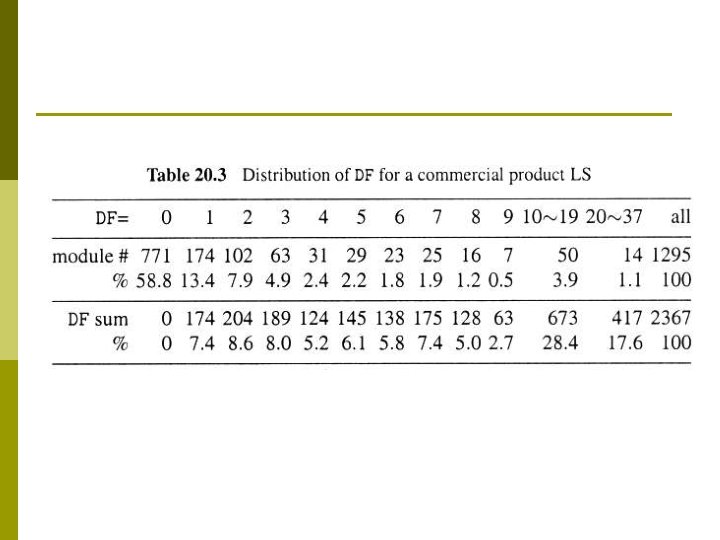
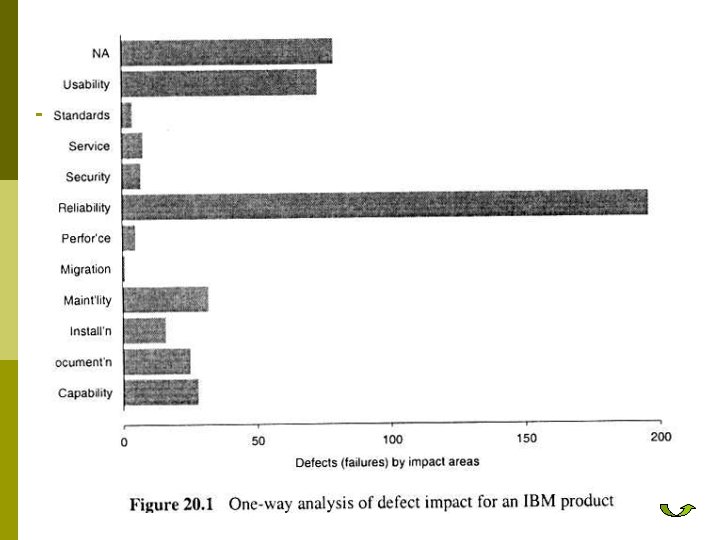
Defect Distribution Analysis p Where: Distribution over locations. n Common: by product areas sub-product/module/procedure/etc. p IBM-LS: Table 20. 3 (p. 342) and IBM-NS: Table 20. 4 (p. 343) p common pattern: skewed distribution p n Extension: by other locators e. g. , types of sources or code p example of web error distribution p Table 20. 2 (p. 342) by file type p again, skewed distribution! p p Distribution over other defect attributes: e. g. severity, fix type, functionality, usage scenarios, etc.
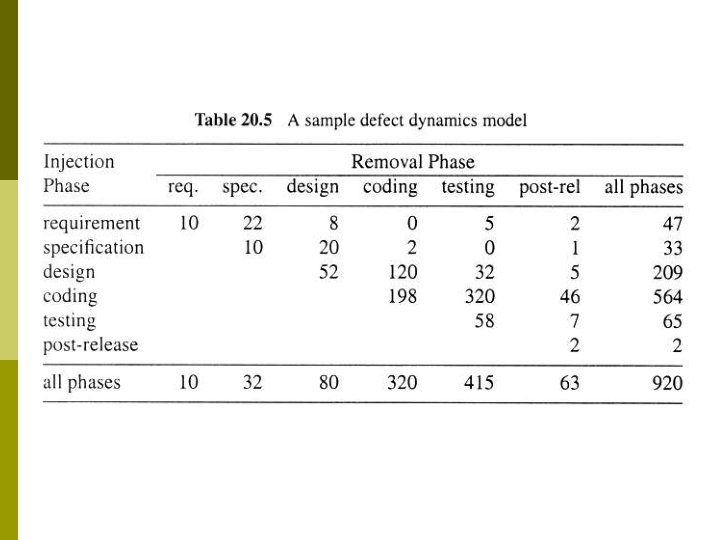
Defect Trend Analysis p Trend as a continuous function of time (or phases): n Defect dynamics model: Table 20. 5 (p. 344) n n n Important variation to trend analysis. Defect categorized by phase. Discovery (already done). Analysis to identify injection phase (difficult) Focus out-of-phase/off-diagonal ones because of expense!
Defect Causal Analysis p Defect causal analyses: Types n Causal relation identified: p p n p Techniques: statistical or logical. Root cause analysis (logical): n n n p error-fault vs fault-failure works backwards Human intensive. Good domain knowledge. Fault-failure: individual and common. Error-fault: project-wide effort focused on pervasive problems. Inspection has a step called process brainstorming Statistical causal analysis: ≈ risk identification techniques in Ch. 21.
Orthogonal Defect Analysis (ODC): Overview p Key elements of ODC n n n n Aim: tracking/analysis/improve Approach: classification and analysis Key attributes of defects Views: both failure and fault Applicability: inspection and testing Analysis: attribute focusing Need for historical data
ODC: Why? p Statistical defect models: n n n p Causal (root cause) analyses: n n p Quantitative and objective analyses. SRGMs (Ch. 22), DRM (Ch. 19), etc. Problems: accuracy & timeliness. Qualitative but subjective analyses. Use in defect prevention. ODC solution: n n n Bridge the gap between the two. Systematic scheme used. Wide applicability.
ODC: Ideas p Cause-effect relation by type: n n p Good measurement: n n p Different types of faults. Causing different failures. Need defect classification. Multiple attributes for defects. Consistency across phases. Uniformity across products. ODC process/implementation: n n n Human classification. Analysis method and tools. Feedback results (and followup).
ODC: Theory p Classification for cause-effect or views: n n n Cause/fault: type, trigger, etc. Effect/failure: severity, impact, etc. Additional causal-analysis-related: source, where/when injected.
Queries?