Deep Learning for Estimation of Individualized Treatment Effects


 • Tree-based methods (Wager and Athey")

 Fake Sample X’=G(Z) Real or Fake G(Z) Z Random Noise")
 Z X Random Noise Real or Fake Discriminator Neural Networks G(Z)")


 •")


 RForest(R) 0, 894 0, 880 0,")
 • The proposed algorithms were applied to newly diagnosed acute")
 KNN(10) BLR RForest(C) RForest(R) CForest ATT -0. 044")


 • Chemotherapy: 601 • Radiotherapy: 876 • Number of mi.")


 • Radiation Only : 747 • Radiation and Chemotherapy: 648")

: 474 1 (Radiation+Chemo): 261 Radiotherapy Both Radio and Chemotherapy")


- Slides: 44
Deep Learning for Estimation of Individualized Treatment Effects with Multiple Sources Momiao Xiong University of Texas School of Public Health, USA
Outlines • Review of treatment estimation as a causal inference problem. • Generative adversarial networks for estimation of counterfactuals • Conditional generative adversarial networks (CGAN) for individualized treatment estimation • Adversarial autoencoders (AAE) and bidirectional conditional generative adversarial network for individualized treatment estimation with multiple types of datasets • Simulations • Real data analysis • Conclusions
Normal Tumor Image Diagnosis Physiological Data RNA-seq Data mi. RNA-seq Data …GCCGTTGAC…. …. GCCATTGAC…. Deep Learning, AAE and CGAN Treatment SNP Clinical/Patient Decisions/Actions
Precision Medicine • What is it? “Precision medicine is an emerging approach for disease treatment and prevention that takes into account individual variability in genes, environment, and lifestyle for each person. ” https: //www. nih. gov/precision-medicine-initiative-cohort-program
Schork 2015
What Is Precision Medicine? • ‘Precision medicine…. is an evolving field in which physicians use biomarker to determine which medical treatments will work best for each patient. ’
Counterfactual model as a tool for treatment estimation Suchi Saria
Potential Outcome Framework for treatment estimation Treatment T ∈ {0, 1} and outcome Y 0, Y 1 ∈ R. Unit A B C 15 10 5 20 12 11 -5 -2 -6 D 12 19 -7 Individual treatment effect:
Potential Outcome Framework for treatment estimation Unit A B C D 15 12 5 19 ? ? Fundamental Problem: We never observe all potential outcomes Covariates (X) associated with each unit are available.
Suchi Saria
Suchi Saria
Suchi Saria
Suchi Saria
Other Approaches • Adjusted regression methods (Kallus 2017) • Tree-based methods (Wager and Athey 2017) • Representation-balanced methods (Shalit et al. 2017) • Deep learning methods (Generative adversarial networks, Yoon et al. 2018).
Rubin Causal Model Unconfoundedness/ignorability/exogeneity Treatment positivity: For all x and t, Observe data set: Key issue: Estimate the counterfactual (missing value)
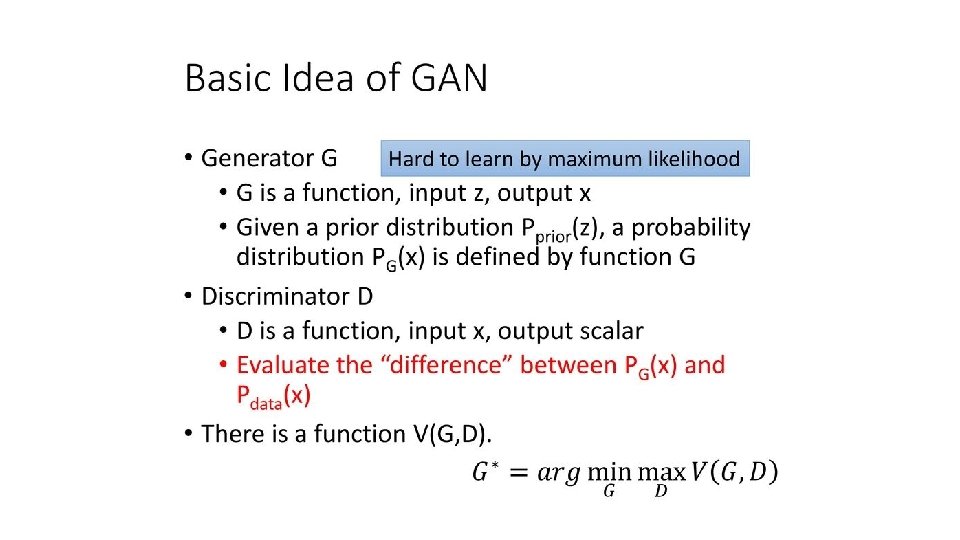
Generative Adversarial Networks (GANs) Fake Sample X’=G(Z) Real or Fake G(Z) Z Random Noise X Real Data
Fake Sample X’=G(Z) Z X Random Noise Real or Fake Discriminator Neural Networks G(Z) Neural Networks Conditions Scheme of conditional GAN X Y (Effect) Real Data
Generator Z noises NN factual counterfactuals D Discriminator features Real Samples treatments Is D correct?
Loss functions loss function or cost function is a function that maps an event or values of one or more variables onto a real number intuitively representing some "cost" associated with the event. • Used for parameter estimation, and the event in question is some function of the difference between estimated and true values for an instance of data. •
G Discriminator Neural Networks E Figure 3. AAE and Bidirectional Conditional Generative Adversarial Network for Causal Inference.
Simulation I •
Examples of simulated images
Methods ATE ATT ATC PEHE MSE Ground Truth 6. 5385 6. 6713 6. 4142 2. 0856 0. 0 Conditional GAIN 7. 0666 (NN) 7. 1156 7. 0207 3. 6481 5. 5315 Conditional GAIN 6. 5531 (CNN) 6. 7098 6. 4064 1. 4079 3. 1188 OLS (t and x) 6. 5089 6. 5556 6. 4651 9. 6378 8. 8863 Propensity Score 6. 2813 6. 3252 6. 2402 10. 0558 9. 3316 KNN 6. 2090 6. 1913 6. 2255 5. 7457 6. 1478 Random Forest 6. 3046 6. 4193 6. 1972 4. 0134 6. 0422 KNN: neighbor=10 RF: number of trees=100, max depth=5 OLS: mean pixel value was used as the image feature.
Results for simulation I Methods Correlation MSE OLS 0. 8470 8. 8863 KNN 0. 8112 6. 1478 Random Forest 0. 8494 6. 0422 CFGAIN(NN) 0. 8559 5. 5315 CFGAIN(CNN) 0. 9095 3. 1188
Simulation II (Binary Response) •
Results for Binary Response MSE STD Accuracy GANITE 0. 062 0. 235 0. 9383 LR 0. 104 0. 305 0. 896 Log. R 0. 12 0. 325 0. 88 SVC 0. 126 0. 332 0. 874 KNN 0. 148 0. 355 0. 852 Rforest 0. 098 0. 297 0. 902
ATT ATC ATE MSE STD ACC ITE=-1 ITE=0 ITE=1 Ground Truth 0. 391 0. 321 0. 356 0. 000 1. 000 0 322 178 GANITE 0. 399 0. 341 0. 370 0. 086 0. 280 0. 914 0 315 185 LR 0. 520 0. 369 0. 444 0. 104 0. 305 0. 896 0 278 222 Log. R 0. 520 0. 393 0. 456 0. 120 0. 325 0. 880 0 272 228 SVC 0. 524 0. 401 0. 462 0. 126 0. 332 0. 874 0 269 231 KNN(5) 0. 508 0. 401 0. 454 0. 150 0. 357 0. 850 1 271 228 KNN(10) 0. 524 0. 325 0. 424 0. 148 0. 355 0. 852 1 286 213 BLR 0. 524 0. 369 0. 446 0. 106 0. 308 0. 894 0 277 223 RForest(C) 0. 452 0. 325 0. 388 0. 096 0. 295 0. 904 0 306 194 RForest(R) 0. 431 0. 337 0. 384 0. 096 0. 295 0. 904 1 306 193
Accuracy 0, 914 0, 896 0, 904 RForest(C) RForest(R) 0, 894 0, 880 0, 874 0, 850 GANITE LR Log. R SVC KNN(5) 0, 852 KNN(10) BLR
Real Data Analysis (1) • The proposed algorithms were applied to newly diagnosed acute myeloid leukemia (AML) of 256 patients, treated with HDAC, IDA and HDAC+IDA at M. D. Anderson Cancer Center. • There were 212 valid samples and 85 useable features
GANITE LR Log. R SVC KNN(5) KNN(10) BLR RForest(C) RForest(R) CForest ATT -0. 044 ATC 0. 273 ATE 0. 137 0. 209 0. 041 0. 113 0. 209 0. 083 0. 137 0. 121 0. 372 0. 264 -0. 011 0. 248 0. 137 0. 066 0. 314 0. 208 0. 088 0. 248 0. 179 0. 187 0. 074 0. 123 0. 099 0. 141 0. 122 0. 077 0. 215 0. 156
0, 4 0, 35 0, 3 0, 25 0, 2 0, 15 0, 1 0, 05 0 GANITE LR Log. R SVC KNN(5) KNN(10) BLR -0, 05 -0, 1 ATT ATC ATE RForest(C) RForest(R) CForest
Sparse Regression
Ten Identified Biomarker Gene Name Regression Coefficient PTEN. p 0. 230 0. 126 BCL 2 0. 209 0. 104 MTOR. p 0. 204 0. 100 BAK 0. 194 0. 090 BAD. p 136 0. 167 0. 067 PKCA 0. 153 0. 056 ZUBROD. S 0. 153 0. 055 TP 38. p 0. 146 0. 051 SSBP 2 0. 145 0. 050 SSBP 3 0. 134 0. 043
Real Data Analysis (2) • Chemotherapy: 601 • Radiotherapy: 876 • Number of mi. RNA: 1881
Results • ATT: -0. 14393 • ATC: -0. 00346 • ATE: -0. 07435 • The number of hidden variables: 100 • Reconstruction Mean Square Error: 0. 06
ATE: -0. 07435 288 Radiotherapy 1037 177 Chemotherapy
Real Data Analysis (3) • Radiation Only : 747 • Radiation and Chemotherapy: 648 • Number of mi. RNA: 1881
Results • ATT: -0. 07081 • ATC: -0. 12369 • ATE: -0. 09913
Suggest Treatment: 0 (Radiation): 474 1 (Radiation+Chemo): 261 Radiotherapy Both Radio and Chemotherapy
Conclusions • These results strongly demonstrate that deep learning provides the powerful tools for individualized treatment effect estimation and optimal treatment selection. • The proposed algorithms can find biomarkers to predict treatment response. • The developed analytic forms can be applied to genetics, epigenetics and imaging data as features and ensure that the right therapy can be offered to “the right patient at the right time”. • This project will have profound implication in precision medicine.
Acknowledgement • The University of Texas MD Anderson Cancer Center Xuelin Huang, Ph. D Shenying Fan • Marshfield Clinic Research Institute Schichung Guo, Ph. D • Current Members at Xiong Lab Qiyang Ge Yuanyuan Liu Smath Liu