
Decon MSn Supplementary Information Anoop Mayampurath Tandem Mass

- Slides: 58
Decon. MSn – Supplementary Information Anoop Mayampurath
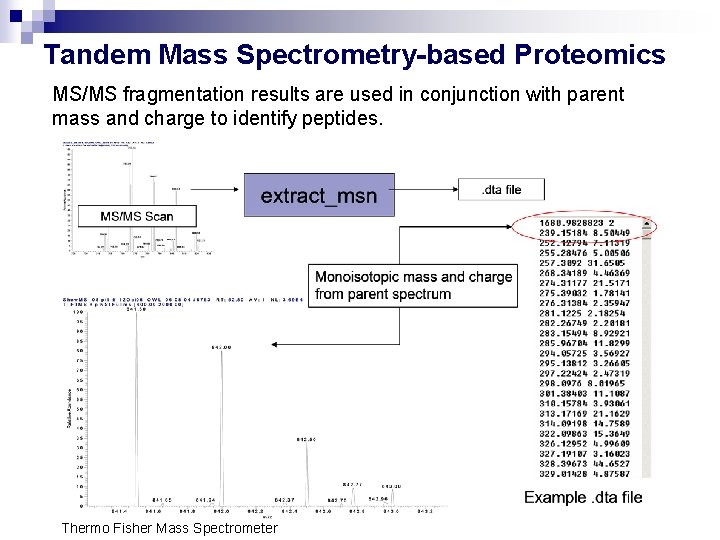
Tandem Mass Spectrometry-based Proteomics MS/MS fragmentation results are used in conjunction with parent mass and charge to identify peptides. Thermo Fisher Mass Spectrometer
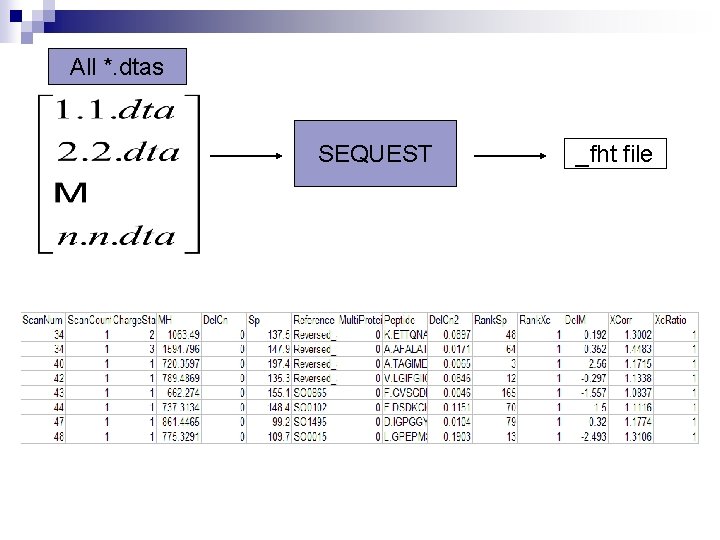
All *. dtas SEQUEST _fht file
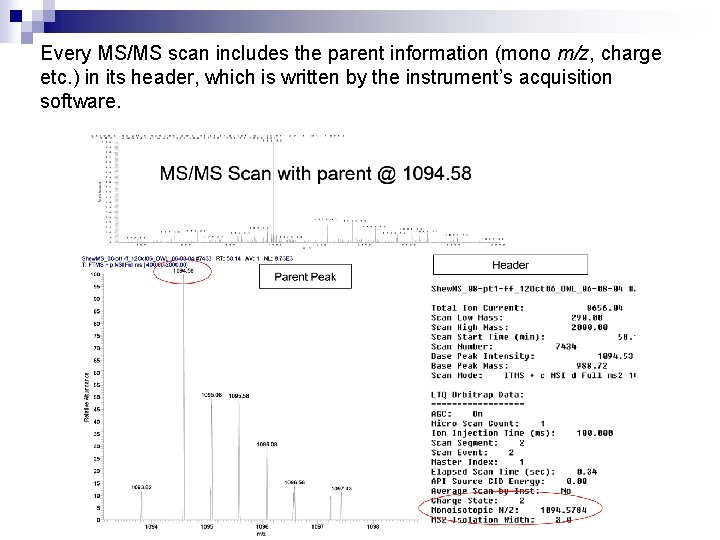
Every MS/MS scan includes the parent information (mono m/z, charge etc. ) in its header, which is written by the instrument’s acquisition software.
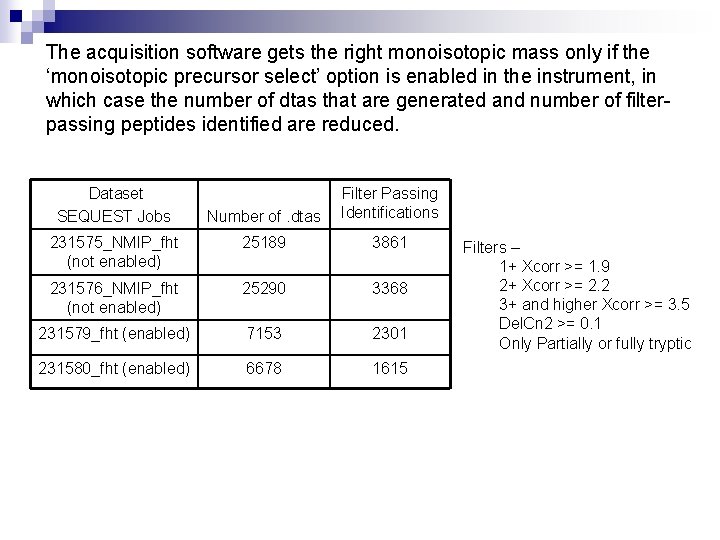
The acquisition software gets the right monoisotopic mass only if the ‘monoisotopic precursor select’ option is enabled in the instrument, in which case the number of dtas that are generated and number of filterpassing peptides identified are reduced. Dataset SEQUEST Jobs Number of. dtas Filter Passing Identifications 231575_NMIP_fht (not enabled) 25189 3861 231576_NMIP_fht (not enabled) 25290 3368 231579_fht (enabled) 7153 2301 231580_fht (enabled) 6678 1615 Filters – 1+ Xcorr >= 1. 9 2+ Xcorr >= 2. 2 3+ and higher Xcorr >= 3. 5 Del. Cn 2 >= 0. 1 Only Partially or fully tryptic
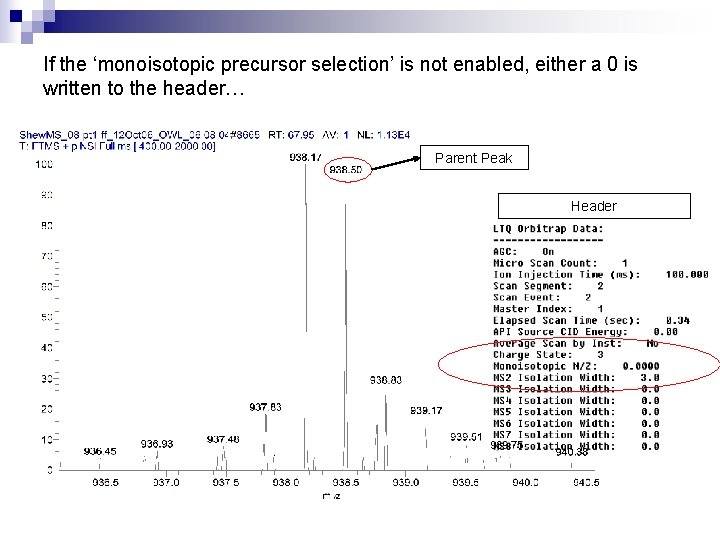
If the ‘monoisotopic precursor selection’ is not enabled, either a 0 is written to the header… Parent Peak Header
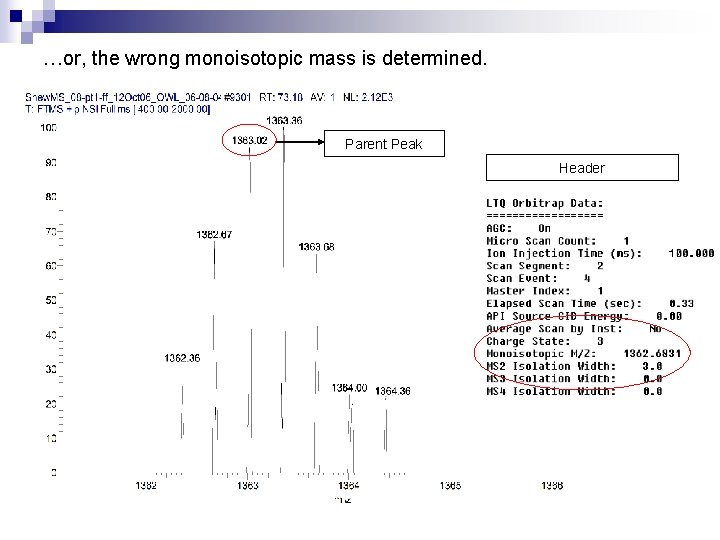
…or, the wrong monoisotopic mass is determined. Parent Peak Header
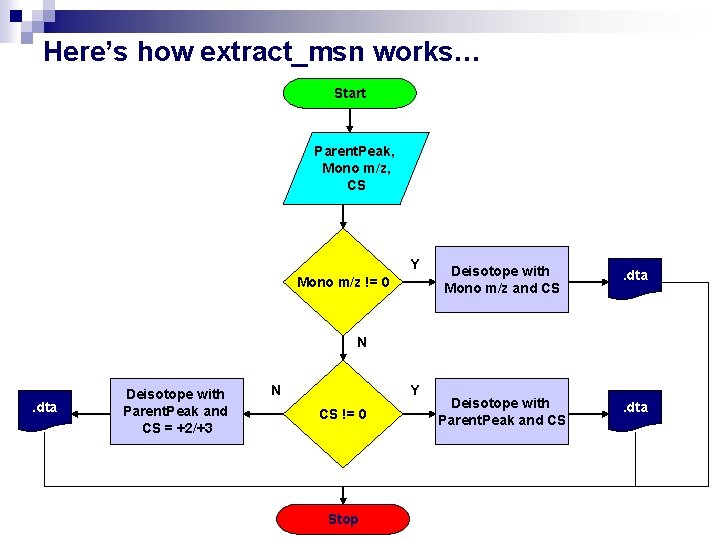
Here’s how extract_msn works… Start Parent. Peak, Mono m/z, CS Y Mono m/z != 0 Deisotope with Mono m/z and CS . dta Deisotope with Parent. Peak and CS . dta N . dta Deisotope with Parent. Peak and CS = +2/+3 N Y CS != 0 Stop
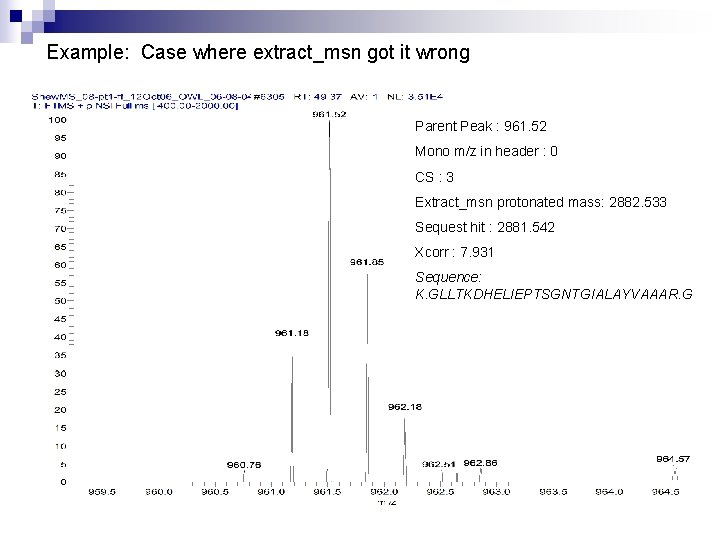
Example: Case where extract_msn got it wrong Parent Peak : 961. 52 Mono m/z in header : 0 CS : 3 Extract_msn protonated mass: 2882. 533 Sequest hit : 2881. 542 Xcorr : 7. 931 Sequence: K. GLLTKDHELIEPTSGNTGIALAYVAAAR. G
Our solution: Use a combination of THRASH and charge state based peak finding routines to correctly deisotope the parent isotopic distribution
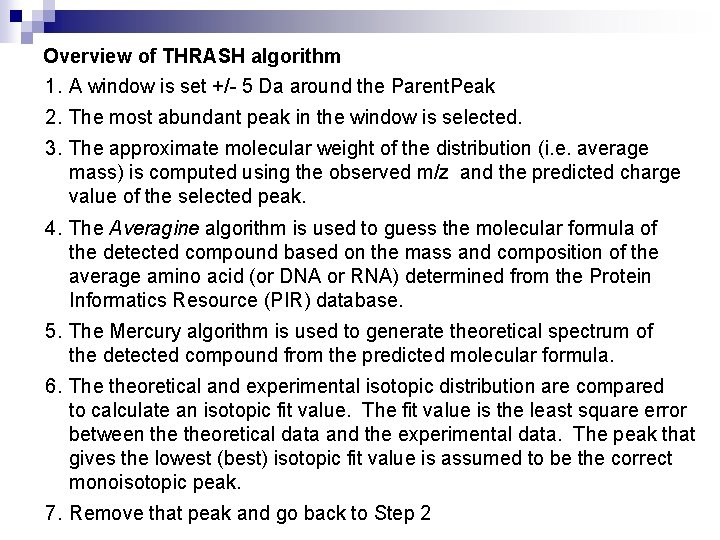
Overview of THRASH algorithm 1. A window is set +/- 5 Da around the Parent. Peak 2. The most abundant peak in the window is selected. 3. The approximate molecular weight of the distribution (i. e. average mass) is computed using the observed m/z and the predicted charge value of the selected peak. 4. The Averagine algorithm is used to guess the molecular formula of the detected compound based on the mass and composition of the average amino acid (or DNA or RNA) determined from the Protein Informatics Resource (PIR) database. 5. The Mercury algorithm is used to generate theoretical spectrum of the detected compound from the predicted molecular formula. 6. The theoretical and experimental isotopic distribution are compared to calculate an isotopic fit value. The fit value is the least square error between theoretical data and the experimental data. The peak that gives the lowest (best) isotopic fit value is assumed to be the correct monoisotopic peak. 7. Remove that peak and go back to Step 2
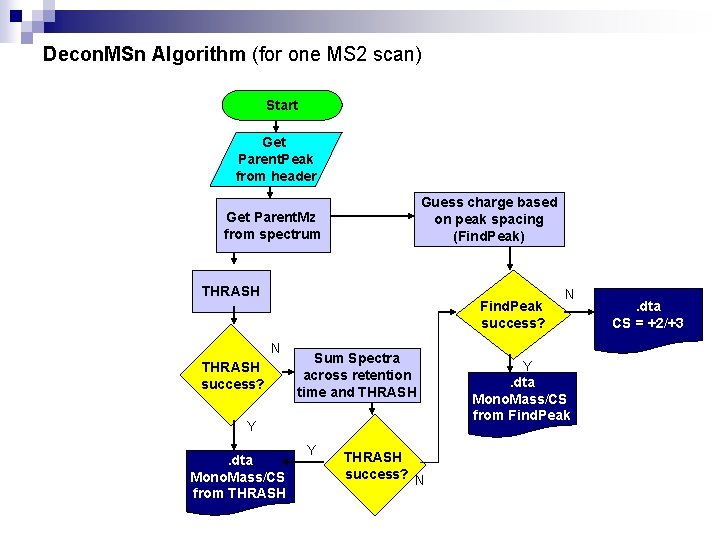
Decon. MSn Algorithm (for one MS 2 scan) Start Get Parent. Peak from header Guess charge based on peak spacing (Find. Peak) Get Parent. Mz from spectrum THRASH Find. Peak success? N THRASH success? Sum Spectra across retention time and THRASH Y. dta Mono. Mass/CS from THRASH Y THRASH success? N N Y. dta Mono. Mass/CS from Find. Peak . dta CS = +2/+3
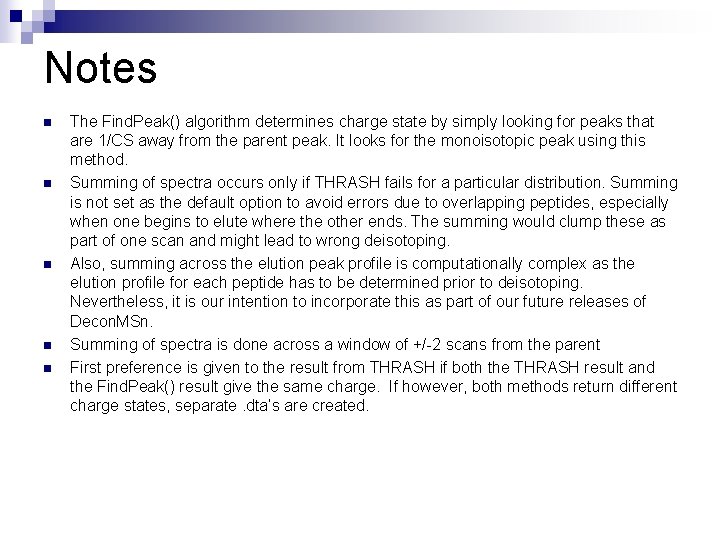
Notes n n n The Find. Peak() algorithm determines charge state by simply looking for peaks that are 1/CS away from the parent peak. It looks for the monoisotopic peak using this method. Summing of spectra occurs only if THRASH fails for a particular distribution. Summing is not set as the default option to avoid errors due to overlapping peptides, especially when one begins to elute where the other ends. The summing would clump these as part of one scan and might lead to wrong deisotoping. Also, summing across the elution peak profile is computationally complex as the elution profile for each peptide has to be determined prior to deisotoping. Nevertheless, it is our intention to incorporate this as part of our future releases of Decon. MSn. Summing of spectra is done across a window of +/-2 scans from the parent First preference is given to the result from THRASH if both the THRASH result and the Find. Peak() result give the same charge. If however, both methods return different charge states, separate. dta’s are created.
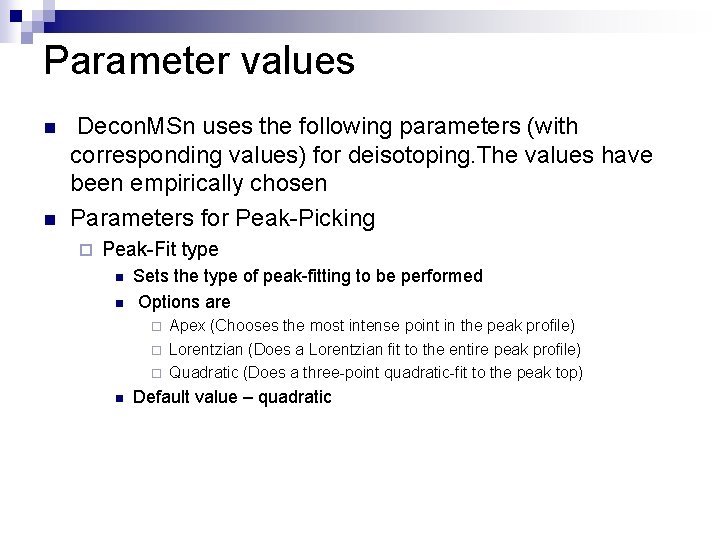
Parameter values n n Decon. MSn uses the following parameters (with corresponding values) for deisotoping. The values have been empirically chosen Parameters for Peak-Picking ¨ Peak-Fit type n n Sets the type of peak-fitting to be performed Options are ¨ ¨ ¨ n Apex (Chooses the most intense point in the peak profile) Lorentzian (Does a Lorentzian fit to the entire peak profile) Quadratic (Does a three-point quadratic-fit to the peak top) Default value – quadratic
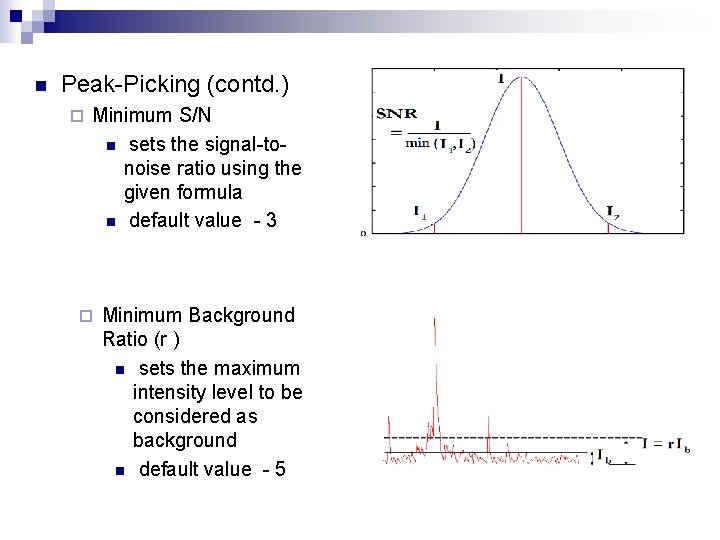
n Peak-Picking (contd. ) ¨ Minimum S/N n sets the signal-tonoise ratio using the given formula n default value - 3 ¨ Minimum Background Ratio (r ) n sets the maximum intensity level to be considered as background n default value - 5
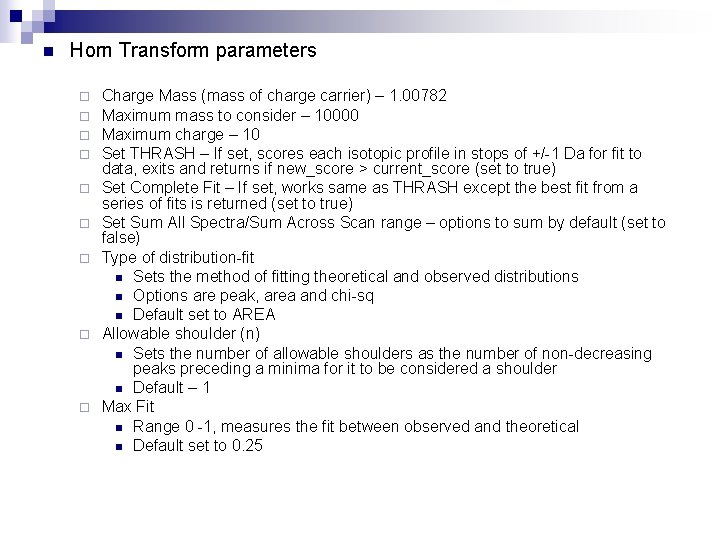
n Horn Transform parameters ¨ ¨ ¨ ¨ ¨ Charge Mass (mass of charge carrier) – 1. 00782 Maximum mass to consider – 10000 Maximum charge – 10 Set THRASH – If set, scores each isotopic profile in stops of +/-1 Da for fit to data, exits and returns if new_score > current_score (set to true) Set Complete Fit – If set, works same as THRASH except the best fit from a series of fits is returned (set to true) Set Sum All Spectra/Sum Across Scan range – options to sum by default (set to false) Type of distribution-fit n Sets the method of fitting theoretical and observed distributions n Options are peak, area and chi-sq n Default set to AREA Allowable shoulder (n) n Sets the number of allowable shoulders as the number of non-decreasing peaks preceding a minima for it to be considered a shoulder n Default – 1 Max Fit n Range 0 -1, measures the fit between observed and theoretical n Default set to 0. 25
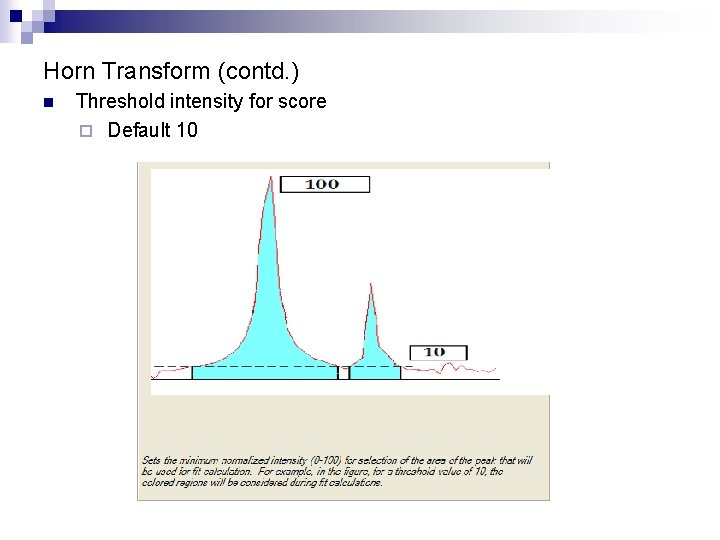
Horn Transform (contd. ) n Threshold intensity for score ¨ Default 10
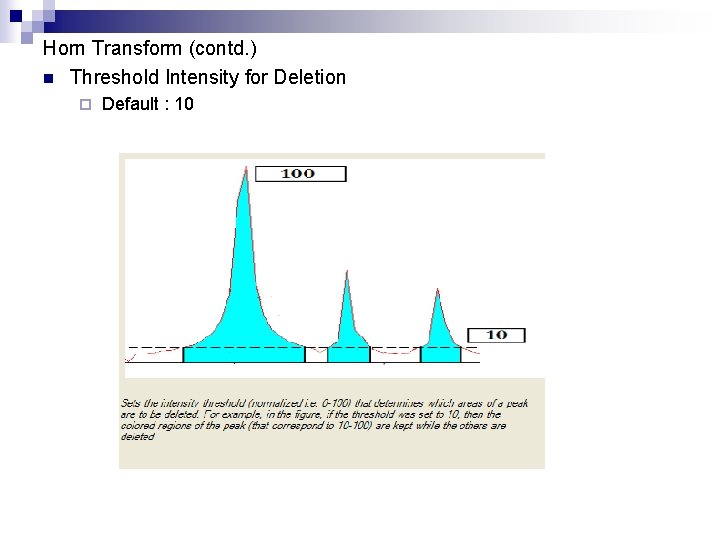
Horn Transform (contd. ) n Threshold Intensity for Deletion ¨ Default : 10
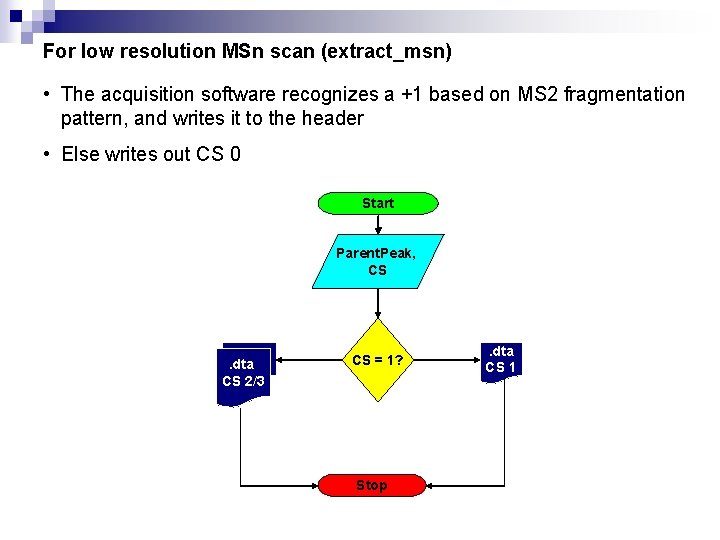
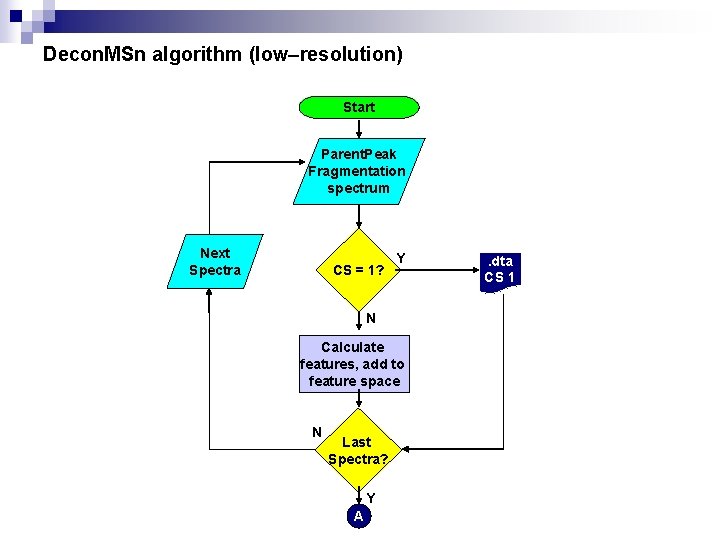
For low resolution MSn scan (extract_msn) • The acquisition software recognizes a +1 based on MS 2 fragmentation pattern, and writes it to the header • Else writes out CS 0 Start Parent. Peak, CS . dta CS 2/3 CS = 1? Stop . dta CS 1
Decon. MSn handles low resolution as follows: • A set of features based on [1] are calculated for every fragmentation spectrum. • The features are given to a trained Support-Vector-Machine (SVM) that tries to assign a charge state based on the feature values. • Deisotope using Parent. Peak and the CS that the SVM returns [1] “Peptide charge state determination for low-resolution tandem mass spectra” A. Klammer et al. , “Proceedings of 2005 IEEE Computational Systems Bioinformatics Conference”
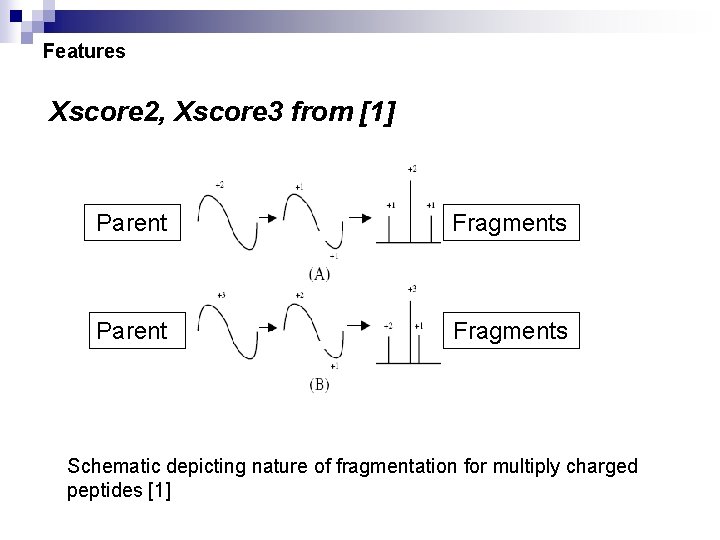
Features Xscore 2, Xscore 3 from [1] Parent Fragments Schematic depicting nature of fragmentation for multiply charged peptides [1]
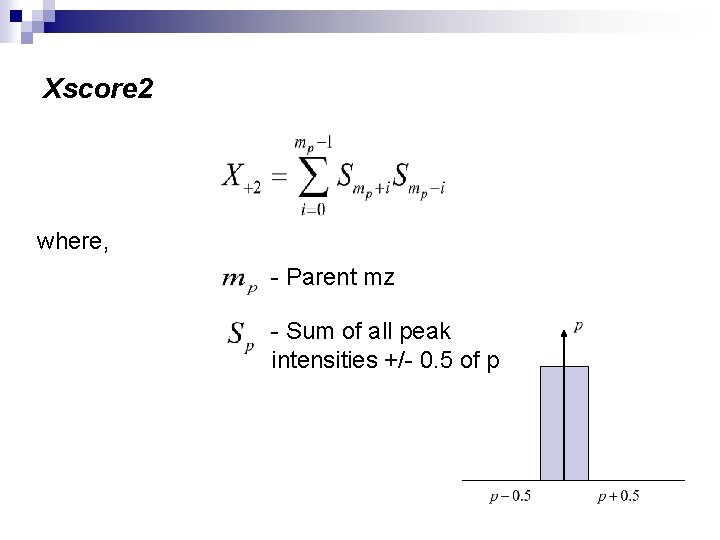
Xscore 2 where, - Parent mz - Sum of all peak intensities +/- 0. 5 of p
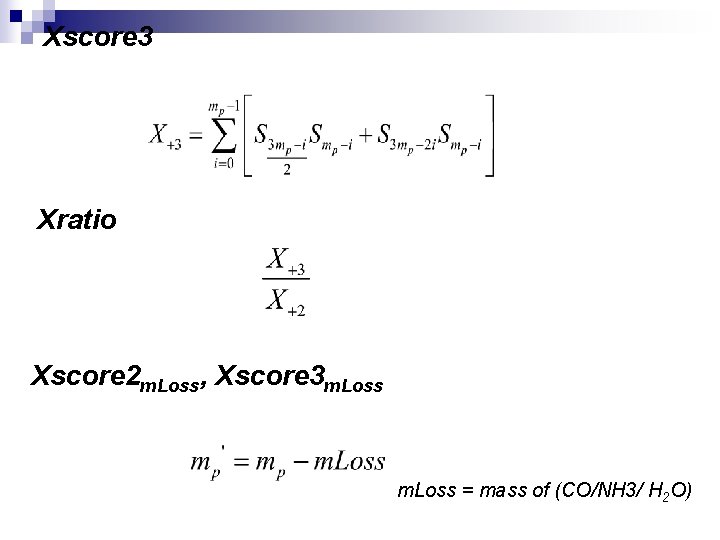
Xscore 3 Xratio Xscore 2 m. Loss, Xscore 3 m. Loss = mass of (CO/NH 3/ H 2 O)
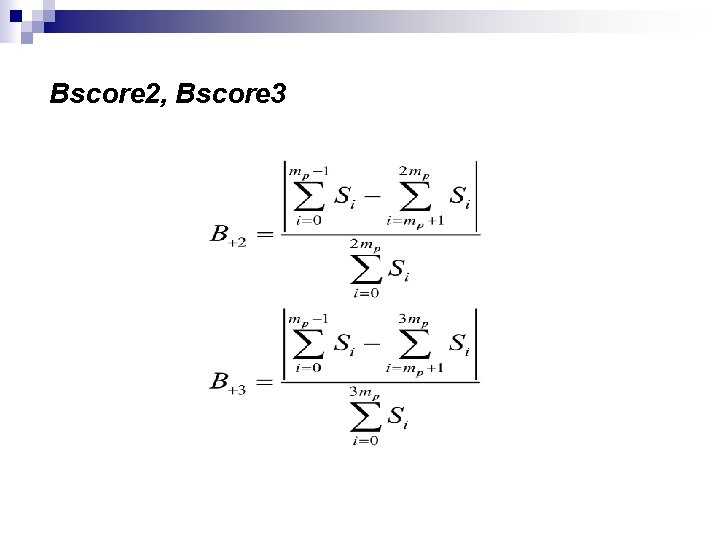
Bscore 2, Bscore 3
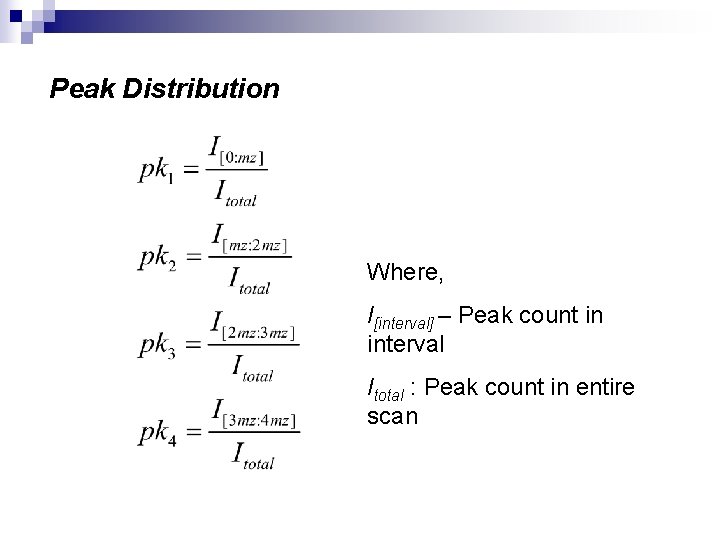
Peak Distribution Where, I[interval] – Peak count in interval Itotal : Peak count in entire scan
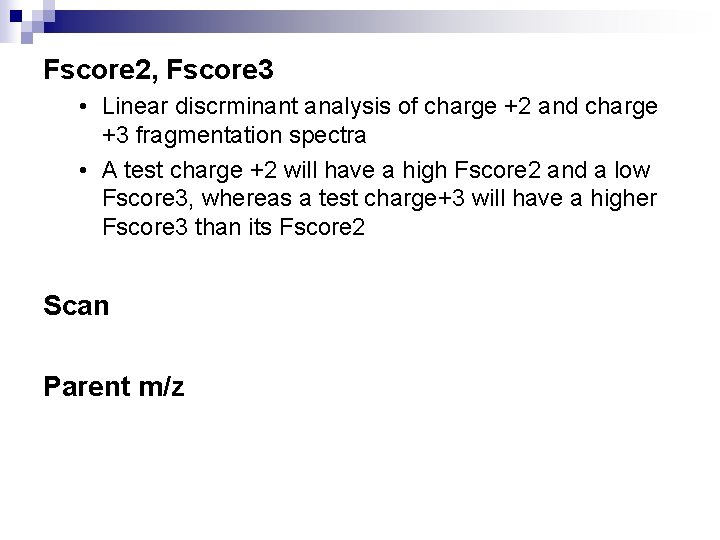
Fscore 2, Fscore 3 • Linear discrminant analysis of charge +2 and charge +3 fragmentation spectra • A test charge +2 will have a high Fscore 2 and a low Fscore 3, whereas a test charge+3 will have a higher Fscore 3 than its Fscore 2 Scan Parent m/z
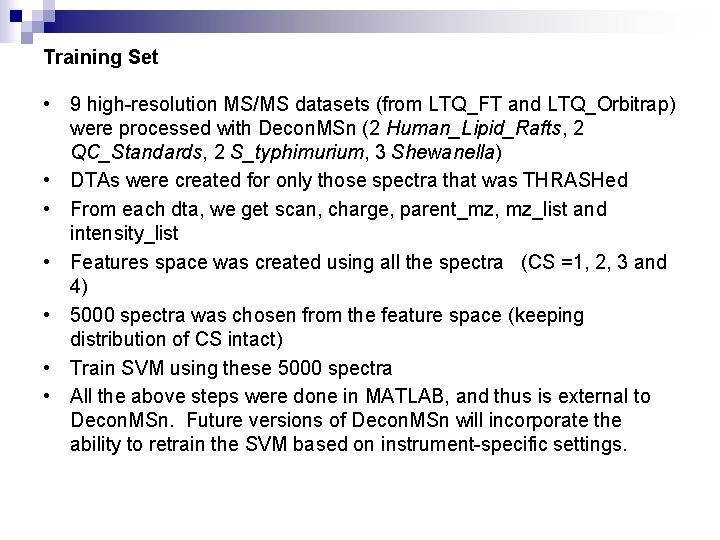
Training Set • 9 high-resolution MS/MS datasets (from LTQ_FT and LTQ_Orbitrap) were processed with Decon. MSn (2 Human_Lipid_Rafts, 2 QC_Standards, 2 S_typhimurium, 3 Shewanella) • DTAs were created for only those spectra that was THRASHed • From each dta, we get scan, charge, parent_mz, mz_list and intensity_list • Features space was created using all the spectra (CS =1, 2, 3 and 4) • 5000 spectra was chosen from the feature space (keeping distribution of CS intact) • Train SVM using these 5000 spectra • All the above steps were done in MATLAB, and thus is external to Decon. MSn. Future versions of Decon. MSn will incorporate the ability to retrain the SVM based on instrument-specific settings.
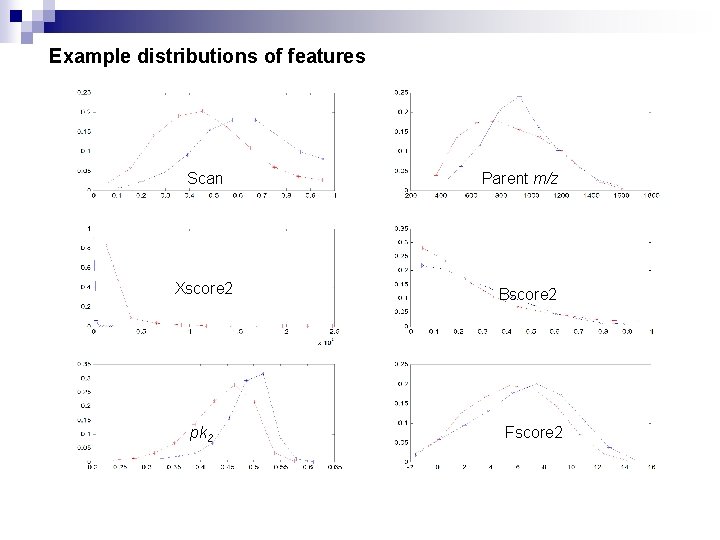
Example distributions of features Scan Xscore 2 pk 2 Parent m/z Bscore 2 Fscore 2
Decon. MSn algorithm (low–resolution) Start Parent. Peak Fragmentation spectrum Next Spectra CS = 1? Y N Calculate features, add to feature space N Last Spectra? Y A . dta CS 1
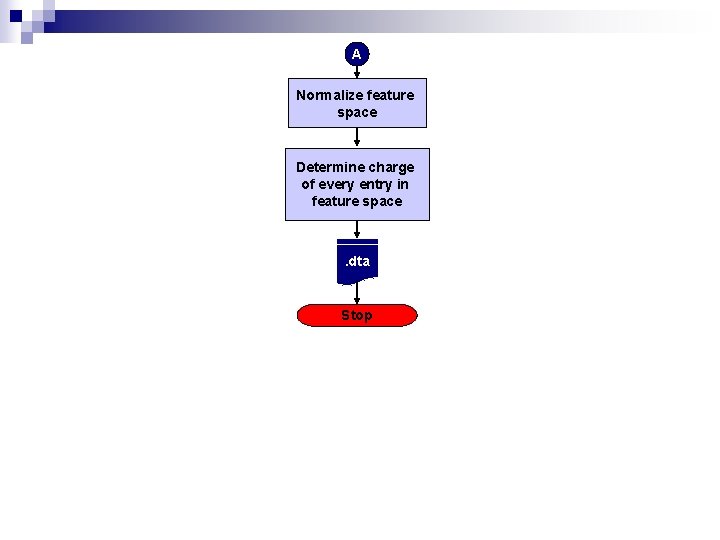
A Normalize feature space Determine charge of every entry in feature space . dta Stop
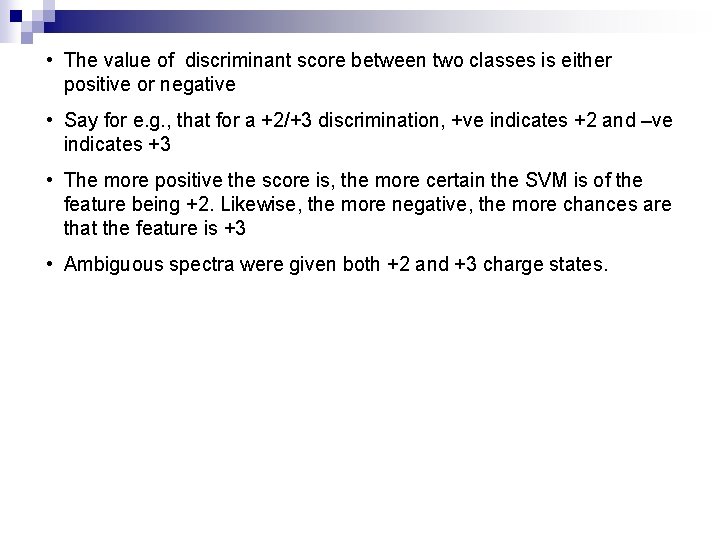
• The value of discriminant score between two classes is either positive or negative • Say for e. g. , that for a +2/+3 discrimination, +ve indicates +2 and –ve indicates +3 • The more positive the score is, the more certain the SVM is of the feature being +2. Likewise, the more negative, the more chances are that the feature is +3 • Ambiguous spectra were given both +2 and +3 charge states.
Results
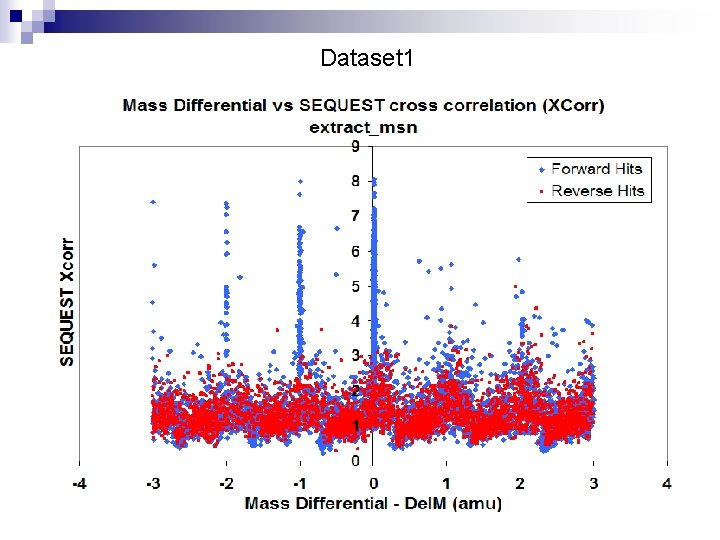
Dataset 1
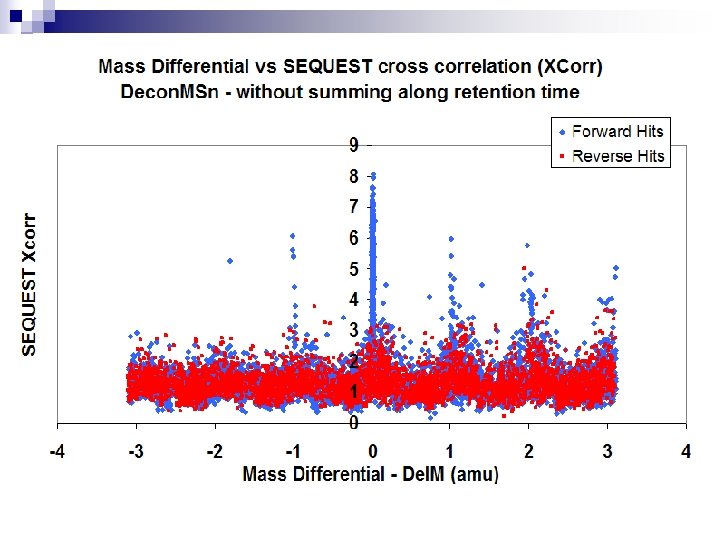
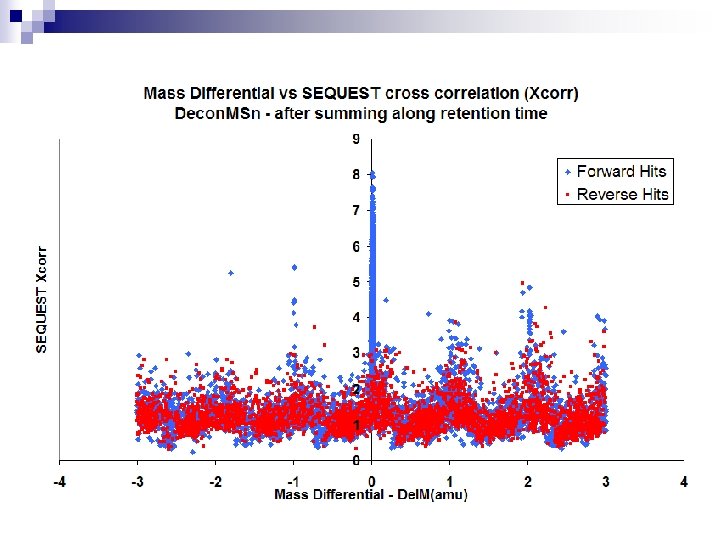
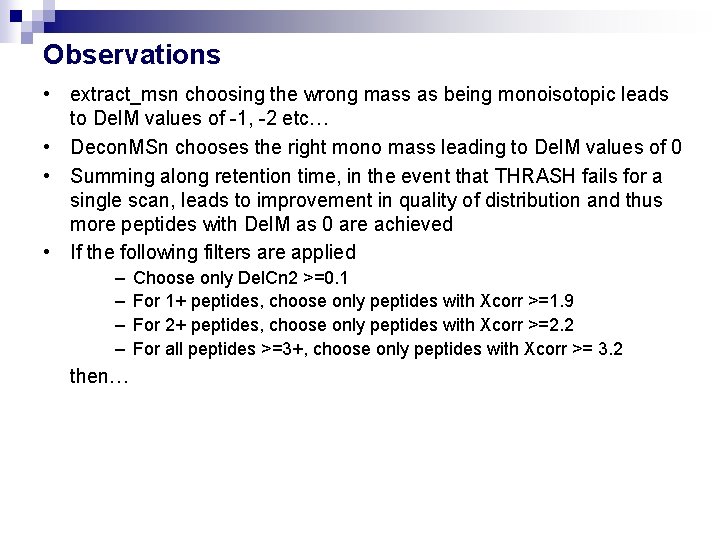
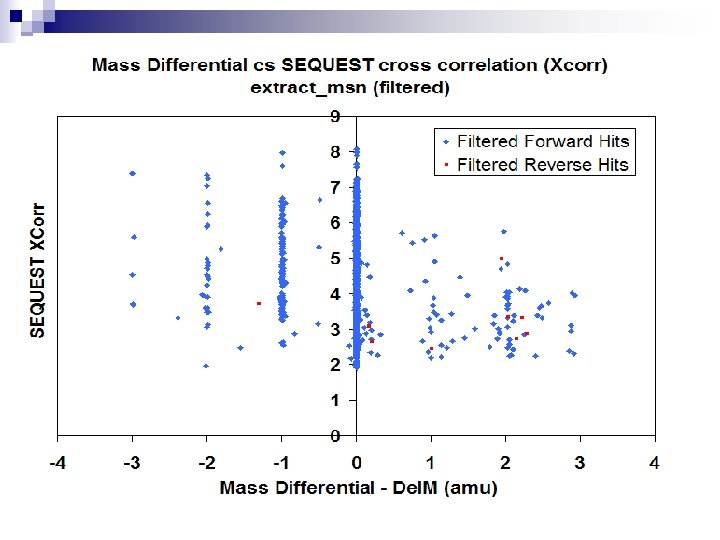
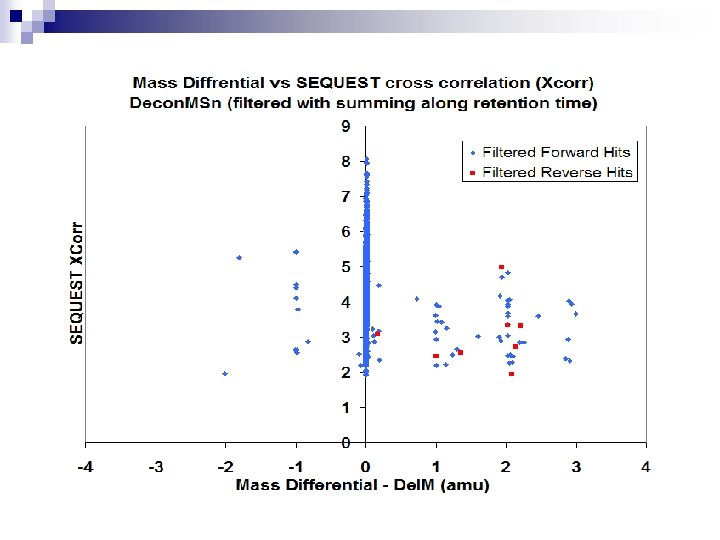
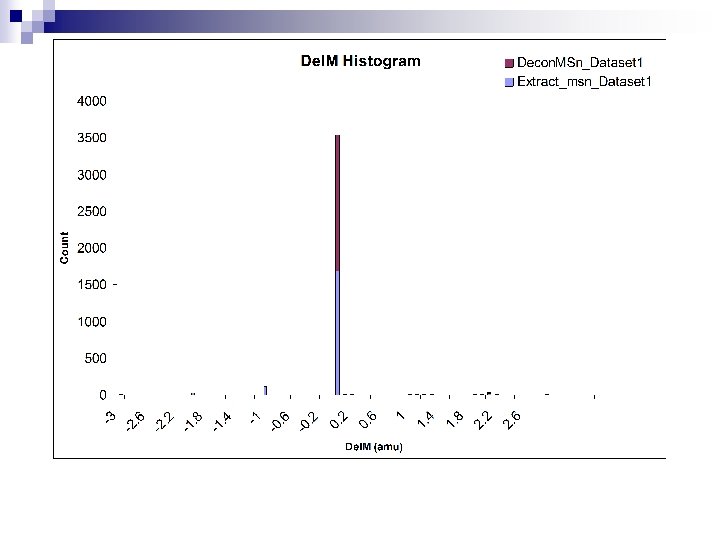
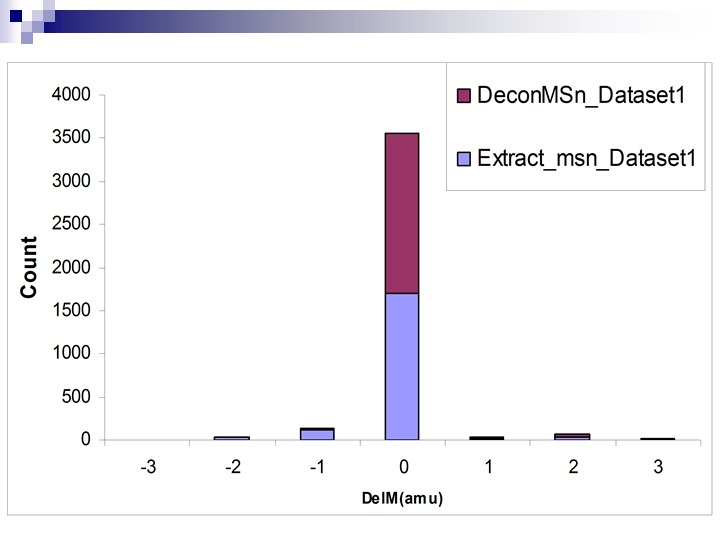
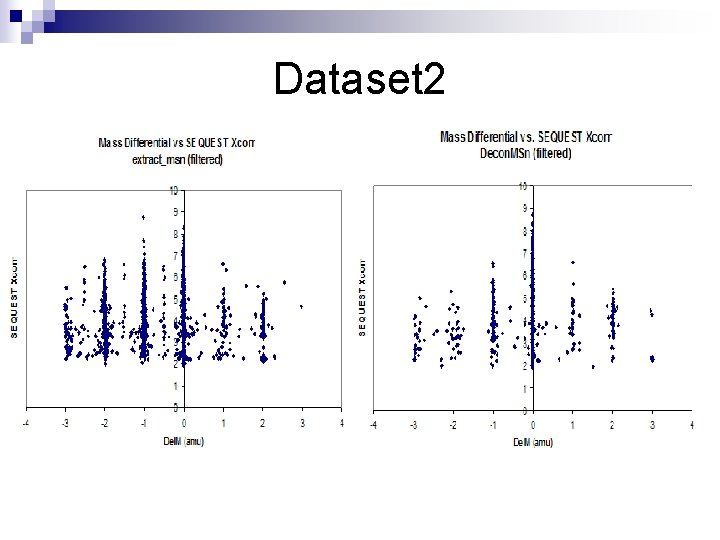
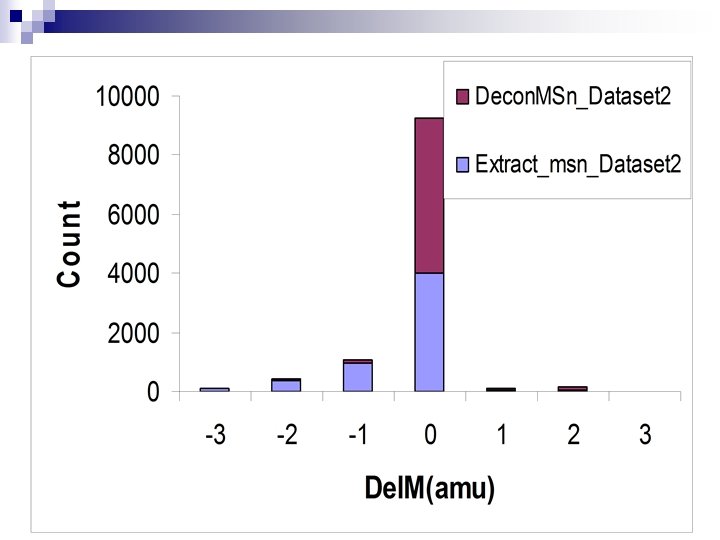
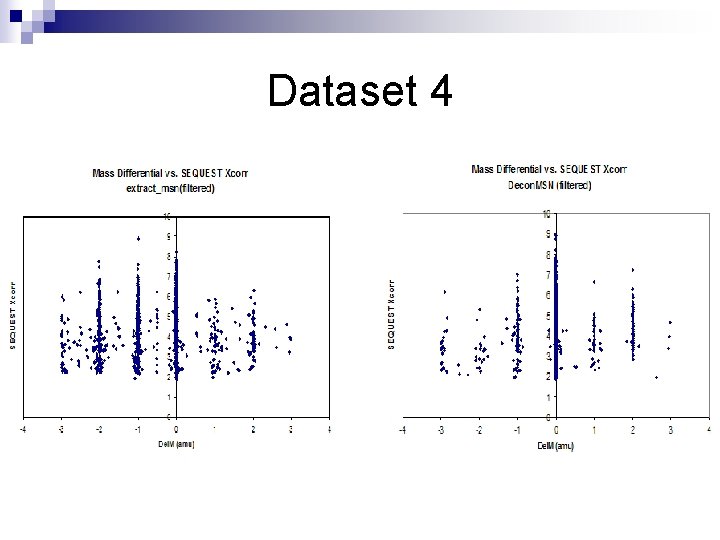
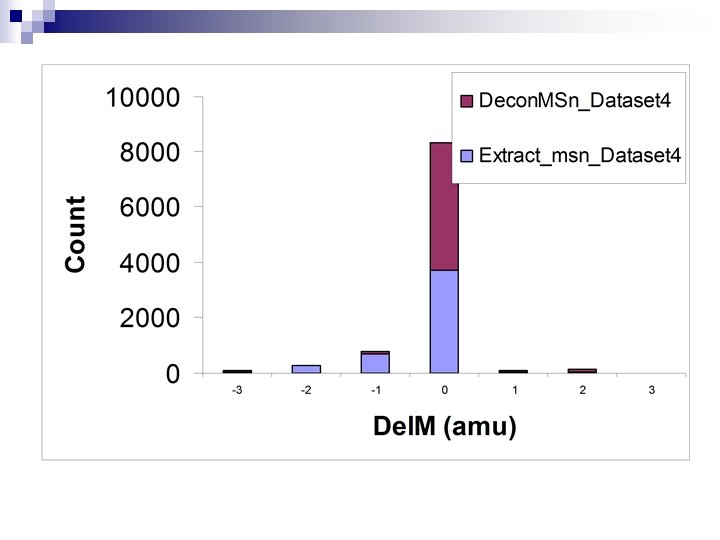
Observations • extract_msn choosing the wrong mass as being monoisotopic leads to Del. M values of -1, -2 etc… • Decon. MSn chooses the right mono mass leading to Del. M values of 0 • Summing along retention time, in the event that THRASH fails for a single scan, leads to improvement in quality of distribution and thus more peptides with Del. M as 0 are achieved • If the following filters are applied – – then… Choose only Del. Cn 2 >=0. 1 For 1+ peptides, choose only peptides with Xcorr >=1. 9 For 2+ peptides, choose only peptides with Xcorr >=2. 2 For all peptides >=3+, choose only peptides with Xcorr >= 3. 2
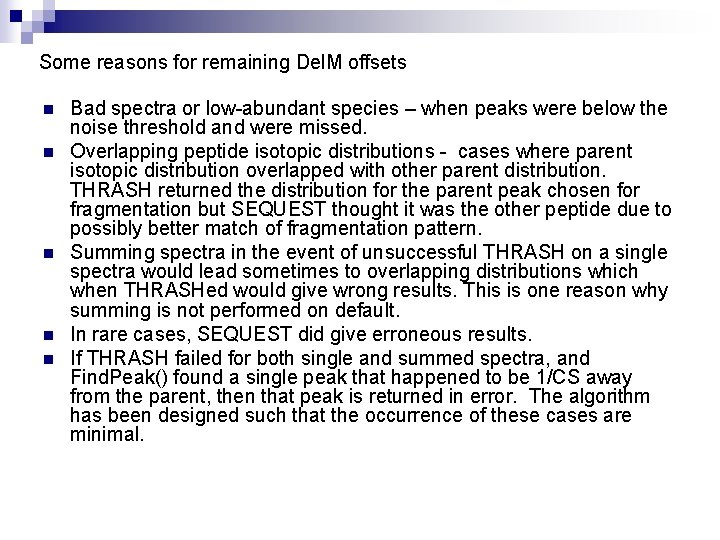
Some reasons for remaining Del. M offsets n n n Bad spectra or low-abundant species – when peaks were below the noise threshold and were missed. Overlapping peptide isotopic distributions - cases where parent isotopic distribution overlapped with other parent distribution. THRASH returned the distribution for the parent peak chosen for fragmentation but SEQUEST thought it was the other peptide due to possibly better match of fragmentation pattern. Summing spectra in the event of unsuccessful THRASH on a single spectra would lead sometimes to overlapping distributions which when THRASHed would give wrong results. This is one reason why summing is not performed on default. In rare cases, SEQUEST did give erroneous results. If THRASH failed for both single and summed spectra, and Find. Peak() found a single peak that happened to be 1/CS away from the parent, then that peak is returned in error. The algorithm has been designed such that the occurrence of these cases are minimal.
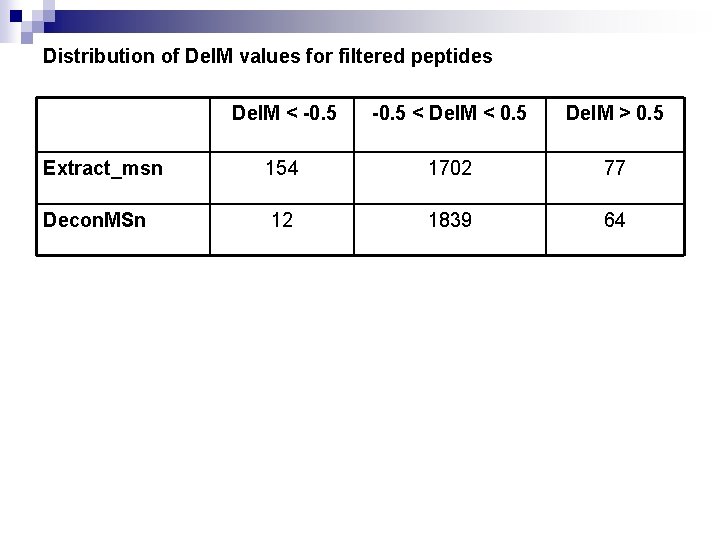
Distribution of Del. M values for filtered peptides Del. M < -0. 5 < Del. M < 0. 5 Del. M > 0. 5 Extract_msn 154 1702 77 Decon. MSn 12 1839 64
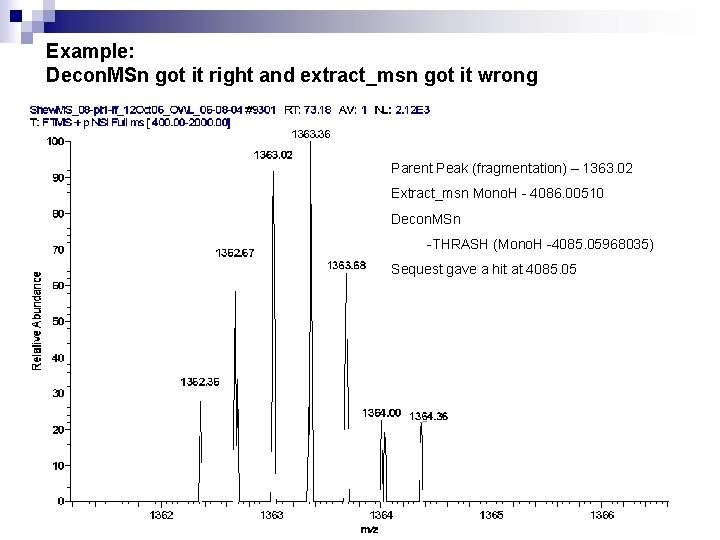
Example: Decon. MSn got it right and extract_msn got it wrong Parent Peak (fragmentation) – 1363. 02 Extract_msn Mono. H - 4086. 00510 Decon. MSn -THRASH (Mono. H -4085. 05968035) Sequest gave a hit at 4085. 05
Other datasets
Dataset 2
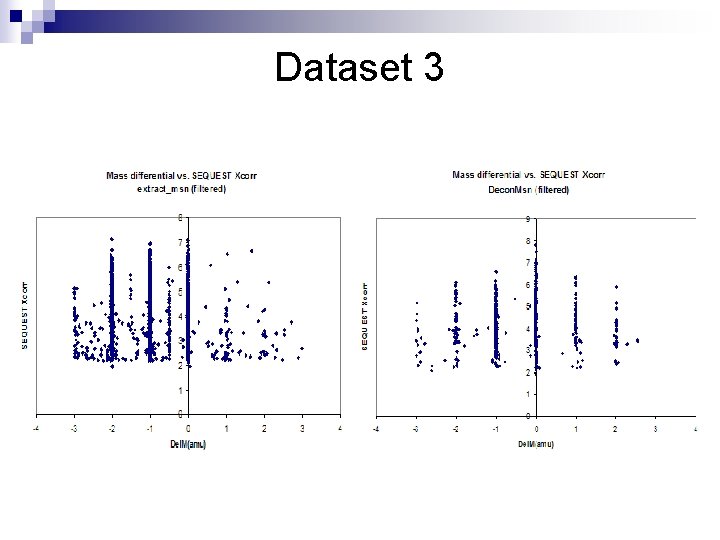
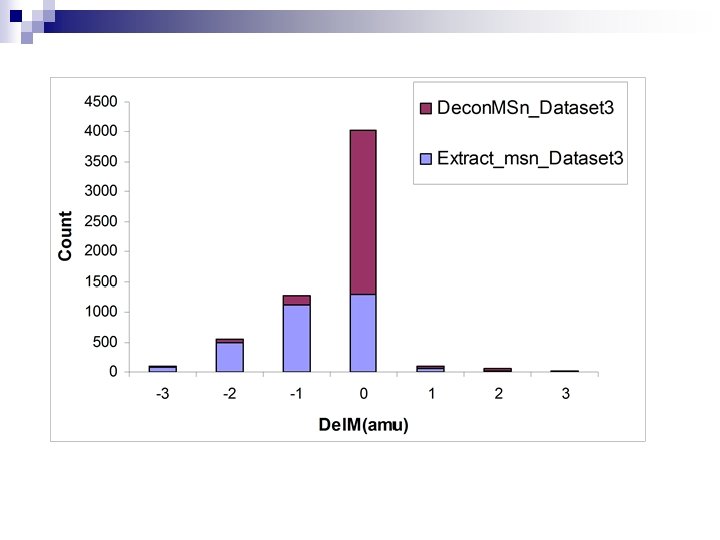
Dataset 3
Some notes for Dataset 3 n n The threshold for the ion intensity to be selected for fragmentation was set to a very low value the result being low-intensity ions near a peptide distribution were chosen for fragmentation. Extract_msn gave default charge states of +2 and +3 Decon. MSn was not able to return a THRASH result for a single spectrum, but was able to find a good isotopic distribution for a summed spectrum, and thus returned the correct monoisotopic mass However, summing all the time is a bad idea as noise peaks get added on to the isotopic distribution which when THRASHed would result in +Del. Ms. The same is true for overlapping distributions too.
Dataset 4
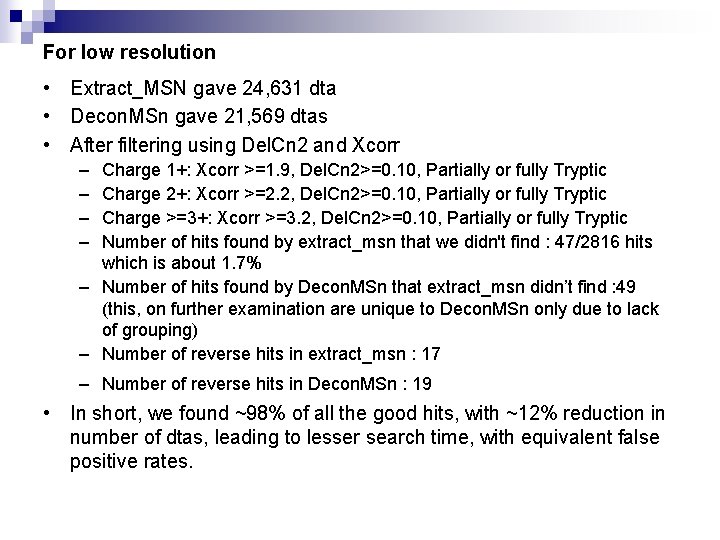
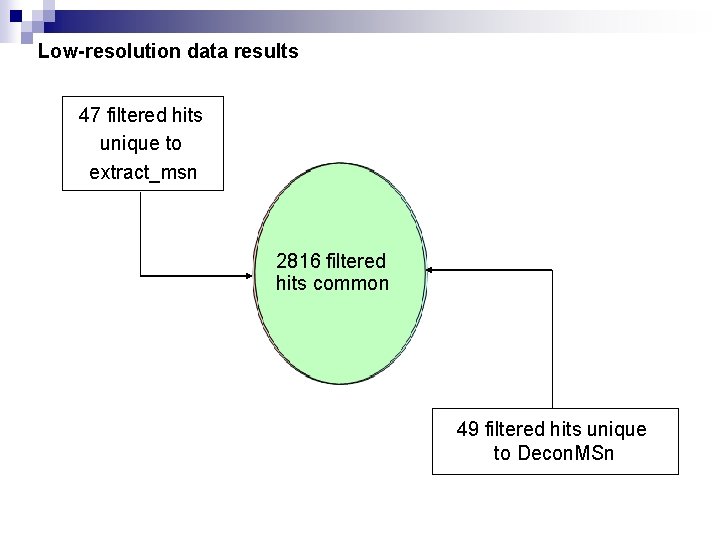
For low resolution • Extract_MSN gave 24, 631 dta • Decon. MSn gave 21, 569 dtas • After filtering using Del. Cn 2 and Xcorr – – Charge 1+: Xcorr >=1. 9, Del. Cn 2>=0. 10, Partially or fully Tryptic Charge 2+: Xcorr >=2. 2, Del. Cn 2>=0. 10, Partially or fully Tryptic Charge >=3+: Xcorr >=3. 2, Del. Cn 2>=0. 10, Partially or fully Tryptic Number of hits found by extract_msn that we didn't find : 47/2816 hits which is about 1. 7% – Number of hits found by Decon. MSn that extract_msn didn’t find : 49 (this, on further examination are unique to Decon. MSn only due to lack of grouping) – Number of reverse hits in extract_msn : 17 – Number of reverse hits in Decon. MSn : 19 • In short, we found ~98% of all the good hits, with ~12% reduction in number of dtas, leading to lesser search time, with equivalent false positive rates.
Low-resolution data results 47 filtered hits unique to extract_msn 2816 filtered hits common 49 filtered hits unique to Decon. MSn
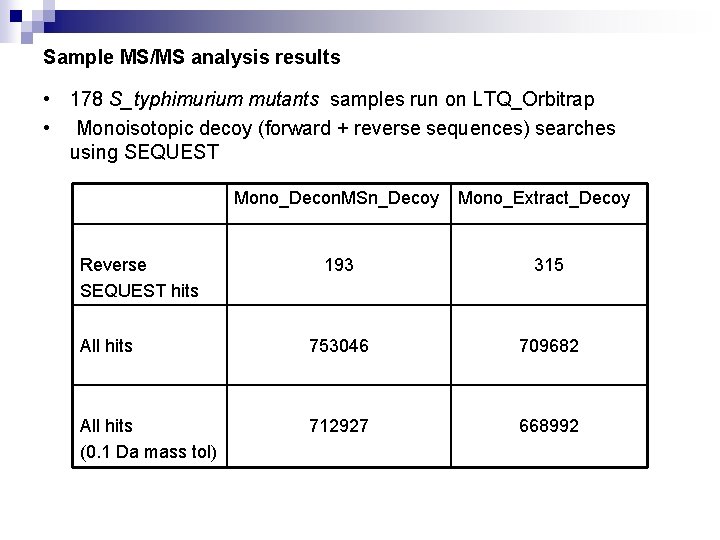
Sample MS/MS analysis results • 178 S_typhimurium mutants samples run on LTQ_Orbitrap • Monoisotopic decoy (forward + reverse sequences) searches using SEQUEST Mono_Decon. MSn_Decoy Mono_Extract_Decoy 193 315 All hits 753046 709682 All hits (0. 1 Da mass tol) 712927 668992 Reverse SEQUEST hits
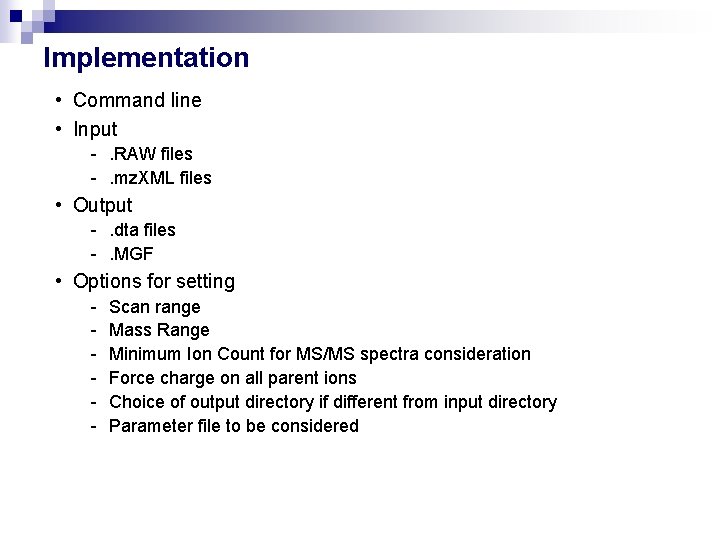
Implementation • Command line • Input -. RAW files -. mz. XML files • Output -. dta files -. MGF • Options for setting - Scan range Mass Range Minimum Ion Count for MS/MS spectra consideration Force charge on all parent ions Choice of output directory if different from input directory Parameter file to be considered
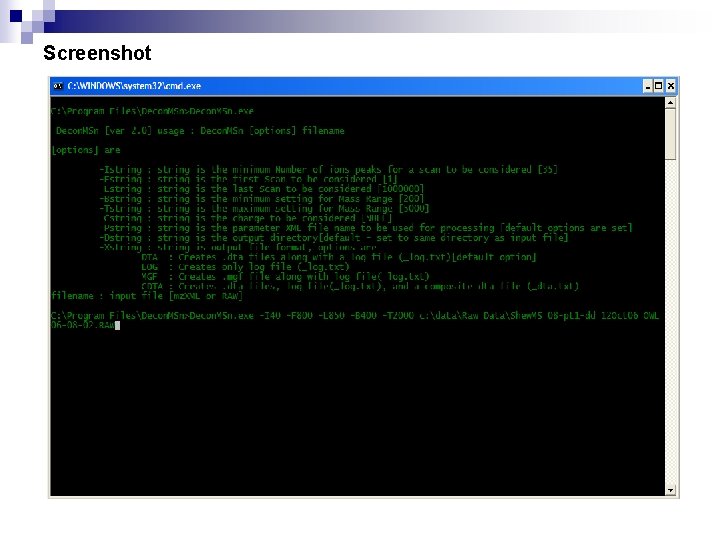
Screenshot
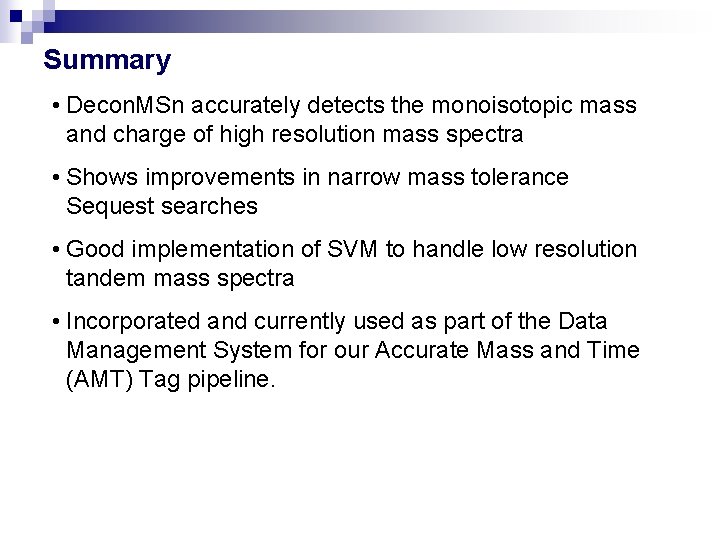
Summary • Decon. MSn accurately detects the monoisotopic mass and charge of high resolution mass spectra • Shows improvements in narrow mass tolerance Sequest searches • Good implementation of SVM to handle low resolution tandem mass spectra • Incorporated and currently used as part of the Data Management System for our Accurate Mass and Time (AMT) Tag pipeline.
Acknowledgments • • • Navdeep Jaitly Samuel Purvine Ken Auberry Matthew Monroe Joshua Adkins Richard Smith Other acknowledgements n NIH National Center for Research Resources n National Institute of Allergy and Infectious Diseases n Environmental and Molecular Sciences Laboratory (EMSL)