Declarative Tracepoints DT A programmable and Application independent
Declarative Tracepoints (DT) - A programmable and Application independent Debugging System for WSN Qing Cao, Tarek Abdelzaher(UIUC), John Stankovic, Kamin Whitehouse (UVA), Liqian Luo (MSR)
Outline �Requirements for debugging WSN �Existing techniques �Declarative Tracepoints Debugging System �Evaluation �Conclusions 2
Requirements for Debugging WSN �Watch program state to diagnose abnormal behavior �Watch the right variables at the right time �Visibility into program state �Resource constraints 3
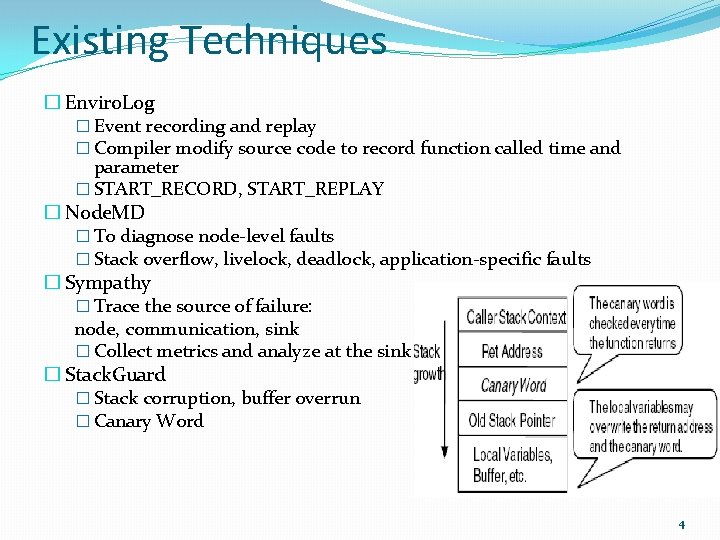
Existing Techniques � Enviro. Log � Event recording and replay � Compiler modify source code to record function called time and parameter � START_RECORD, START_REPLAY � Node. MD � To diagnose node-level faults � Stack overflow, livelock, deadlock, application-specific faults � Sympathy � Trace the source of failure: node, communication, sink � Collect metrics and analyze at the sink � Stack. Guard � Stack corruption, buffer overrun � Canary Word 4
Design of DT �Application-independent �No need of source level modification �Isolate debugging code from app code �Debugging without re-compilation or re-deployment �Programmable �Trace. SQL debugging laguage, declarative similar to SQL �Location of tracepoints and associated actions �Trace yield() FROM syscall. c Execution { RECORD yield(); } Where { READ msend->lock FROM radio. c == 1; } 5
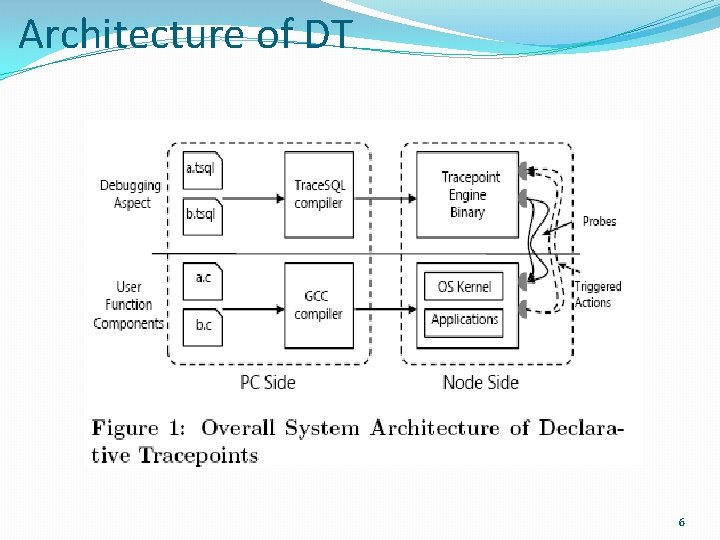
Architecture of DT 6
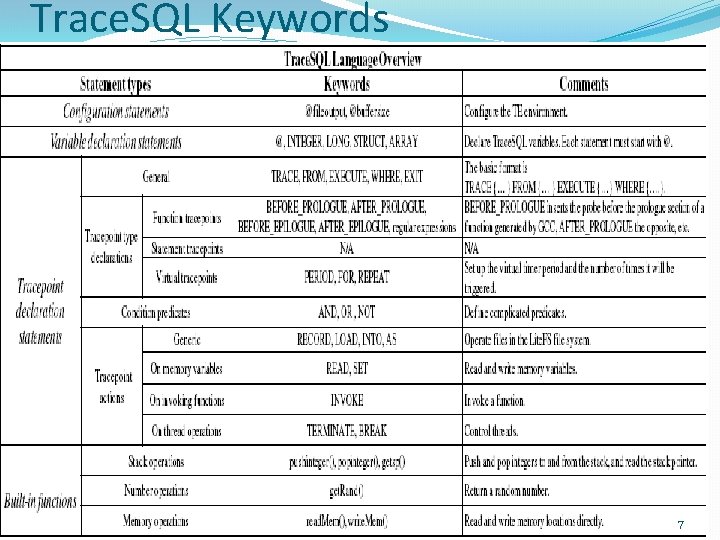
Trace. SQL Keywords 7
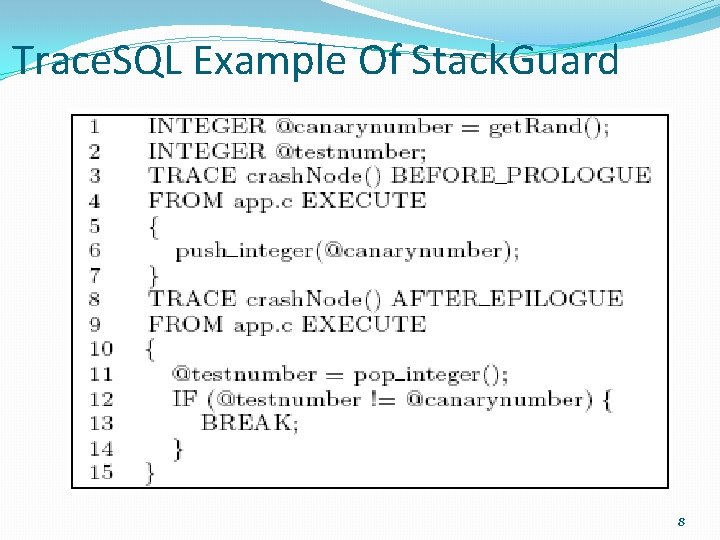
Trace. SQL Example Of Stack. Guard 8
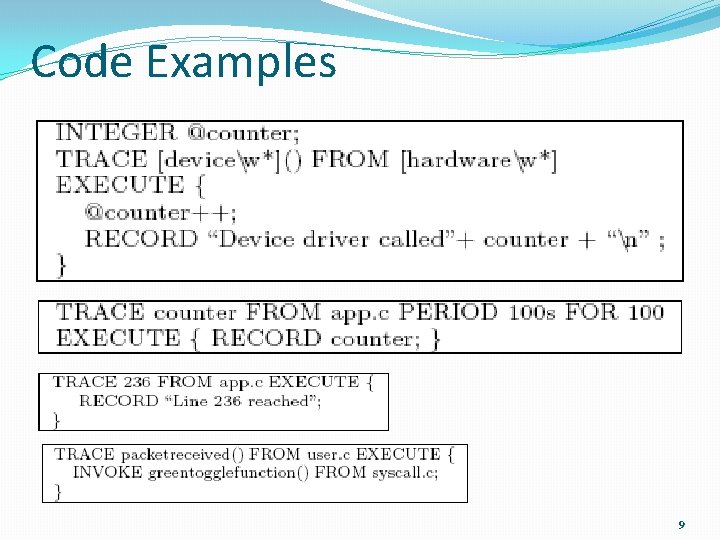
Code Examples 9
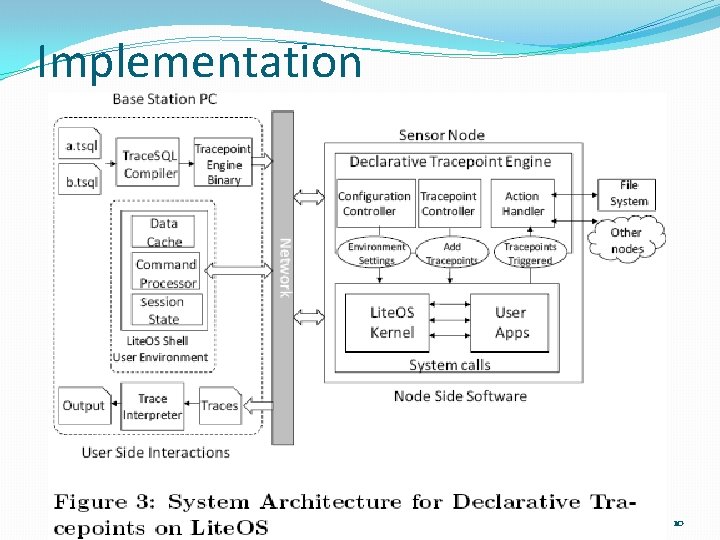
Implementation 10
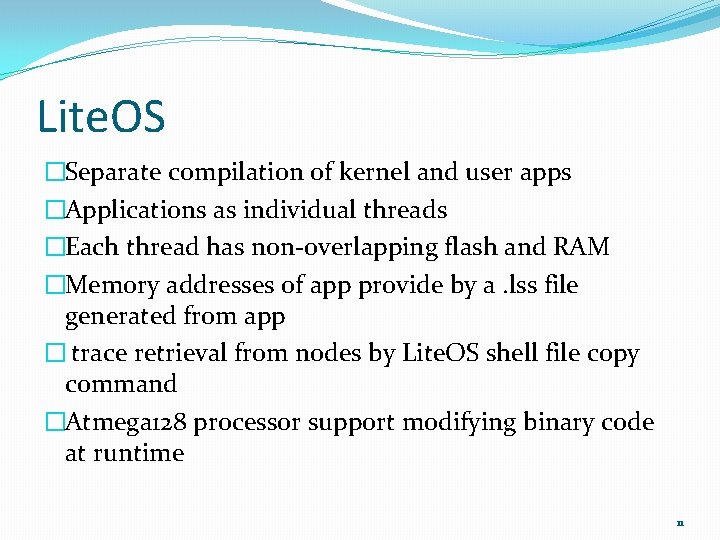
Lite. OS �Separate compilation of kernel and user apps �Applications as individual threads �Each thread has non-overlapping flash and RAM �Memory addresses of app provide by a. lss file generated from app � trace retrieval from nodes by Lite. OS shell file copy command �Atmega 128 processor support modifying binary code at runtime 11
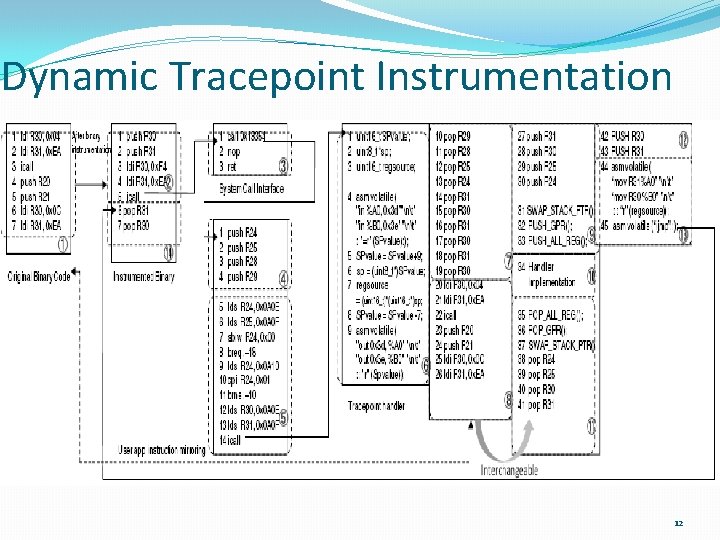
Dynamic Tracepoint Instrumentation 12
tradeoffs �Tracepoint actions focus on global variable operations �Local variable needs compiler dependent analysis �Does not address compiler specific optimization 13
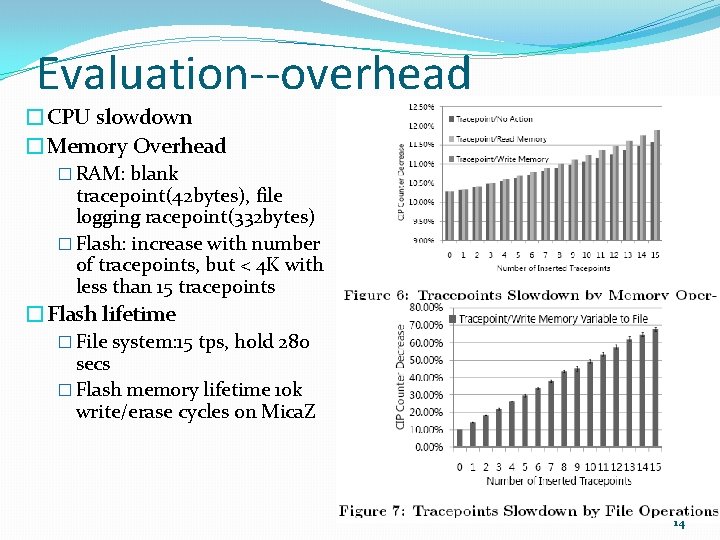
Evaluation--overhead �CPU slowdown �Memory Overhead � RAM: blank tracepoint(42 bytes), file logging racepoint(332 bytes) � Flash: increase with number of tracepoints, but < 4 K with less than 15 tracepoints �Flash lifetime � File system: 15 tps, hold 280 secs � Flash memory lifetime 10 k write/erase cycles on Mica. Z 14
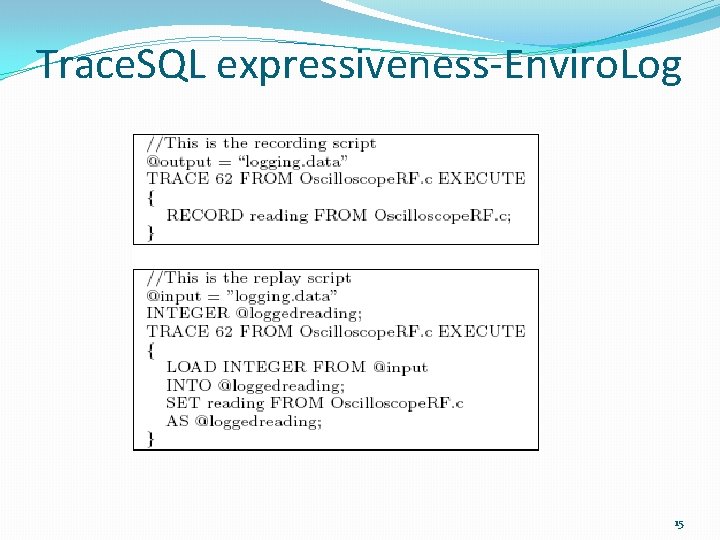
Trace. SQL expressiveness-Enviro. Log 15
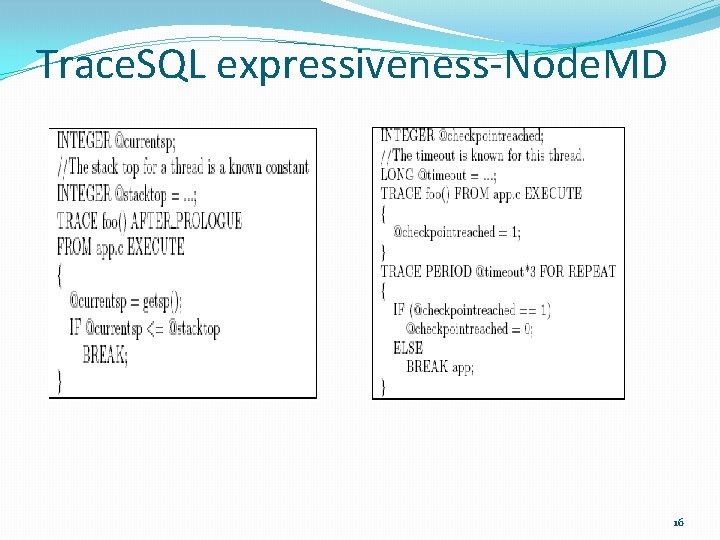
Trace. SQL expressiveness-Node. MD 16
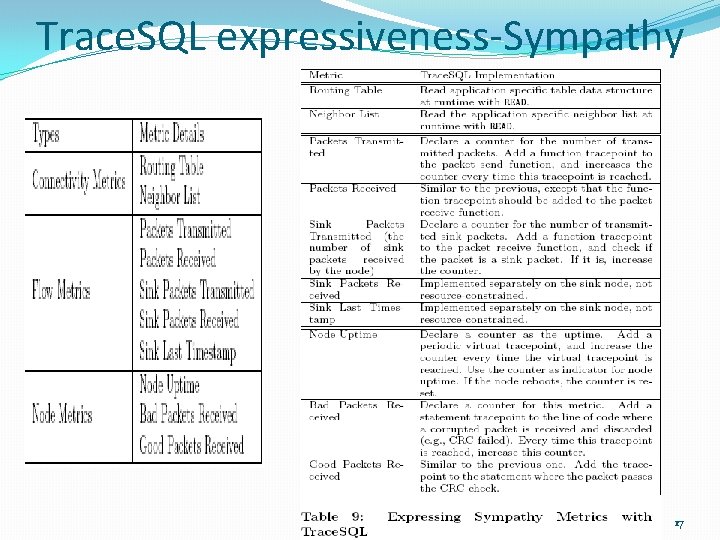
Trace. SQL expressiveness-Sympathy 17
Case Studies �Bug 1: Node reboot after changing the compiler optimization level �Bug 2: User apps put into memory_corrupted state once executed �Bug 3: Unexpected corruption of communication protocol neighbor table 18
Conclusions �Declarative tracepoint debugging system �Application independent and programmable tracepoints at runtime �Trace. SQL is expressive �Real case verification 19
- Slides: 19