DECISION TREES AND DRUG TESTING Katie Turner Operations


")


 + (0. 50*10) = 13. 5 Red = Value Green")


")


 =. 092 • the probability that the person will")


. Decision Making Under Uncertainty.")
- Slides: 34
DECISION TREES AND DRUG TESTING Katie Turner Operations Research
What Are Decision Trees? • Decision support tool that uses a tree-like graph of decisions and their possible consequences. • Chance, event outcome, expected value, and resource costs are commonly used to form a decision tree.
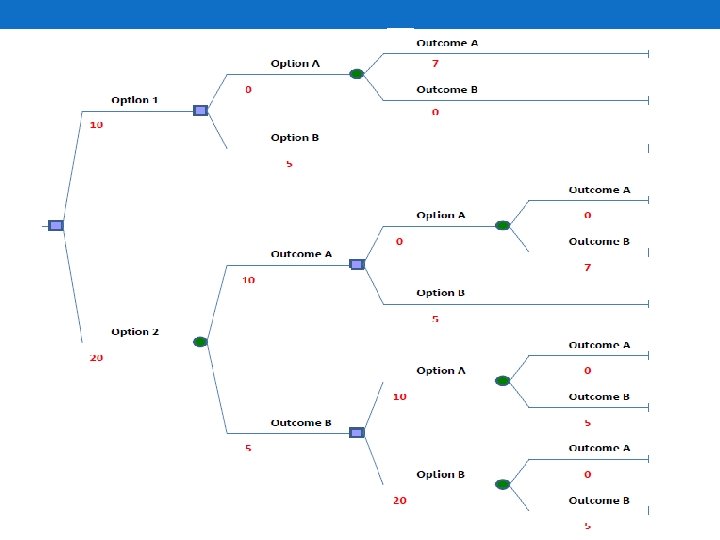
An Example of a Decision Tree
Why Use Decision Trees? • Useful when several courses of action are present with unknown outcomes. • Visually display the problem: • Present different options in a structure that makes it easy to see the possible outcomes of each option, as well as the risks and rewards associated with each course of action.
How to Create a Decision Tree • There are four basic steps to creating a decision tree: 1) Draw the Decision Tree 2) Evaluate the decision tree 3) Calculate Tree Values 4) Analyze and make a final decision based on the results of the decision tree
Step 1: Draw the Decision Tree • Decision trees are made up of two parts: • Nodes • Junction points in the decision tree • Branches • Lines connecting the nodes • There are two types of nodes: • Decision Nodes • Represented by a square • Indicate that a decision needs to be made at that point in the process • Event Nodes • Represented by a circle • Indicates that a random event occurs at that point
Step 1: Draw the Decision Tree • Step 1: Identify the decision you are trying to make. Draw a small square to represent this decision on the left side of your tree, which will be a decision node.
Step 1: Draw the Decision Tree • Step 2: From the first decision node, draw lines (branches) towards the right for each possible option/solution and label that option/solution along the branch.
Step 1: Draw the Decision Tree • Step 3: At the end of each branch, consider the results of that option. If the result of that option is uncertain, draw an event node. If the result is another decision that has to be made, draw a decision node. Draw out appropriate branches from each node. Label each branch accordingly.
Step 1: Draw the Decision Tree • Step 4: Continue the previous step until all the possible outcomes and decisions have been drawn onto the tree.
Step 2: Evaluate the Decision Tree • Evaluating the decision tree helps show which decision has the greatest worth. • Step 1: Assign a cash value or score to each possible outcome. This is an estimate of how much it would be worth if the outcome came about.
Step 2: Evaluate the Decision Tree • Step 2: At each event node (circle) estimate the probability of each outcome, make sure the total at each node is equal to 100% or 1.
Red = Value Green = Probability
Step 2: Evaluate the Decision Tree • Step 3: Find the total payoff for each path of the tree. To do this, add up the values (red) for each path and put that total at the end of the path.
Red = Value Green = Probability Orange = Payoff
Step 3: Calculate Tree Values • Step 1: Start at the right side of the decision tree and move left one column at a time. For each column, perform step 2 or 3 depending on whether the node is a decision or event node. • Step 2: For event nodes, calculate the expected value for each branch. • Multiply the expected payoff by the probability of the branch and then sum the products. Record this value next to the node.
EV = (0. 50*17) + (0. 50*10) = 13. 5 Red = Value Green = Probability Orange = Payoff
Step 3: Calculate Tree Values • Step 3: For decision nodes, compare the expected values of its branches and choose the alternative whose branch has the largest expected value. • Place a double dash on the branch that is rejected.
Red = Value Green = Probability Orange = Payoff
Step 3: Calculate Tree Values • Step 4: Continue process until reach final (original) decision node.
Red = Value Green = Probability Orange = Payoff
Step 4: Analyze and make a final decision based on the results of the decision tree • Step 1: Determine Optimal Decision Path based on branches that haven’t been rejected. • Step 2: Determine the expected payoff/value of optimal path. • This is the expected value of the path at the first decision node.
Red = Value Green = Probability Orange = Payoff
Real World Application: Required Drug Testing for Welfare Recipients • Many states have been pushing to require mandatory drug testing in order to receive welfare. • Pro: • Make sure welfare money is not going towards drugs or illegal substances, which could result in neglect or abuse towards child • Cons: • Found to be unconstitutional and invasion of citizens’ rights • False positive or false negative on drug test could take away/give welfare to inappropriate families. • Recent Case: • Florida courts struck down existing law as unconstitutional in December
Drug Testing Background Info • According to National Institute on Drug Abuse, 9. 2% of Americans have used illicit drugs in the past month (January 2014). • False Positives and False Negatives in Drug Testing • False positives are generally produced in 5 -10% of cases • False negatives generally occur in 10 -15% of cases • Poppy seeds, cold medications, antidepressants, and other antibiotics can cause false positives for various drugs. • Most standard drug tests have a substantial false negative rate for oxycodone.
Drug Testing Decision Tree • We can use decision trees to determine whether a person is really a drug user based off the results of a drug test and whether the benefits of drug testing outweigh the costs. • We will use the following statistics: • 9. 2% of all Americans are drug users • 5% of drug tests result in a false positive • 10% of drug tests result in a false negative • We will use Bayes’ Theorem to find probabilities:
Using Bayes’ Theorem • P(D) =. 092 • the probability that the person will be a drug user • P(ND) = 1—. 092 =. 908 • the probability that the person will not be a drug user • P(T+|D) =. 90 • the probability that the test will yield a positive result [T+] if the person is a drug user [D] • P(T-|D) = 1—. 90 =. 10 • the probability that the test will yield a negative result [T-] if the person is a drug user [D] • P(T+|ND) =. 05 • the probability that the test will yield a positive result [T+] if the person is not a drug user [ND] • P(T-|ND) = 1—. 05 =. 95 • the probability that the test will yield a negative result [T-] if the person is not a drug user [ND]
Given the previous information, Bayes' theorem allows us to find two simple probabilities [ ] = [. 90 x. 092]+[. 05 x. 908] =. 1282 • P(T+) = P(T+|D) x P(D) + P(T+|ND) x P(ND) • the probability of a positive test result [T+], irrespective of whether the person is a drug user [D] or not a drug user [ND] [ ] = [. 10 x. 092]+[. 95 x. 908] =. 8718 • P(T-) = P(T-|D) x P(D) + P(T-|ND) x P(ND) • the probability of a negative test result [T-], irrespective of whether the person is a drug user [D] or not a drug user [ND]
Which then allows for the calculation of the four remaining conditional probabilities… [ • P(D|T+) = PT+|D) x P(D) ] / P(T+) = [. 90 x. 092] /. 1282 =. 6459 • the probability that the person is a drug user [D] if the test result is positive [T+] (i. e. , the probability that a positive test result will be a true positive) [ • P(ND|T+) = P(T+|ND) x P(ND) ] / P(T+) = [. 05 x. 908] /. 1282 =. 3541 • the probability that the person is not a drug user [ND] if the test result is positive [T+] (i. e. , the probability that a positive test result will be a false positive) [ • P(ND|T-) = P(T-|ND) x P(ND) ] / P(T-) = [. 95 x. 908] /. 8718 =. 9894 • the probability that the person is not a drug user [ND] if the test result is negative [T- ] (i. e. , the probability that a negative test result will be a true negative) [ • P(D|T-) = P(T-|D) x P(D) ] / P(T-) = [. 10 x. 092] /. 8718 =. 0106 • the probability that the person is a drug user [D] if the test result is negative [T-] (i. e. , the probability that a negative test result will be a false negative)
* Benefit of identifying drug user = 25 * Cost of Drug test = -1 * Cost of Falsely Accusing = -50 * Cost of Not Identifying drug user = -20 0. 092 -1. 84 0. 908 Based on decision tree, would be better to drug test welfare candidates.
Conclusion • Decision trees can be a beneficial tool in organizing information needed to make the most informed and statistically sound decision. • Great way to visually see what different options or outcomes various decisions can have. • There are many real world applications for decision trees, like drug testing.
Sources Albright, S. C. , & Winston, W. L. (2011). Decision Making Under Uncertainty. Data analysis and decision making (4 th ed. , ). Mason, Ohio: South-Western/Cengage Learning. Decision Tree Primer. (2013, January 1). Decision Tree Primer. Retrieved April 29, 2014, from http: //www. public. asu. edu/~kirkwood/DAStuff/decisiontrees/index. html Hillier, F. S. , & Lieberman, G. J. (2005). Decision Analysis. Introduction to operations research (). San Francisco: Holden-Day. Laino, C. (2010, June 1). Drug Tests Not Immune from False Positives. CBSNews. Retrieved April 29, 2014, from http: //www. cbsnews. com/news/drug-tests-not-immune-fromfalse-positives/ Robles, F. (2013, December 31). Florida Law on Drug Tests for Welfare Is Struck Down. The New York Times. Retrieved April 29, 2014, from http: //www. nytimes. com/2014/01/01/us/florida-law-on-drug-testing-for-welfare-isstruck-down. html? _r=1 Rogers, T. (2001, January 1). Bad Test Results. Retrieved April 29, 2014, from http: //www. intuitor. com/statistics/Bad. Test. Results. html