
Decision Analysis and Test Planning for MultiOperational Wireless




- Slides: 43
Decision Analysis and Test Planning for Multi-Operational Wireless Ranging and Low-Power LIDAR Exploitation of Subterranean Structures Rian Kistner, Kathleen Mc. Lane, Joseph Navarro May 11, 2018
Agenda 1. Introduction & Background 2. Objectives & Scope 3. Technical Approach 4. Decision Analysis 5. Test Plan 6. Recommendations 7. Acknowledgements 2
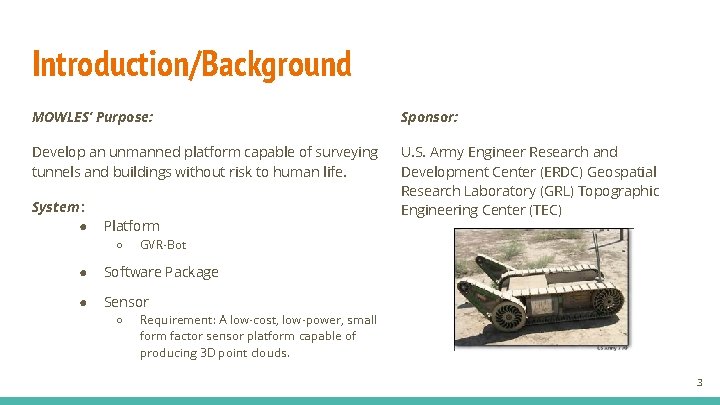
Introduction/Background MOWLES’ Purpose: Sponsor: Develop an unmanned platform capable of surveying tunnels and buildings without risk to human life. U. S. Army Engineer Research and Development Center (ERDC) Geospatial Research Laboratory (GRL) Topographic Engineering Center (TEC) System : ● Platform ○ GVR-Bot ● Software Package ● Sensor ○ Requirement: A low-cost, low-power, small form factor sensor platform capable of producing 3 D point clouds. 3
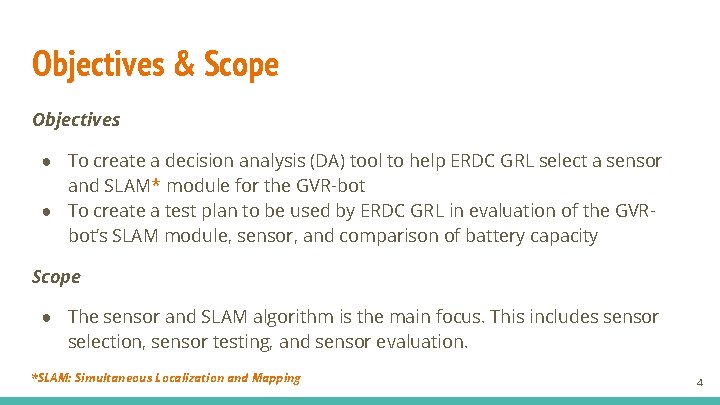
Objectives & Scope Objectives ● To create a decision analysis (DA) tool to help ERDC GRL select a sensor and SLAM* module for the GVR-bot ● To create a test plan to be used by ERDC GRL in evaluation of the GVRbot’s SLAM module, sensor, and comparison of battery capacity Scope ● The sensor and SLAM algorithm is the main focus. This includes sensor selection, sensor testing, and sensor evaluation. *SLAM: Simultaneous Localization and Mapping 4
Section 1: Decision Analysis Tool 5
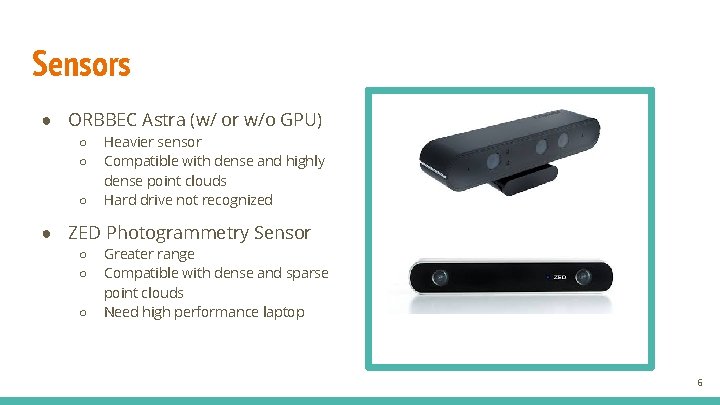
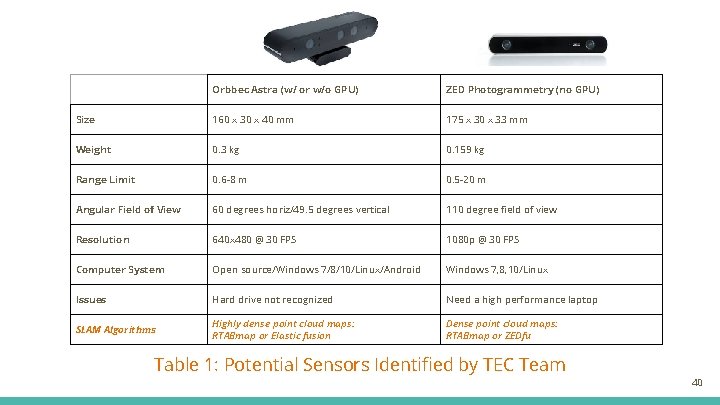
Sensors ● ORBBEC Astra (w/ or w/o GPU) ○ ○ ○ Heavier sensor Compatible with dense and highly dense point clouds Hard drive not recognized ● ZED Photogrammetry Sensor ○ ○ ○ Greater range Compatible with dense and sparse point clouds Need high performance laptop 6
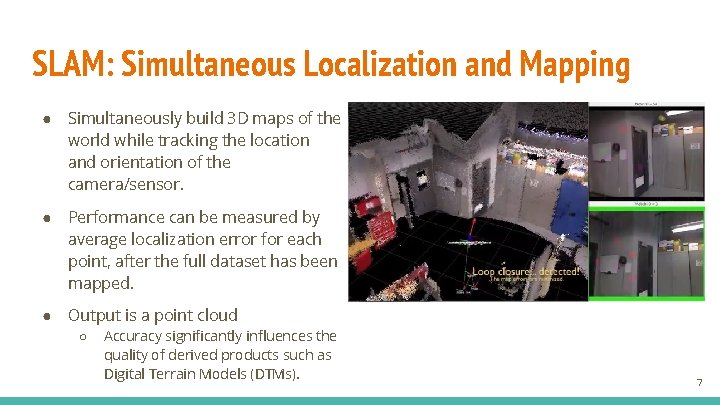
SLAM: Simultaneous Localization and Mapping ● Simultaneously build 3 D maps of the world while tracking the location and orientation of the camera/sensor. ● Performance can be measured by average localization error for each point, after the full dataset has been mapped. ● Output is a point cloud ○ Accuracy significantly influences the quality of derived products such as Digital Terrain Models (DTMs). 7
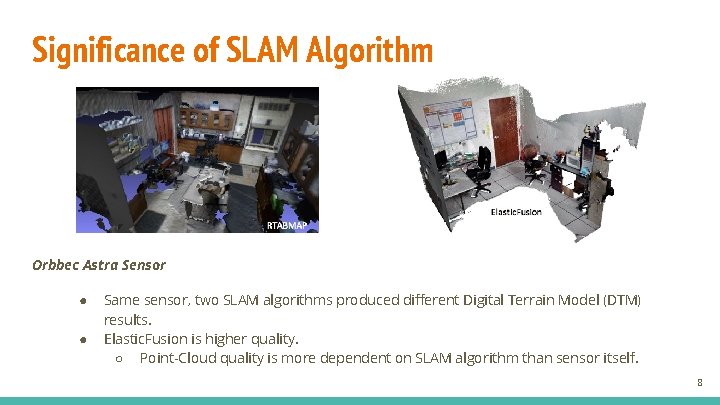
Significance of SLAM Algorithm Orbbec Astra Sensor ● ● Same sensor, two SLAM algorithms produced different Digital Terrain Model (DTM) results. Elastic. Fusion is higher quality. ○ Point-Cloud quality is more dependent on SLAM algorithm than sensor itself. 8
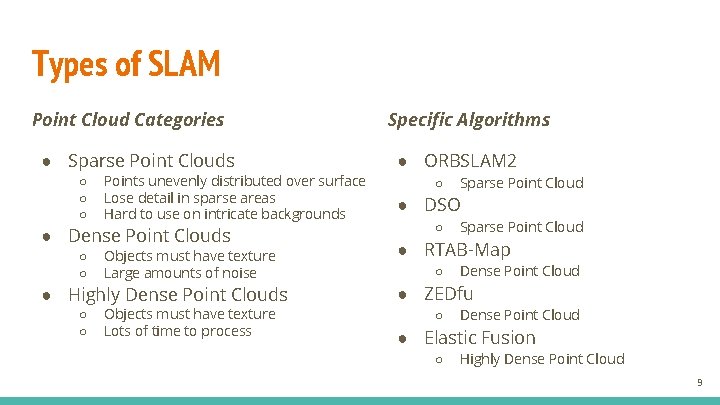
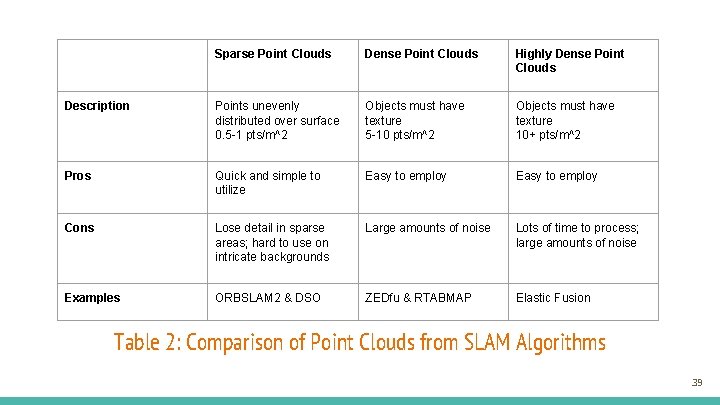
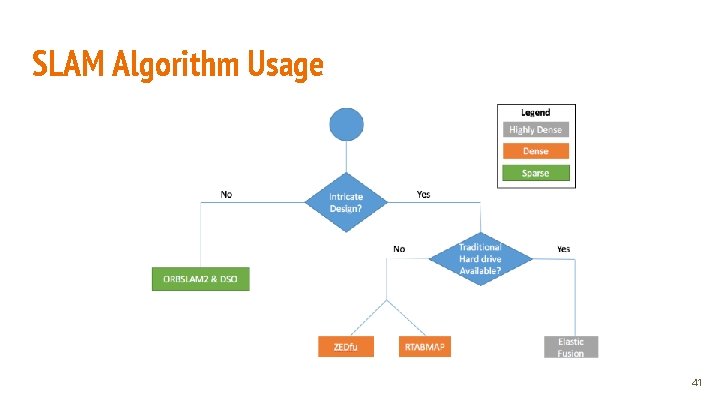
Types of SLAM Point Cloud Categories ● Sparse Point Clouds ○ ○ ○ Points unevenly distributed over surface Lose detail in sparse areas Hard to use on intricate backgrounds ● Dense Point Clouds ○ ○ Objects must have texture Large amounts of noise ● Highly Dense Point Clouds ○ ○ Objects must have texture Lots of time to process Specific Algorithms ● ORBSLAM 2 ○ Sparse Point Cloud ● DSO ○ Sparse Point Cloud ● RTAB-Map ○ Dense Point Cloud ● ZEDfu ○ Dense Point Cloud ● Elastic Fusion ○ Highly Dense Point Cloud 9
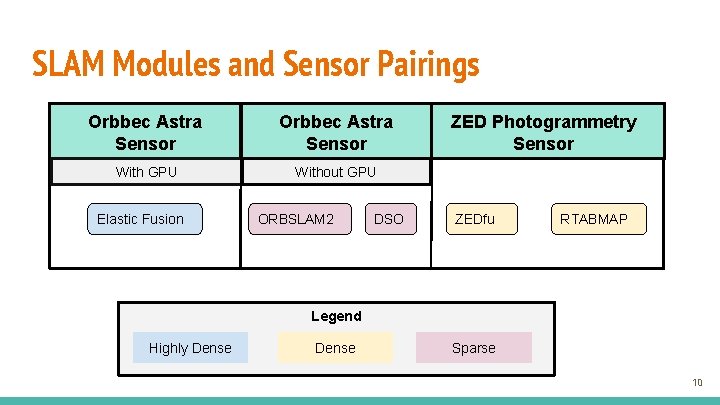
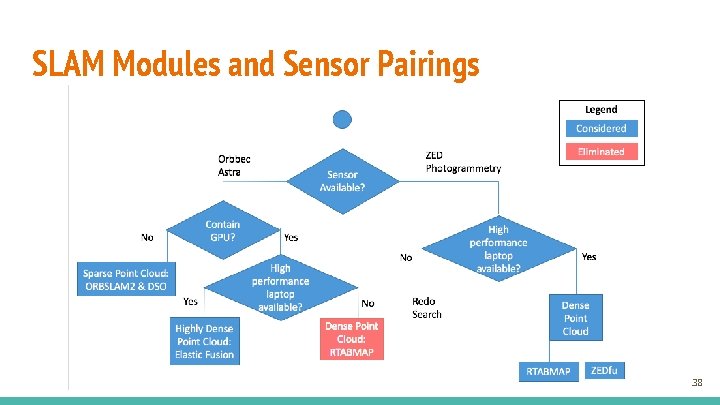
SLAM Modules and Sensor Pairings Orbbec Astra Sensor With GPU Without GPU Elastic Fusion ORBSLAM 2 DSO ZED Photogrammetry Sensor ZEDfu RTABMAP Legend Highly Dense Sparse 10
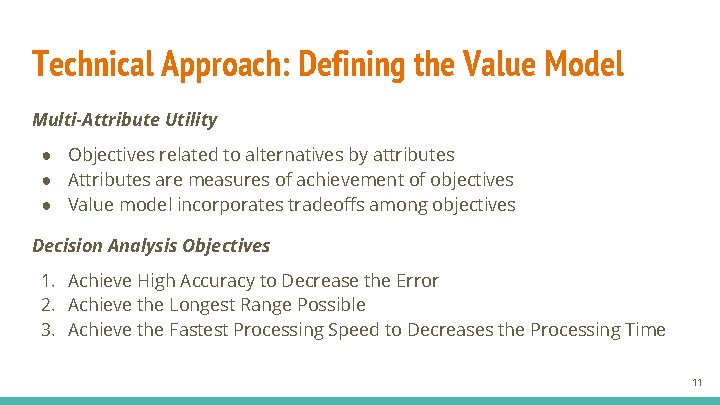
Technical Approach: Defining the Value Model Multi-Attribute Utility ● Objectives related to alternatives by attributes ● Attributes are measures of achievement of objectives ● Value model incorporates tradeoffs among objectives Decision Analysis Objectives 1. Achieve High Accuracy to Decrease the Error 2. Achieve the Longest Range Possible 3. Achieve the Fastest Processing Speed to Decreases the Processing Time 11
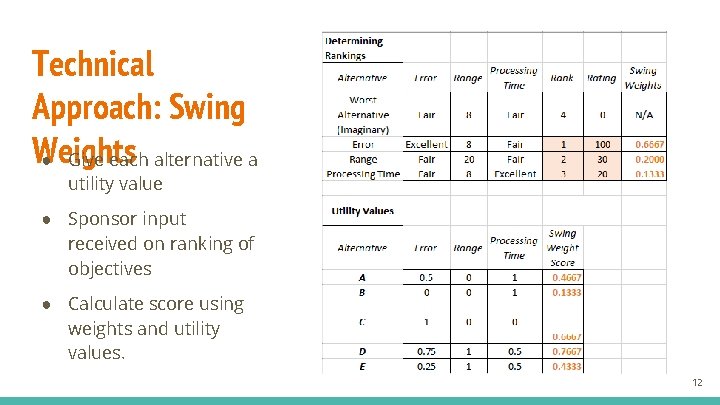
Technical Approach: Swing Weights ● Give each alternative a utility value ● Sponsor input received on ranking of objectives ● Calculate score using weights and utility values. 12
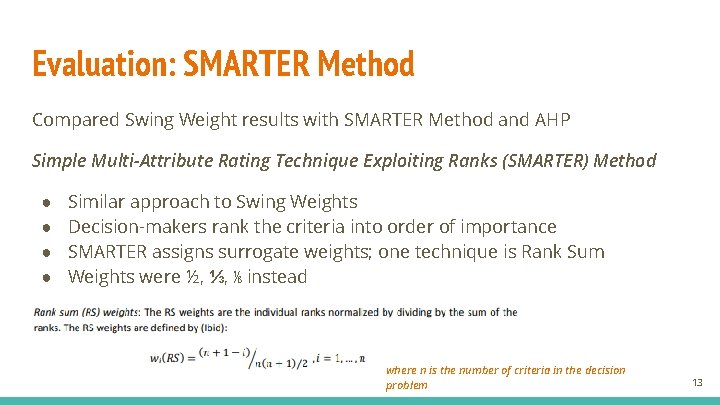
Evaluation: SMARTER Method Compared Swing Weight results with SMARTER Method and AHP Simple Multi-Attribute Rating Technique Exploiting Ranks (SMARTER) Method ● ● Similar approach to Swing Weights Decision-makers rank the criteria into order of importance SMARTER assigns surrogate weights; one technique is Rank Sum Weights were ½, ⅓, ⅙ instead where n is the number of criteria in the decision problem 13
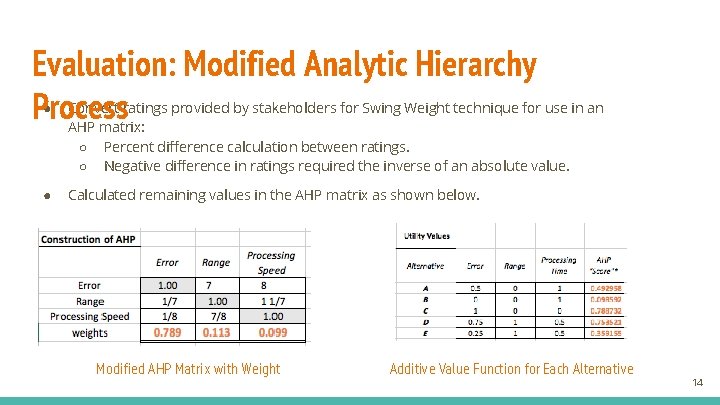
Evaluation: Modified Analytic Hierarchy Process ● Convert ratings provided by stakeholders for Swing Weight technique for use in an AHP matrix: ○ Percent difference calculation between ratings. ○ Negative difference in ratings required the inverse of an absolute value. ● Calculated remaining values in the AHP matrix as shown below. Modified AHP Matrix with Weight Additive Value Function for Each Alternative 14
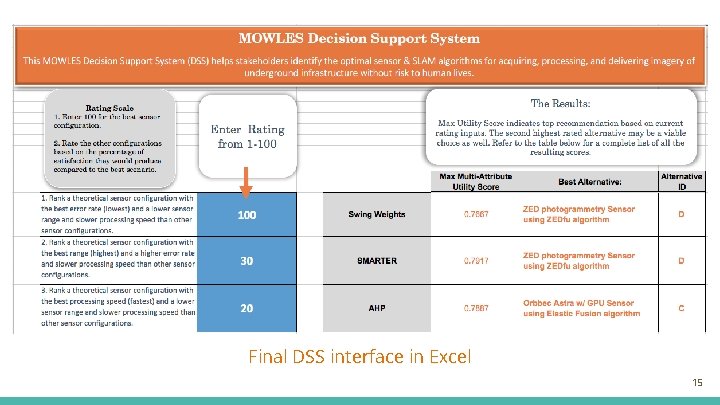
Final DSS interface in Excel 15
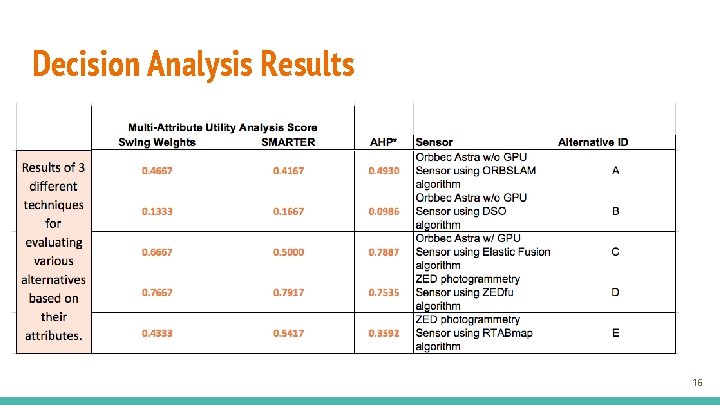
Decision Analysis Results 16
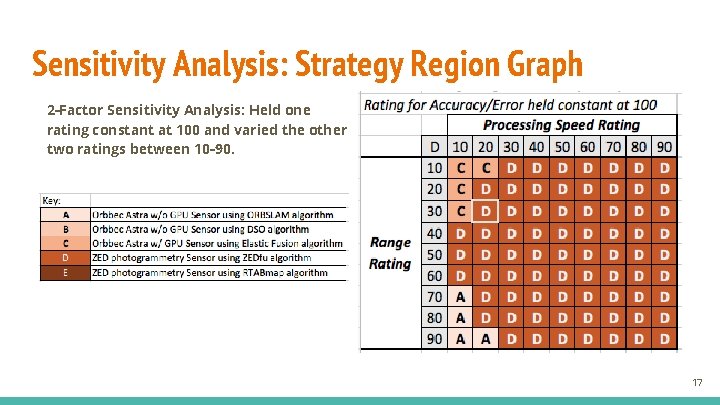
Sensitivity Analysis: Strategy Region Graph 2 -Factor Sensitivity Analysis: Held one rating constant at 100 and varied the other two ratings between 10 -90. 17
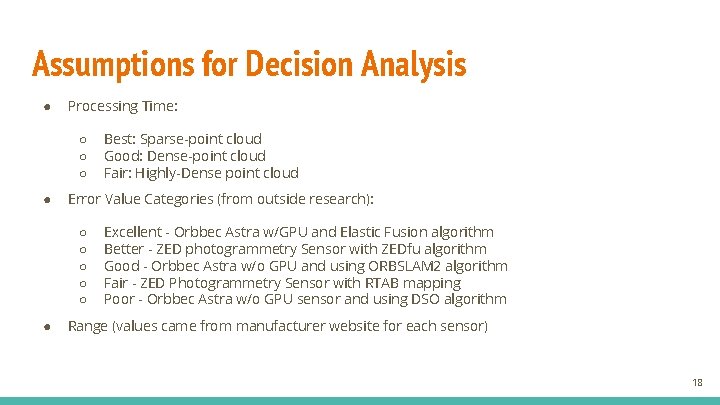
Assumptions for Decision Analysis ● Processing Time: ○ ○ ○ ● Error Value Categories (from outside research): ○ ○ ○ ● Best: Sparse-point cloud Good: Dense-point cloud Fair: Highly-Dense point cloud Excellent - Orbbec Astra w/GPU and Elastic Fusion algorithm Better - ZED photogrammetry Sensor with ZEDfu algorithm Good - Orbbec Astra w/o GPU and using ORBSLAM 2 algorithm Fair - ZED Photogrammetry Sensor with RTAB mapping Poor - Orbbec Astra w/o GPU sensor and using DSO algorithm Range (values came from manufacturer website for each sensor) 18
Section 2: Test Plan 19
Test Plan Agenda ● Purpose: In-house data collection for continued evaluation of GVR-Bot configurations ○ Testing conducted at CERDEC’s Night Vision Lab on Fort Belvoir, VA. ● Timeline: Still in early stages - 6 rounds of testing planned across 5 year research project. (Next one planned for Q 4 FY 2018) ● Deliverable: Determine metrics and methodologies to evaluate the Bots across 3 key objectives: ○ Sensor/Slam module accuracy ○ Effects of light level on visual odometry ○ Battery life/consumption 20
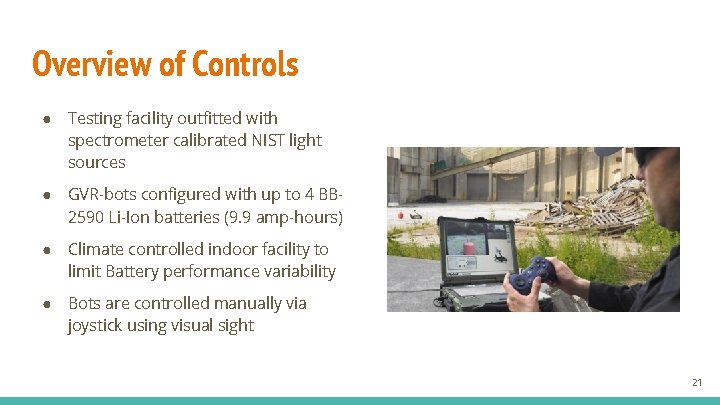
Overview of Controls ● Testing facility outfitted with spectrometer calibrated NIST light sources ● GVR-bots configured with up to 4 BB 2590 Li-Ion batteries (9. 9 amp-hours) ● Climate controlled indoor facility to limit Battery performance variability ● Bots are controlled manually via joystick using visual sight 21
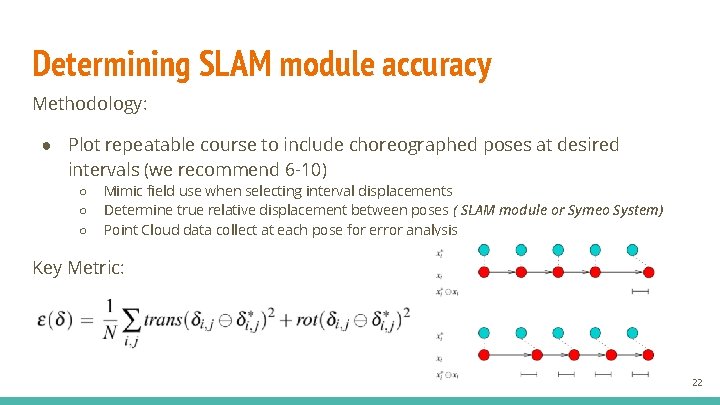
Determining SLAM module accuracy Methodology: ● Plot repeatable course to include choreographed poses at desired intervals (we recommend 6 -10) ○ ○ ○ Mimic field use when selecting interval displacements Determine true relative displacement between poses ( SLAM module or Symeo System) Point Cloud data collect at each pose for error analysis Key Metric: 22
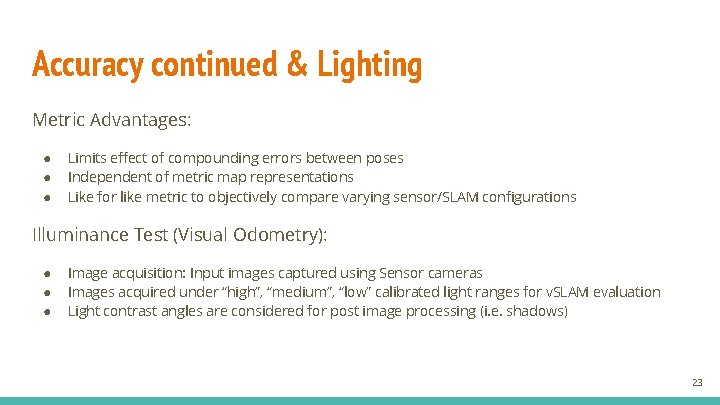
Accuracy continued & Lighting Metric Advantages: ● ● ● Limits effect of compounding errors between poses Independent of metric map representations Like for like metric to objectively compare varying sensor/SLAM configurations Illuminance Test (Visual Odometry): ● ● ● Image acquisition: Input images captured using Sensor cameras Images acquired under “high”, “medium”, “low” calibrated light ranges for v. SLAM evaluation Light contrast angles are considered for post image processing (i. e. shadows) 23
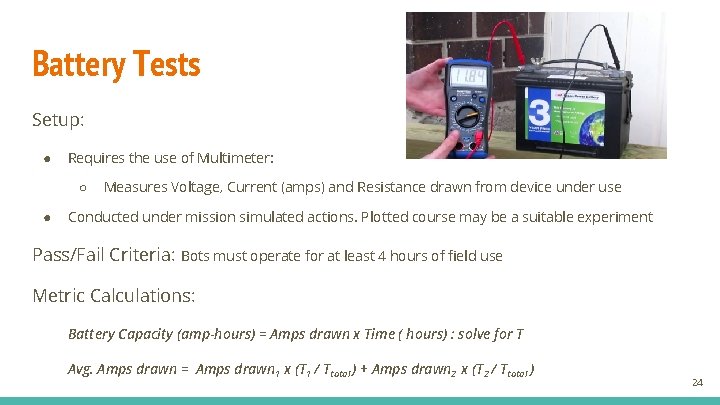
Battery Tests Setup: ● Requires the use of Multimeter: ○ ● Measures Voltage, Current (amps) and Resistance drawn from device under use Conducted under mission simulated actions. Plotted course may be a suitable experiment Pass/Fail Criteria: Bots must operate for at least 4 hours of field use Metric Calculations: Battery Capacity (amp-hours) = Amps drawn x Time ( hours) : solve for T Avg. Amps drawn = Amps drawn 1 x (T 1 / Ttotal ) + Amps drawn 2 x (T 2 / Ttotal ) 24
Section 3: Final Deliverables and Remarks 25
Deliverables Decision Analysis ● Established Value Model & objectives to maximize/minimize ● Different Techniques ○ ○ ○ ● Swing weights SMARTER AHP weights Sensitivity Analysis ○ Varied inputs to decision analysis and analyzed results Test Plan Development ● Objectives of next test (4 Q FY 18) determined ○ ○ ○ Accuracy Analysis Light-threshold detection GPU effect on GVR-bot’s battery capacity ● Draft Test Plan prepared ○ Key Metrics and Methodologies identified & vetted 26
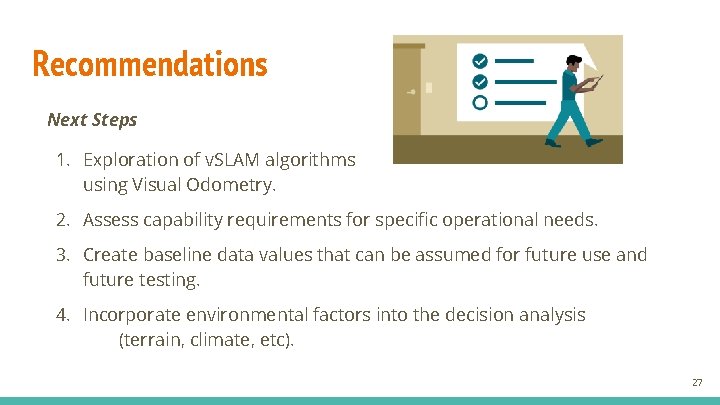
Recommendations Next Steps 1. Exploration of v. SLAM algorithms using Visual Odometry. 2. Assess capability requirements for specific operational needs. 3. Create baseline data values that can be assumed for future use and future testing. 4. Incorporate environmental factors into the decision analysis (terrain, climate, etc). 27
Acknowledgements ERDC GRL TEC Team ● Vineet Gupta ● Garry Glaspell GMU Faculty Mentor ● Dr. Kathryn Laskey 28
Questions 29
Backup Slides 30
Roles & Responsibilities ● Rian Kistner – Team Lead and Systems Engineer ○ ○ Organized team to meet milestones. Ensured scope and direction of the project aligned with the customer’s expectations. Validated deliverables against customer requirements. Developed DSS interface, analyzed the DSS results, and performed sensitivity analysis. ● Kathleen Mc. Lane – System Architect and System Engineer ○ ○ ○ Constructed the system architecture models Performed the decision analysis models Schedule, EVM charts, and Work Breakdown Structure. ● Joseph Navarro – Data Analyst and Test Plan Developer ○ ○ ○ Developed standardized testing methodologies and metrics for evaluating configurations. Identified key components of laboratory conditions and GVR-bot specs used to outline procedures for test plan objectives. Key liaison to sponsor while gathering important MOWLES information. 31
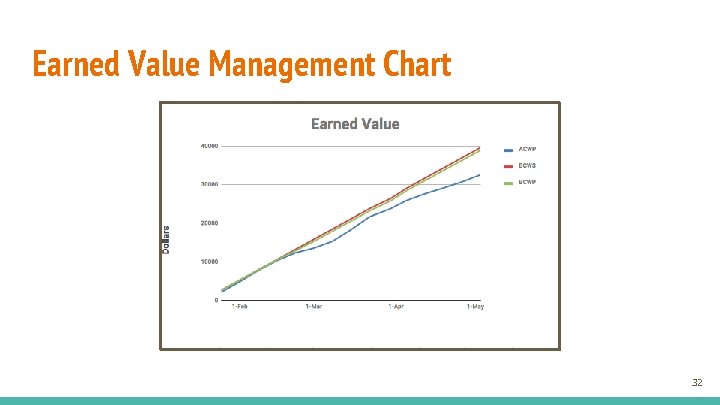
Earned Value Management Chart 32
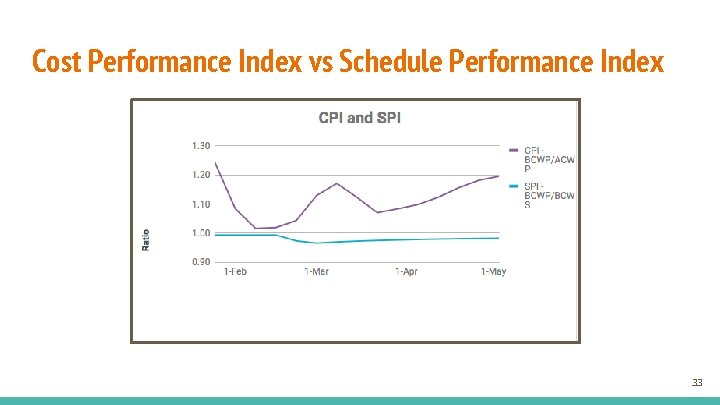
Cost Performance Index vs Schedule Performance Index 33
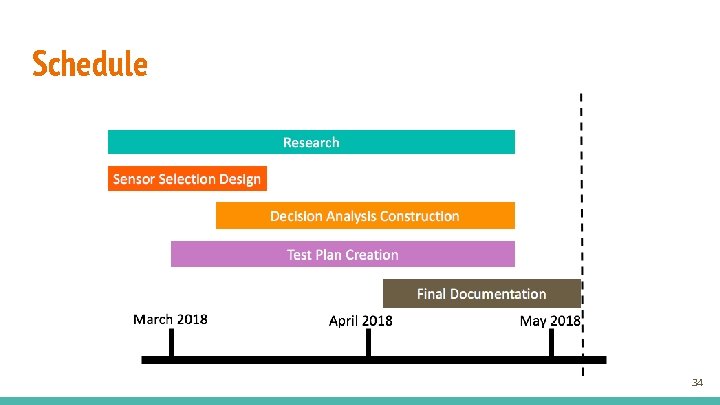
Schedule 34
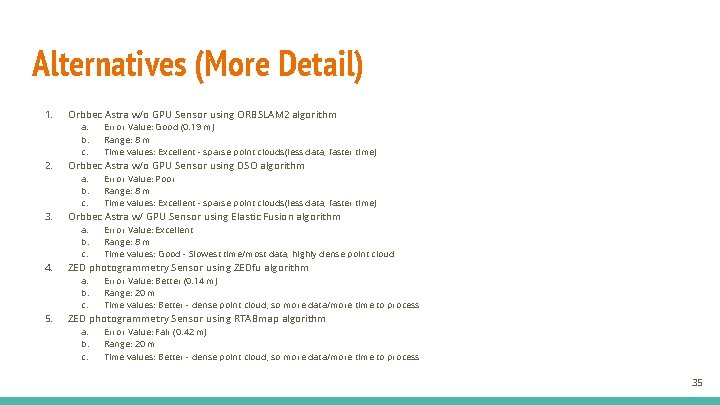
Alternatives (More Detail) 1. Orbbec Astra w/o GPU Sensor using ORBSLAM 2 algorithm a. b. c. 2. Orbbec Astra w/o GPU Sensor using DSO algorithm a. b. c. 3. Error Value: Excellent Range: 8 m Time values: Good - Slowest time/most data, highly dense point cloud ZED photogrammetry Sensor using ZEDfu algorithm a. b. c. 5. Error Value: Poor Range: 8 m Time values: Excellent - sparse point clouds(less data, faster time) Orbbec Astra w/ GPU Sensor using Elastic Fusion algorithm a. b. c. 4. Error Value: Good (0. 19 m) Range: 8 m Time values: Excellent - sparse point clouds(less data, faster time) Error Value: Better (0. 14 m) Range: 20 m Time values: Better - dense point cloud, so more data/more time to process ZED photogrammetry Sensor using RTABmap algorithm a. b. c. Error Value: Fair (0. 42 m) Range: 20 m Time values: Better - dense point cloud, so more data/more time to process 35
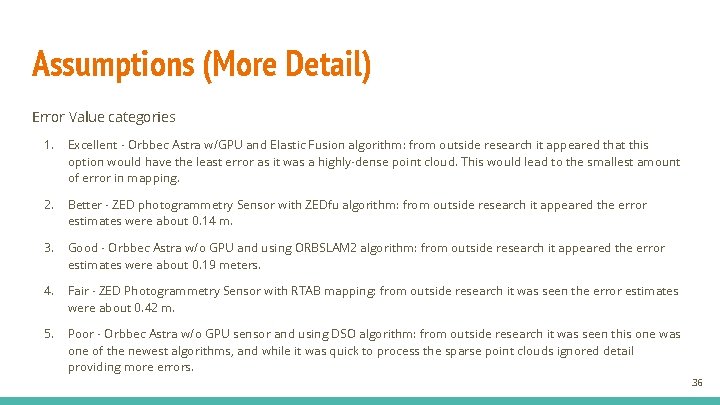
Assumptions (More Detail) Error Value categories 1. Excellent - Orbbec Astra w/GPU and Elastic Fusion algorithm: from outside research it appeared that this option would have the least error as it was a highly-dense point cloud. This would lead to the smallest amount of error in mapping. 2. Better - ZED photogrammetry Sensor with ZEDfu algorithm: from outside research it appeared the error estimates were about 0. 14 m. 3. Good - Orbbec Astra w/o GPU and using ORBSLAM 2 algorithm: from outside research it appeared the error estimates were about 0. 19 meters. 4. Fair - ZED Photogrammetry Sensor with RTAB mapping: from outside research it was seen the error estimates were about 0. 42 m. 5. Poor - Orbbec Astra w/o GPU sensor and using DSO algorithm: from outside research it was seen this one was one of the newest algorithms, and while it was quick to process the sparse point clouds ignored detail providing more errors. 36
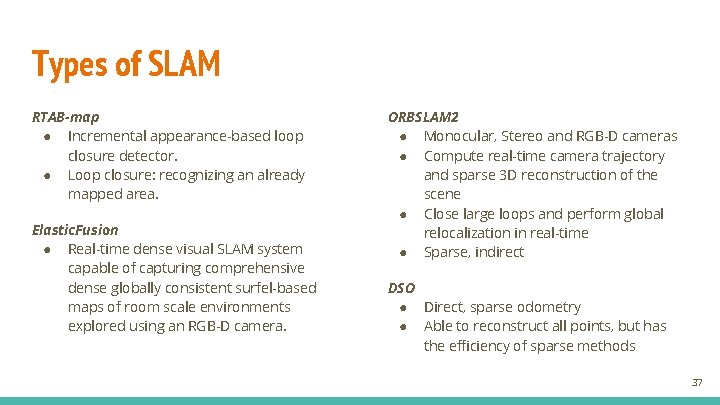
Types of SLAM RTAB-map ● Incremental appearance-based loop closure detector. ● Loop closure: recognizing an already mapped area. Elastic. Fusion ● Real-time dense visual SLAM system capable of capturing comprehensive dense globally consistent surfel-based maps of room scale environments explored using an RGB-D camera. ORBSLAM 2 ● Monocular, Stereo and RGB-D cameras ● Compute real-time camera trajectory and sparse 3 D reconstruction of the scene ● Close large loops and perform global relocalization in real-time ● Sparse, indirect DSO ● Direct, sparse odometry ● Able to reconstruct all points, but has the efficiency of sparse methods 37
SLAM Modules and Sensor Pairings 38
Sparse Point Clouds Dense Point Clouds Highly Dense Point Clouds Description Points unevenly distributed over surface 0. 5 -1 pts/m^2 Objects must have texture 5 -10 pts/m^2 Objects must have texture 10+ pts/m^2 Pros Quick and simple to utilize Easy to employ Cons Lose detail in sparse areas; hard to use on intricate backgrounds Large amounts of noise Lots of time to process; large amounts of noise Examples ORBSLAM 2 & DSO ZEDfu & RTABMAP Elastic Fusion Table 2: Comparison of Point Clouds from SLAM Algorithms 39
Orbbec Astra (w/ or w/o GPU) ZED Photogrammetry (no GPU) Size 160 x 30 x 40 mm 175 x 30 x 33 mm Weight 0. 3 kg 0. 159 kg Range Limit 0. 6 -8 m 0. 5 -20 m Angular Field of View 60 degrees horiz/49. 5 degrees vertical 110 degree field of view Resolution 640 x 480 @ 30 FPS 1080 p @ 30 FPS Computer System Open source/Windows 7/8/10/Linux/Android Windows 7, 8, 10/Linux Issues Hard drive not recognized Need a high performance laptop SLAM Algorithms Highly dense point cloud maps: RTABmap or Elastic fusion Dense point cloud maps: RTABmap or ZEDfu Table 1: Potential Sensors Identified by TEC Team 40
SLAM Algorithm Usage 41
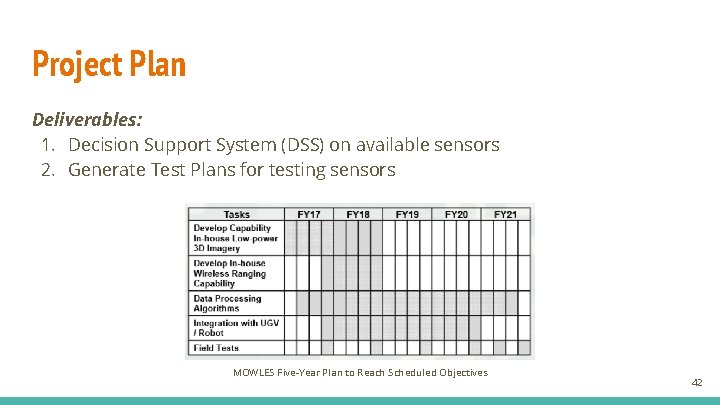
Project Plan Deliverables: 1. Decision Support System (DSS) on available sensors 2. Generate Test Plans for testing sensors MOWLES Five-Year Plan to Reach Scheduled Objectives 42
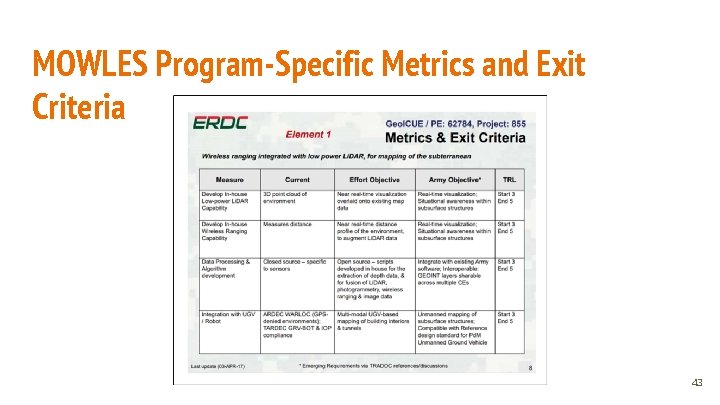
MOWLES Program-Specific Metrics and Exit Criteria 43