
December 1 st and 2 nd 2015 WIOA
December 1 st and 2 nd , 2015 WIOA Performance Accountability Statistical Adjustment Model Methodology Presented by: U. S. Department of Labor § Employment and Training Administration UNITED STATES DEPARTMENT OF LABOR U. S. Department of Education § Office of Career, Technical and Adult Education § Rehabilitation Services Administration UNITED STATES DEPARTMENT OF EDUCATION 6/11/2021 1 1 UNITED STATES DEPARTMENT OF LABOR UNITED STATES DEPARTMENT OF EDUCATION
Today’s Moderator Director Division of Strategic Planning and Performance Office of Policy Development and Research Employment and Training Administration U. S. Department of Labor 6/11/2021 2 UNITED STATES DEPARTMENT OF LABOR UNITED STATES DEPARTMENT OF EDUCATION
Today’s Presenters Mathematical Statistician Managing Director U. S. Department of Labor Chief Evaluation Office American Institutes for Research Workforce and Lifelong Learning Program Statistician Senior Researcher U. S. Department of Education American Institutes for Research Workforce and Lifelong Learning Program Rehabilitation Services Administration 6/11/2021 3 UNITED STATES DEPARTMENT OF LABOR UNITED STATES DEPARTMENT OF EDUCATION
PART I Mathematical Statistician U. S. Department of Labor Chief Evaluation Office 6/11/2021 4 UNITED STATES DEPARTMENT OF LABOR UNITED STATES DEPARTMENT OF EDUCATION

WIOA Methodology Design Approach Review prior work Examine pro’s and con’s – completed Gather and assess available data Individual vs aggregate approaches Back compute the new WIOA measures (to the extent possible) Estimate the models Variable selection Cross validate Produce results 6/11/2021 5 UNITED STATES DEPARTMENT OF LABOR UNITED STATES DEPARTMENT OF EDUCATION
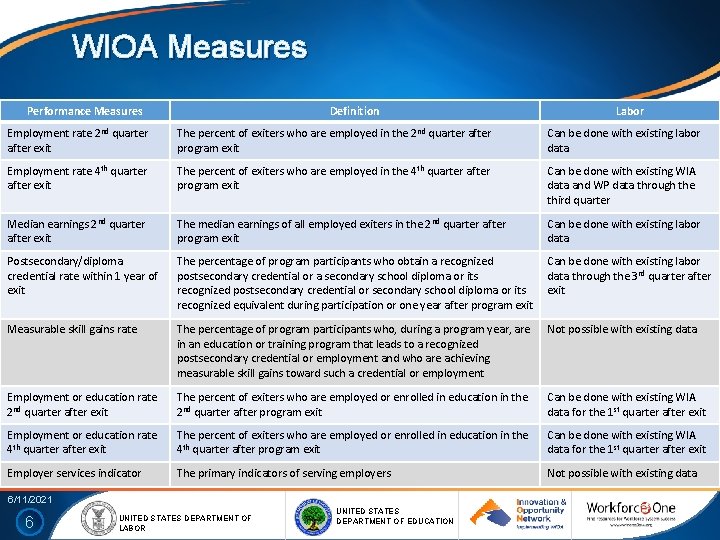
WIOA Measures Performance Measures Definition Labor Employment rate 2 nd quarter after exit The percent of exiters who are employed in the 2 nd quarter after program exit Can be done with existing labor data Employment rate 4 th quarter after exit The percent of exiters who are employed in the 4 th quarter after program exit Can be done with existing WIA data and WP data through the third quarter Median earnings 2 nd quarter after exit The median earnings of all employed exiters in the 2 nd quarter after program exit Can be done with existing labor data Postsecondary/diploma credential rate within 1 year of exit The percentage of program participants who obtain a recognized postsecondary credential or a secondary school diploma or its recognized postsecondary credential or secondary school diploma or its recognized equivalent during participation or one year after program exit Can be done with existing labor data through the 3 rd quarter after exit Measurable skill gains rate The percentage of program participants who, during a program year, are in an education or training program that leads to a recognized postsecondary credential or employment and who are achieving measurable skill gains toward such a credential or employment Not possible with existing data Employment or education rate 2 nd quarter after exit The percent of exiters who are employed or enrolled in education in the 2 nd quarter after program exit Can be done with existing WIA data for the 1 st quarter after exit Employment or education rate 4 th quarter after exit The percent of exiters who are employed or enrolled in education in the 4 th quarter after program exit Can be done with existing WIA data for the 1 st quarter after exit Employer services indicator The primary indicators of serving employers Not possible with existing data 6/11/2021 6 UNITED STATES DEPARTMENT OF LABOR UNITED STATES DEPARTMENT OF EDUCATION
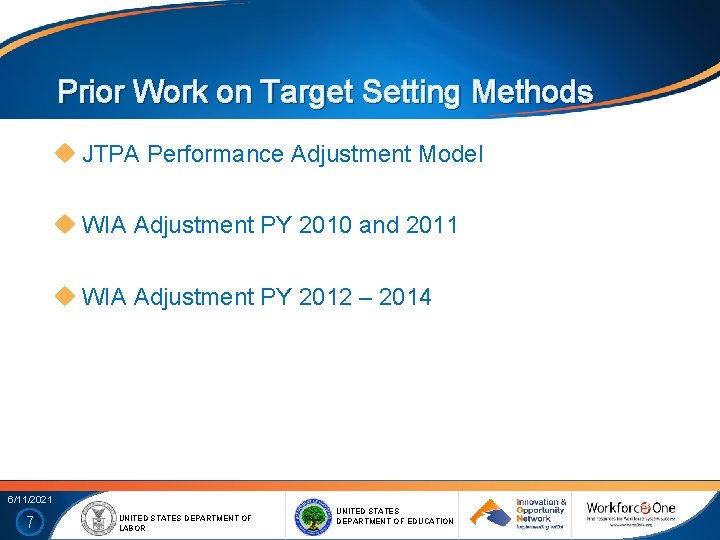
Prior Work on Target Setting Methods JTPA Performance Adjustment Model WIA Adjustment PY 2010 and 2011 WIA Adjustment PY 2012 – 2014 6/11/2021 7 UNITED STATES DEPARTMENT OF LABOR UNITED STATES DEPARTMENT OF EDUCATION
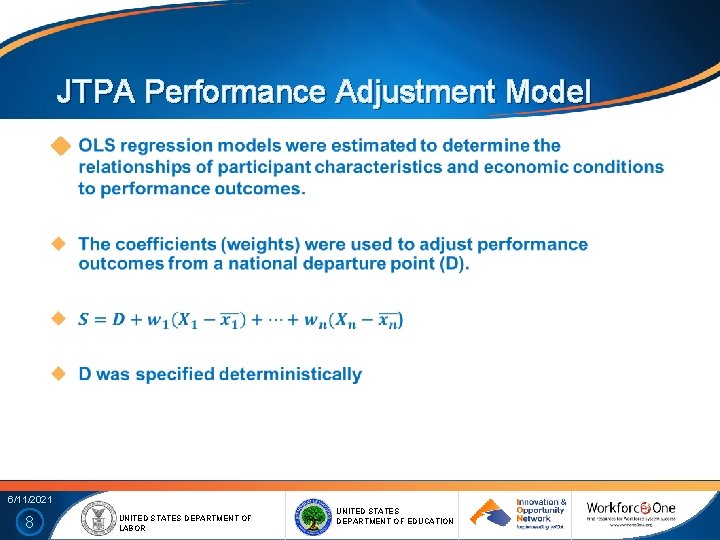
JTPA Performance Adjustment Model 6/11/2021 8 UNITED STATES DEPARTMENT OF LABOR UNITED STATES DEPARTMENT OF EDUCATION
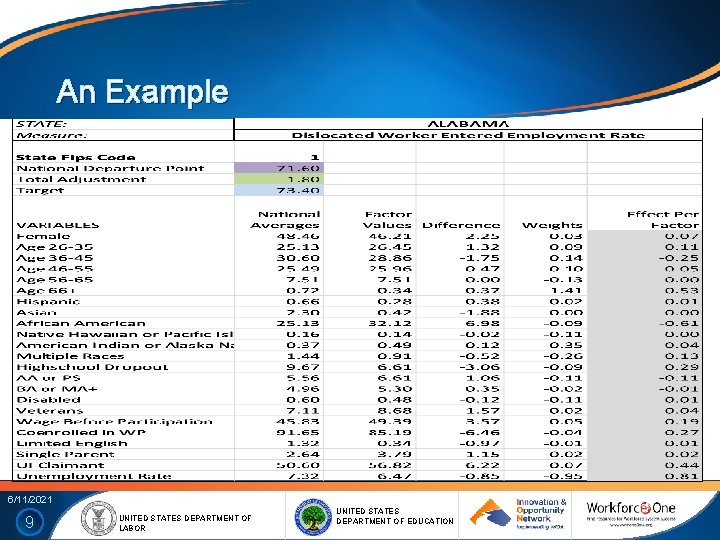
An Example 6/11/2021 9 UNITED STATES DEPARTMENT OF LABOR UNITED STATES DEPARTMENT OF EDUCATION
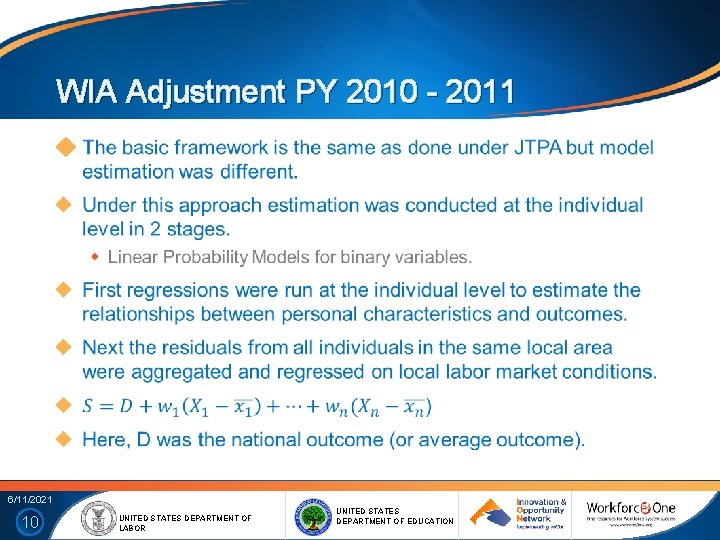
WIA Adjustment PY 2010 - 2011 6/11/2021 10 UNITED STATES DEPARTMENT OF LABOR UNITED STATES DEPARTMENT OF EDUCATION
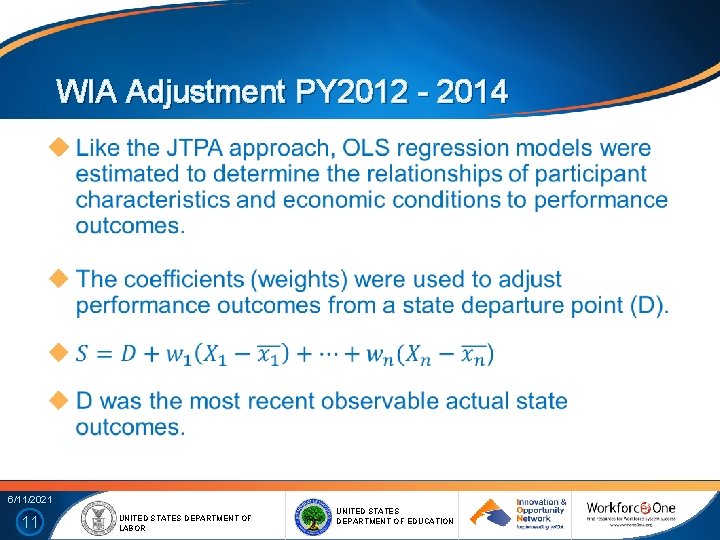
WIA Adjustment PY 2012 - 2014 6/11/2021 11 UNITED STATES DEPARTMENT OF LABOR UNITED STATES DEPARTMENT OF EDUCATION
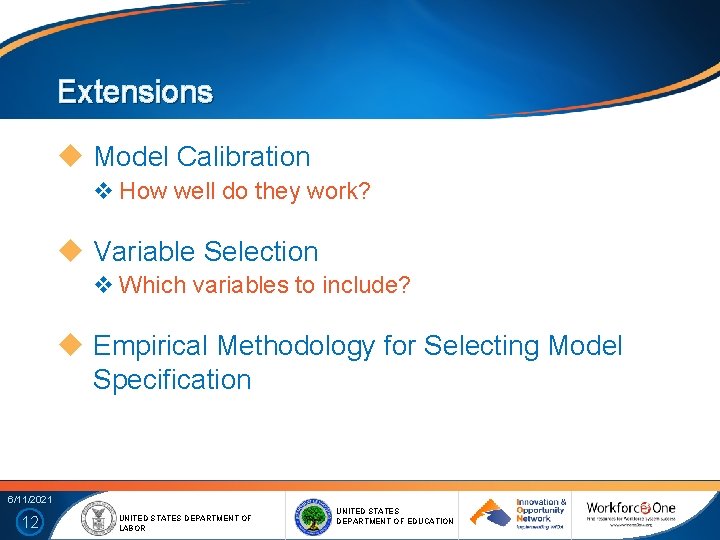
Extensions Model Calibration v How well do they work? Variable Selection v Which variables to include? Empirical Methodology for Selecting Model Specification 6/11/2021 12 UNITED STATES DEPARTMENT OF LABOR UNITED STATES DEPARTMENT OF EDUCATION
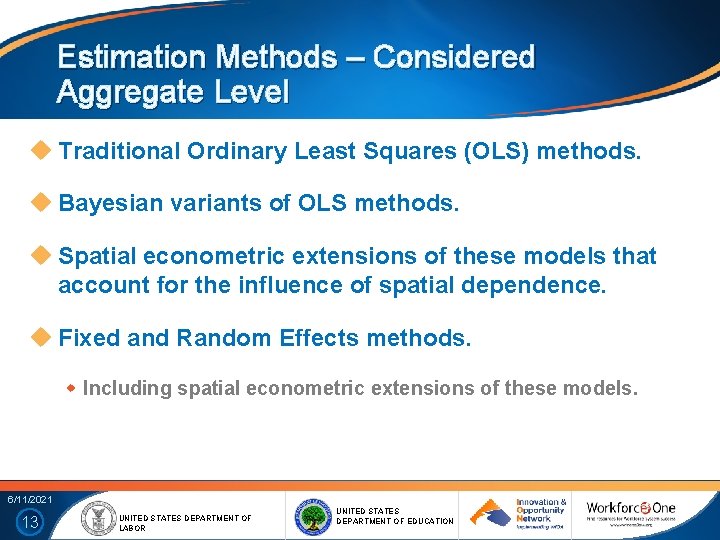
Estimation Methods – Considered Aggregate Level Traditional Ordinary Least Squares (OLS) methods. Bayesian variants of OLS methods. Spatial econometric extensions of these models that account for the influence of spatial dependence. Fixed and Random Effects methods. Including spatial econometric extensions of these models. 6/11/2021 13 UNITED STATES DEPARTMENT OF LABOR UNITED STATES DEPARTMENT OF EDUCATION
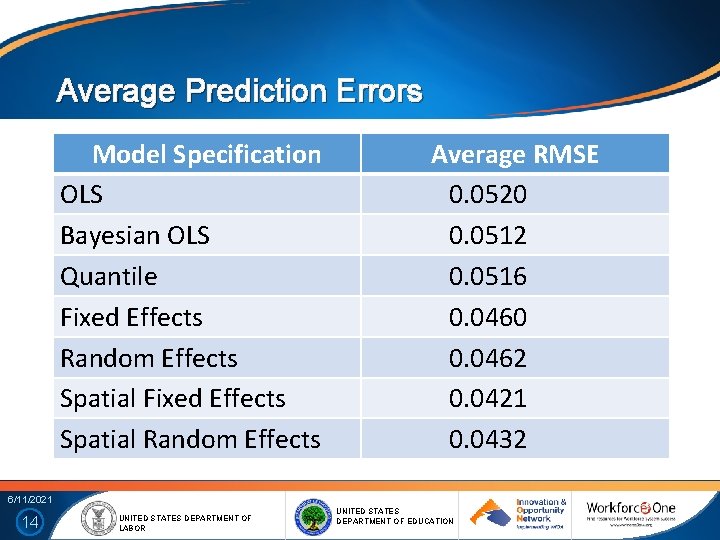
Average Prediction Errors Model Specification OLS Bayesian OLS Quantile Fixed Effects Random Effects Spatial Fixed Effects Spatial Random Effects Average RMSE 0. 0520 0. 0512 0. 0516 0. 0460 0. 0462 0. 0421 0. 0432 6/11/2021 14 UNITED STATES DEPARTMENT OF LABOR UNITED STATES DEPARTMENT OF EDUCATION
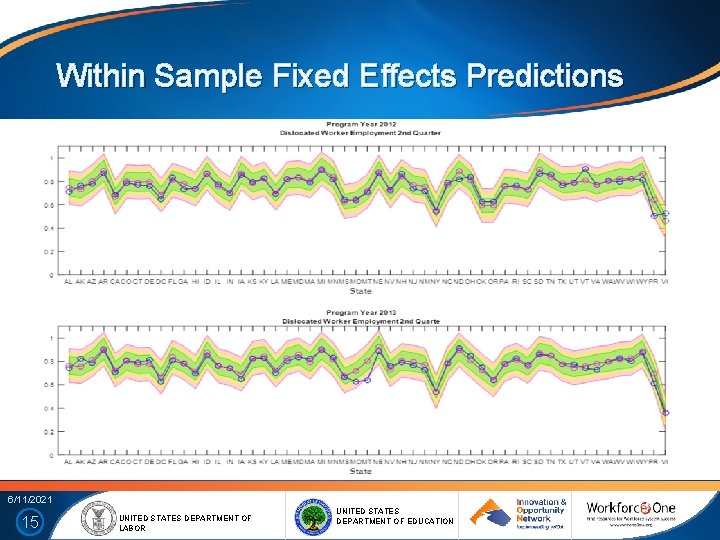
Within Sample Fixed Effects Predictions 6/11/2021 15 UNITED STATES DEPARTMENT OF LABOR UNITED STATES DEPARTMENT OF EDUCATION
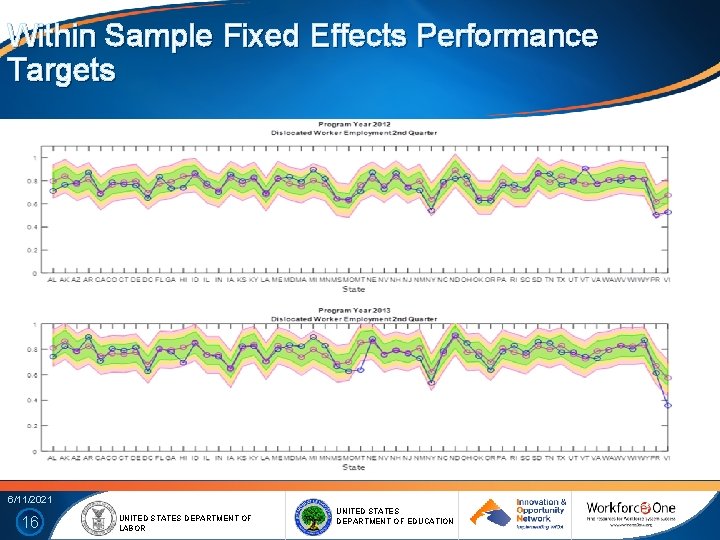
Within Sample Fixed Effects Performance Targets 6/11/2021 16 UNITED STATES DEPARTMENT OF LABOR UNITED STATES DEPARTMENT OF EDUCATION
PART II Statistician U. S. Department of Education Rehabilitation Services Administration 6/11/2021 17 UNITED STATES DEPARTMENT OF LABOR UNITED STATES DEPARTMENT OF EDUCATION
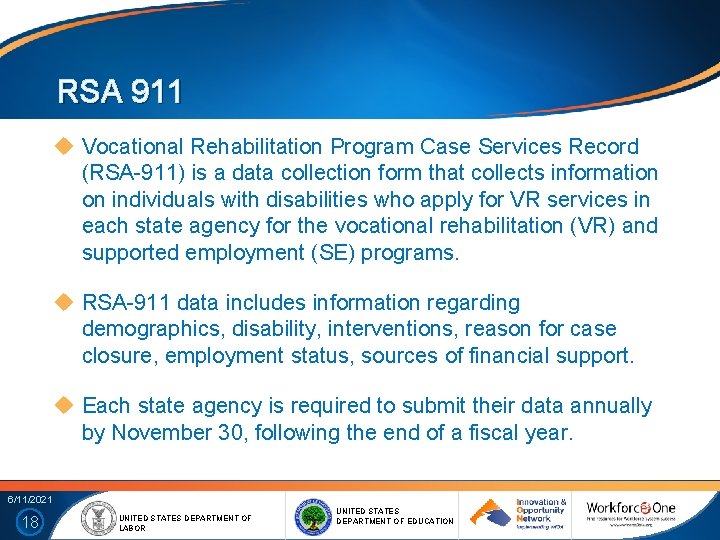
RSA 911 Vocational Rehabilitation Program Case Services Record (RSA-911) is a data collection form that collects information on individuals with disabilities who apply for VR services in each state agency for the vocational rehabilitation (VR) and supported employment (SE) programs. RSA-911 data includes information regarding demographics, disability, interventions, reason for case closure, employment status, sources of financial support. Each state agency is required to submit their data annually by November 30, following the end of a fiscal year. 6/11/2021 18 UNITED STATES DEPARTMENT OF LABOR UNITED STATES DEPARTMENT OF EDUCATION
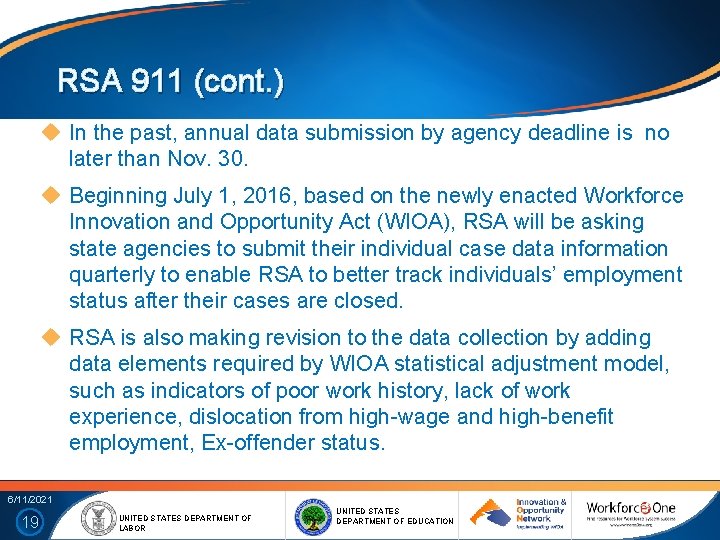
RSA 911 (cont. ) In the past, annual data submission by agency deadline is no later than Nov. 30. Beginning July 1, 2016, based on the newly enacted Workforce Innovation and Opportunity Act (WIOA), RSA will be asking state agencies to submit their individual case data information quarterly to enable RSA to better track individuals’ employment status after their cases are closed. RSA is also making revision to the data collection by adding data elements required by WIOA statistical adjustment model, such as indicators of poor work history, lack of work experience, dislocation from high-wage and high-benefit employment, Ex-offender status. 6/11/2021 19 UNITED STATES DEPARTMENT OF LABOR UNITED STATES DEPARTMENT OF EDUCATION
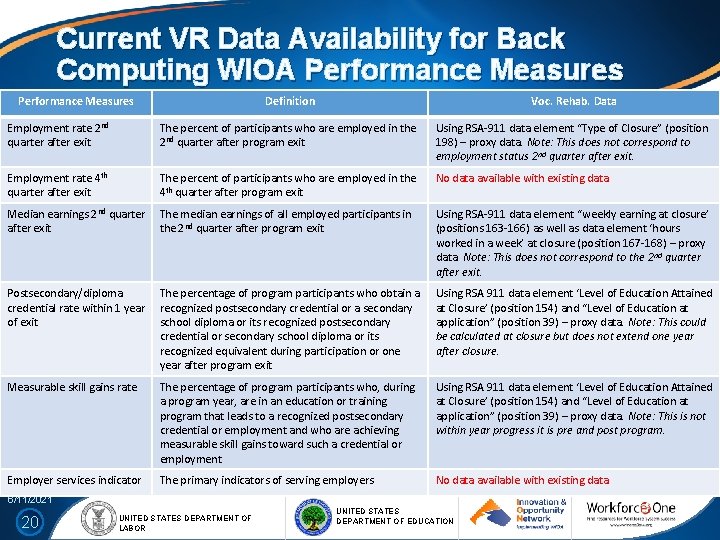
Current VR Data Availability for Back Computing WIOA Performance Measures Definition Voc. Rehab. Data Employment rate 2 nd quarter after exit The percent of participants who are employed in the 2 nd quarter after program exit Using RSA-911 data element “Type of Closure” (position 198) – proxy data. Note: This does not correspond to employment status 2 nd quarter after exit. Employment rate 4 th quarter after exit The percent of participants who are employed in the 4 th quarter after program exit No data available with existing data Median earnings 2 nd quarter after exit The median earnings of all employed participants in the 2 nd quarter after program exit Using RSA-911 data element “weekly earning at closure’ (positions 163 -166) as well as data element ‘hours worked in a week’ at closure (position 167 -168) – proxy data. Note: This does not correspond to the 2 nd quarter after exit. Postsecondary/diploma credential rate within 1 year of exit The percentage of program participants who obtain a recognized postsecondary credential or a secondary school diploma or its recognized postsecondary credential or secondary school diploma or its recognized equivalent during participation or one year after program exit Using RSA 911 data element ‘Level of Education Attained at Closure’ (position 154) and “Level of Education at application” (position 39) – proxy data. Note: This could be calculated at closure but does not extend one year after closure. Measurable skill gains rate The percentage of program participants who, during a program year, are in an education or training program that leads to a recognized postsecondary credential or employment and who are achieving measurable skill gains toward such a credential or employment Using RSA 911 data element ‘Level of Education Attained at Closure’ (position 154) and “Level of Education at application” (position 39) – proxy data. Note: This is not within year progress it is pre and post program. Employer services indicator The primary indicators of serving employers No data available with existing data 6/11/2021 20 UNITED STATES DEPARTMENT OF LABOR UNITED STATES DEPARTMENT OF EDUCATION
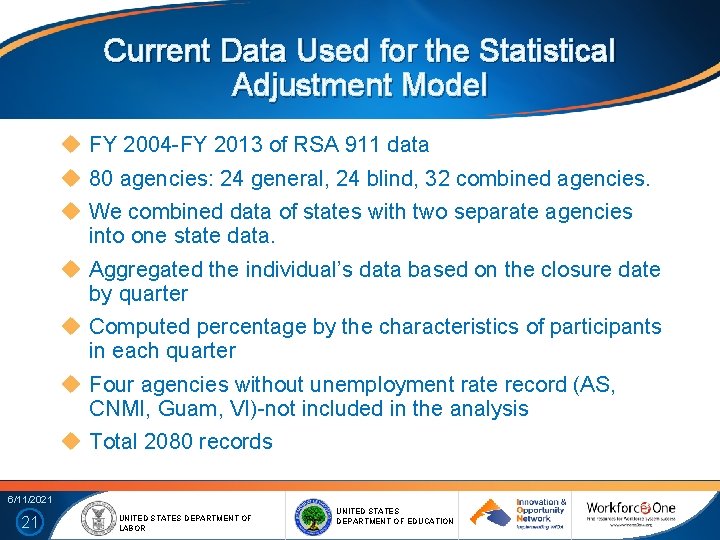
Current Data Used for the Statistical Adjustment Model FY 2004 -FY 2013 of RSA 911 data 80 agencies: 24 general, 24 blind, 32 combined agencies. We combined data of states with two separate agencies into one state data. Aggregated the individual’s data based on the closure date by quarter Computed percentage by the characteristics of participants in each quarter Four agencies without unemployment rate record (AS, CNMI, Guam, VI)-not included in the analysis Total 2080 records 6/11/2021 21 UNITED STATES DEPARTMENT OF LABOR UNITED STATES DEPARTMENT OF EDUCATION
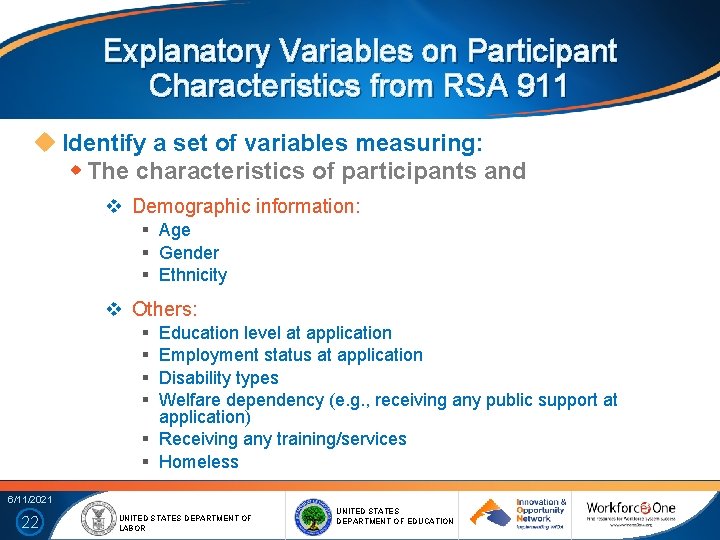
Explanatory Variables on Participant Characteristics from RSA 911 Identify a set of variables measuring: The characteristics of participants and v Demographic information: § Age § Gender § Ethnicity v Others: § § Education level at application Employment status at application Disability types Welfare dependency (e. g. , receiving any public support at application) § Receiving any training/services § Homeless 6/11/2021 22 UNITED STATES DEPARTMENT OF LABOR UNITED STATES DEPARTMENT OF EDUCATION
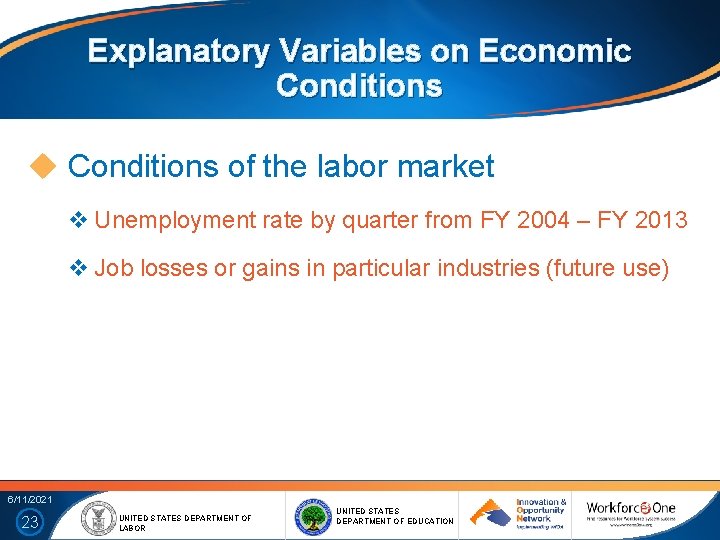
Explanatory Variables on Economic Conditions of the labor market v Unemployment rate by quarter from FY 2004 – FY 2013 v Job losses or gains in particular industries (future use) 6/11/2021 23 UNITED STATES DEPARTMENT OF LABOR UNITED STATES DEPARTMENT OF EDUCATION
Methods RSA has been following DOL’s work on the method (same framework but different explanatory variables). For the current model run, one core measure “employment rate (in percentage)” is used as an outcome measure. 6/11/2021 24 UNITED STATES DEPARTMENT OF LABOR UNITED STATES DEPARTMENT OF EDUCATION
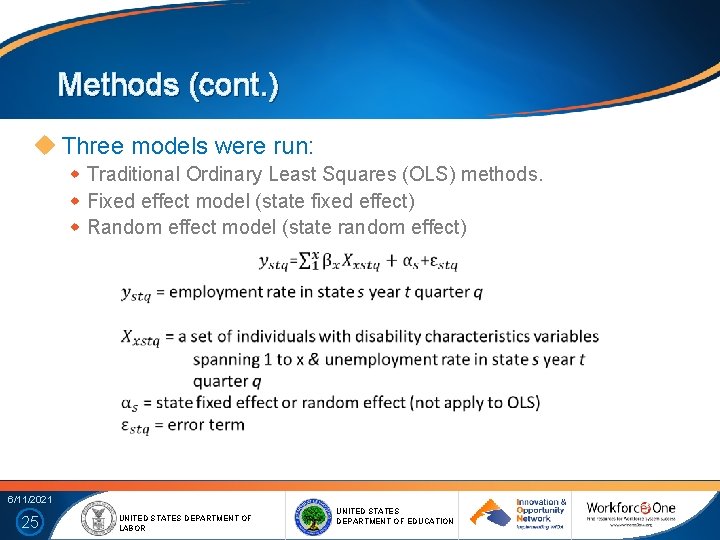
Methods (cont. ) Three models were run: Traditional Ordinary Least Squares (OLS) methods. Fixed effect model (state fixed effect) Random effect model (state random effect) 6/11/2021 25 UNITED STATES DEPARTMENT OF LABOR UNITED STATES DEPARTMENT OF EDUCATION
Results from different methods show similar parameter estimates. The initial model run result shows that RSA VR data seems to be explaining less variation in outcomes when compared to DOL. RSA data have larger unit effects (state) and more variation around the targets. 6/11/2021 26 UNITED STATES DEPARTMENT OF LABOR UNITED STATES DEPARTMENT OF EDUCATION
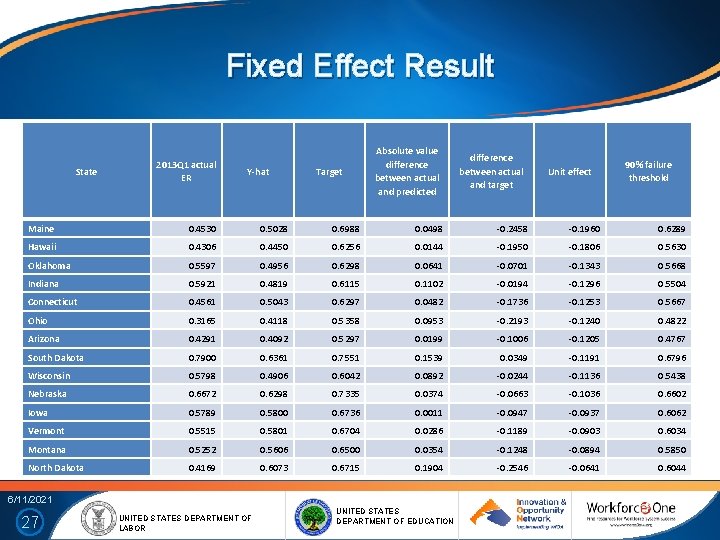
Fixed Effect Result State 2013 Q 1 actual ER Y-hat Target Absolute value difference between actual and predicted difference between actual and target Unit effect 90% failure threshold Maine 0. 4530 0. 5028 0. 6988 0. 0498 -0. 2458 -0. 1960 0. 6289 Hawaii 0. 4306 0. 4450 0. 6256 0. 0144 -0. 1950 -0. 1806 0. 5630 Oklahoma 0. 5597 0. 4956 0. 6298 0. 0641 -0. 0701 -0. 1343 0. 5668 Indiana 0. 5921 0. 4819 0. 6115 0. 1102 -0. 0194 -0. 1296 0. 5504 Connecticut 0. 4561 0. 5043 0. 6297 0. 0482 -0. 1736 -0. 1253 0. 5667 Ohio 0. 3165 0. 4118 0. 5358 0. 0953 -0. 2193 -0. 1240 0. 4822 Arizona 0. 4291 0. 4092 0. 5297 0. 0199 -0. 1006 -0. 1205 0. 4767 South Dakota 0. 7900 0. 6361 0. 7551 0. 1539 0. 0349 -0. 1191 0. 6796 Wisconsin 0. 5798 0. 4906 0. 6042 0. 0892 -0. 0244 -0. 1136 0. 5438 Nebraska 0. 6672 0. 6298 0. 7335 0. 0374 -0. 0663 -0. 1036 0. 6602 Iowa 0. 5789 0. 5800 0. 6736 0. 0011 -0. 0947 -0. 0937 0. 6062 Vermont 0. 5515 0. 5801 0. 6704 0. 0286 -0. 1189 -0. 0903 0. 6034 Montana 0. 5252 0. 5606 0. 6500 0. 0354 -0. 1248 -0. 0894 0. 5850 North Dakota 0. 4169 0. 6073 0. 6715 0. 1904 -0. 2546 -0. 0641 0. 6044 6/11/2021 27 UNITED STATES DEPARTMENT OF LABOR UNITED STATES DEPARTMENT OF EDUCATION
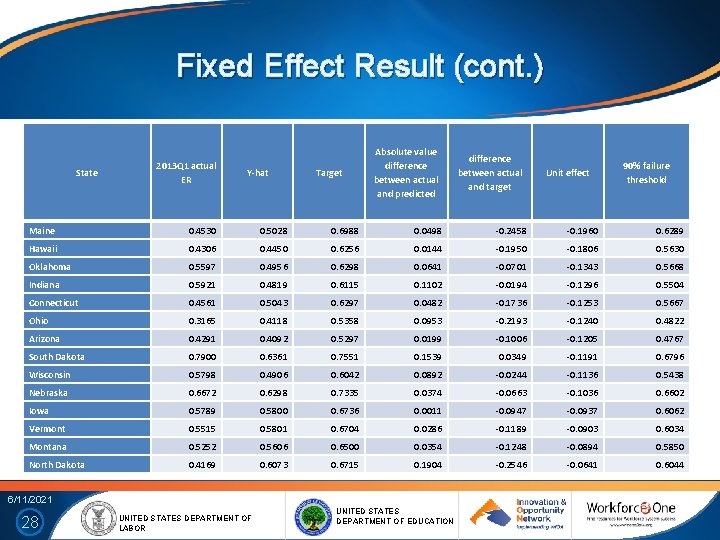
Fixed Effect Result (cont. ) State 2013 Q 1 actual ER Y-hat Target Absolute value difference between actual and predicted difference between actual and target Unit effect 90% failure threshold Maine 0. 4530 0. 5028 0. 6988 0. 0498 -0. 2458 -0. 1960 0. 6289 Hawaii 0. 4306 0. 4450 0. 6256 0. 0144 -0. 1950 -0. 1806 0. 5630 Oklahoma 0. 5597 0. 4956 0. 6298 0. 0641 -0. 0701 -0. 1343 0. 5668 Indiana 0. 5921 0. 4819 0. 6115 0. 1102 -0. 0194 -0. 1296 0. 5504 Connecticut 0. 4561 0. 5043 0. 6297 0. 0482 -0. 1736 -0. 1253 0. 5667 Ohio 0. 3165 0. 4118 0. 5358 0. 0953 -0. 2193 -0. 1240 0. 4822 Arizona 0. 4291 0. 4092 0. 5297 0. 0199 -0. 1006 -0. 1205 0. 4767 South Dakota 0. 7900 0. 6361 0. 7551 0. 1539 0. 0349 -0. 1191 0. 6796 Wisconsin 0. 5798 0. 4906 0. 6042 0. 0892 -0. 0244 -0. 1136 0. 5438 Nebraska 0. 6672 0. 6298 0. 7335 0. 0374 -0. 0663 -0. 1036 0. 6602 Iowa 0. 5789 0. 5800 0. 6736 0. 0011 -0. 0947 -0. 0937 0. 6062 Vermont 0. 5515 0. 5801 0. 6704 0. 0286 -0. 1189 -0. 0903 0. 6034 Montana 0. 5252 0. 5606 0. 6500 0. 0354 -0. 1248 -0. 0894 0. 5850 North Dakota 0. 4169 0. 6073 0. 6715 0. 1904 -0. 2546 -0. 0641 0. 6044 6/11/2021 28 UNITED STATES DEPARTMENT OF LABOR UNITED STATES DEPARTMENT OF EDUCATION
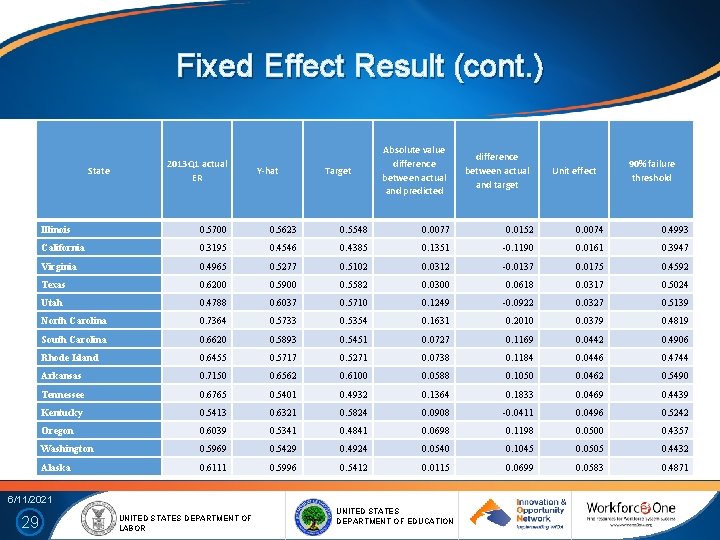
Fixed Effect Result (cont. ) State 2013 Q 1 actual ER Y-hat Target Absolute value difference between actual and predicted Unit effect 90% failure threshold Illinois 0. 5700 0. 5623 0. 5548 0. 0077 0. 0152 0. 0074 0. 4993 California 0. 3195 0. 4546 0. 4385 0. 1351 -0. 1190 0. 0161 0. 3947 Virginia 0. 4965 0. 5277 0. 5102 0. 0312 -0. 0137 0. 0175 0. 4592 Texas 0. 6200 0. 5900 0. 5582 0. 0300 0. 0618 0. 0317 0. 5024 Utah 0. 4788 0. 6037 0. 5710 0. 1249 -0. 0922 0. 0327 0. 5139 North Carolina 0. 7364 0. 5733 0. 5354 0. 1631 0. 2010 0. 0379 0. 4819 South Carolina 0. 6620 0. 5893 0. 5451 0. 0727 0. 1169 0. 0442 0. 4906 Rhode Island 0. 6455 0. 5717 0. 5271 0. 0738 0. 1184 0. 0446 0. 4744 Arkansas 0. 7150 0. 6562 0. 6100 0. 0588 0. 1050 0. 0462 0. 5490 Tennessee 0. 6765 0. 5401 0. 4932 0. 1364 0. 1833 0. 0469 0. 4439 Kentucky 0. 5413 0. 6321 0. 5824 0. 0908 -0. 0411 0. 0496 0. 5242 Oregon 0. 6039 0. 5341 0. 4841 0. 0698 0. 1198 0. 0500 0. 4357 Washington 0. 5969 0. 5429 0. 4924 0. 0540 0. 1045 0. 0505 0. 4432 Alaska 0. 6111 0. 5996 0. 5412 0. 0115 0. 0699 0. 0583 0. 4871 6/11/2021 29 difference between actual and target UNITED STATES DEPARTMENT OF LABOR UNITED STATES DEPARTMENT OF EDUCATION
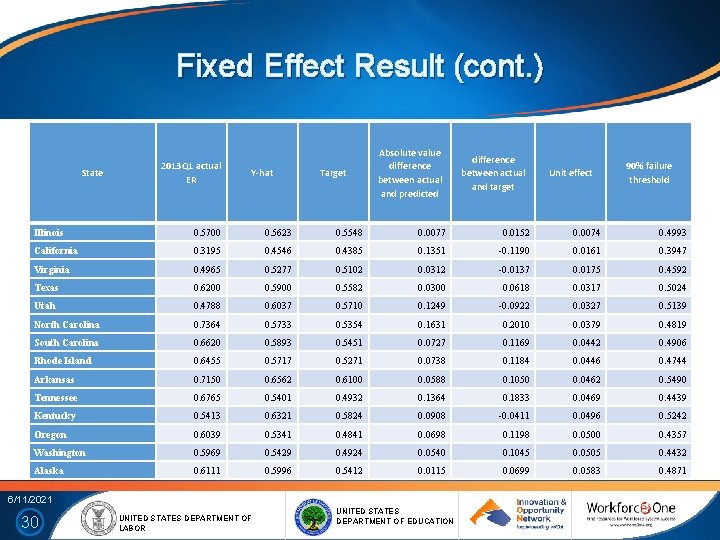
Fixed Effect Result (cont. ) State 2013 Q 1 actual ER Y-hat Target Absolute value difference between actual and predicted difference between actual and target Unit effect 90% failure threshold Illinois 0. 5700 0. 5623 0. 5548 0. 0077 0. 0152 0. 0074 0. 4993 California 0. 3195 0. 4546 0. 4385 0. 1351 -0. 1190 0. 0161 0. 3947 Virginia 0. 4965 0. 5277 0. 5102 0. 0312 -0. 0137 0. 0175 0. 4592 Texas 0. 6200 0. 5900 0. 5582 0. 0300 0. 0618 0. 0317 0. 5024 Utah 0. 4788 0. 6037 0. 5710 0. 1249 -0. 0922 0. 0327 0. 5139 North Carolina 0. 7364 0. 5733 0. 5354 0. 1631 0. 2010 0. 0379 0. 4819 South Carolina 0. 6620 0. 5893 0. 5451 0. 0727 0. 1169 0. 0442 0. 4906 Rhode Island 0. 6455 0. 5717 0. 5271 0. 0738 0. 1184 0. 0446 0. 4744 Arkansas 0. 7150 0. 6562 0. 6100 0. 0588 0. 1050 0. 0462 0. 5490 Tennessee 0. 6765 0. 5401 0. 4932 0. 1364 0. 1833 0. 0469 0. 4439 Kentucky 0. 5413 0. 6321 0. 5824 0. 0908 -0. 0411 0. 0496 0. 5242 Oregon 0. 6039 0. 5341 0. 4841 0. 0698 0. 1198 0. 0500 0. 4357 Washington 0. 5969 0. 5429 0. 4924 0. 0540 0. 1045 0. 0505 0. 4432 Alaska 0. 6111 0. 5996 0. 5412 0. 0115 0. 0699 0. 0583 0. 4871 6/11/2021 30 UNITED STATES DEPARTMENT OF LABOR UNITED STATES DEPARTMENT OF EDUCATION
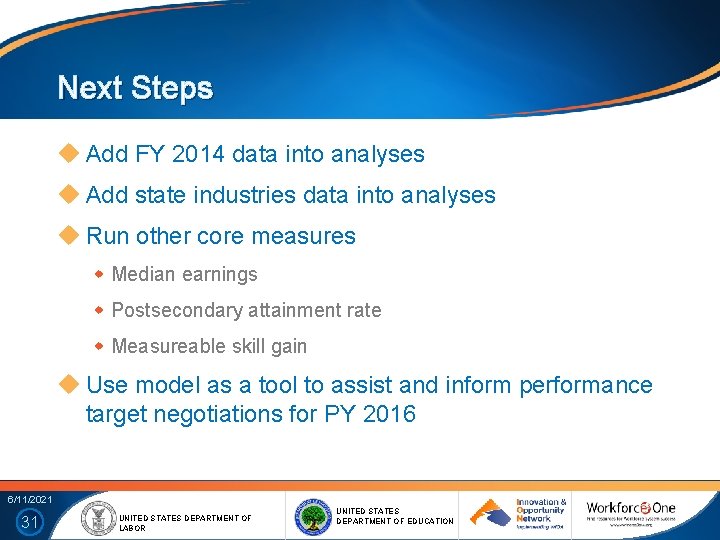
Next Steps Add FY 2014 data into analyses Add state industries data into analyses Run other core measures Median earnings Postsecondary attainment rate Measureable skill gain Use model as a tool to assist and inform performance target negotiations for PY 2016 6/11/2021 31 UNITED STATES DEPARTMENT OF LABOR UNITED STATES DEPARTMENT OF EDUCATION
PART III Managing Director American Institutes for Research Workforce and Lifelong Learning Program Senior Researcher American Institutes for Research Workforce and Lifelong Learning Program 6/11/2021 32 UNITED STATES DEPARTMENT OF LABOR UNITED STATES DEPARTMENT OF EDUCATION
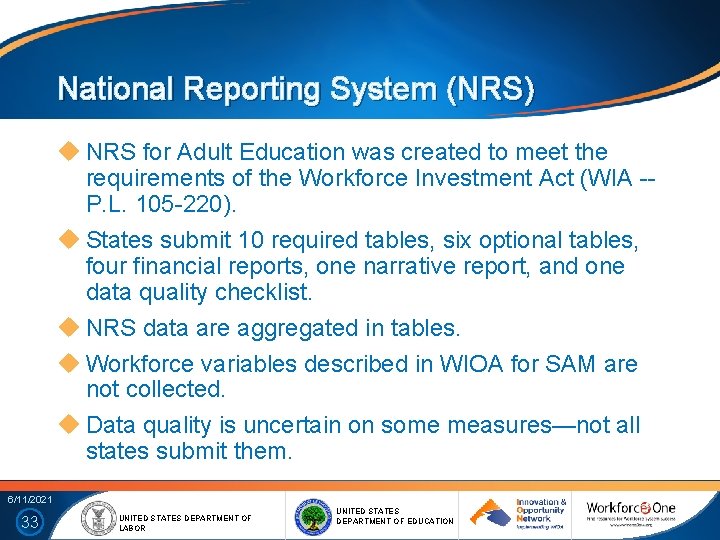
National Reporting System (NRS) NRS for Adult Education was created to meet the requirements of the Workforce Investment Act (WIA -P. L. 105 -220). States submit 10 required tables, six optional tables, four financial reports, one narrative report, and one data quality checklist. NRS data are aggregated in tables. Workforce variables described in WIOA for SAM are not collected. Data quality is uncertain on some measures—not all states submit them. 6/11/2021 33 UNITED STATES DEPARTMENT OF LABOR UNITED STATES DEPARTMENT OF EDUCATION
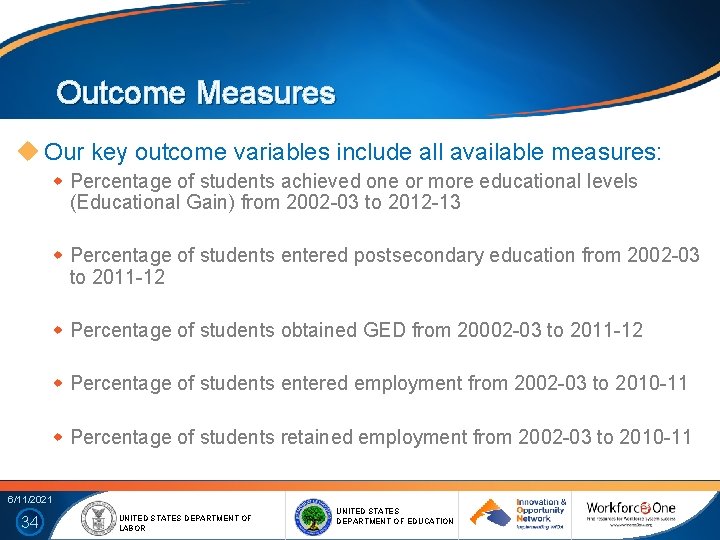
Outcome Measures Our key outcome variables include all available measures: Percentage of students achieved one or more educational levels (Educational Gain) from 2002 -03 to 2012 -13 Percentage of students entered postsecondary education from 2002 -03 to 2011 -12 Percentage of students obtained GED from 20002 -03 to 2011 -12 Percentage of students entered employment from 2002 -03 to 2010 -11 Percentage of students retained employment from 2002 -03 to 2010 -11 6/11/2021 34 UNITED STATES DEPARTMENT OF LABOR UNITED STATES DEPARTMENT OF EDUCATION
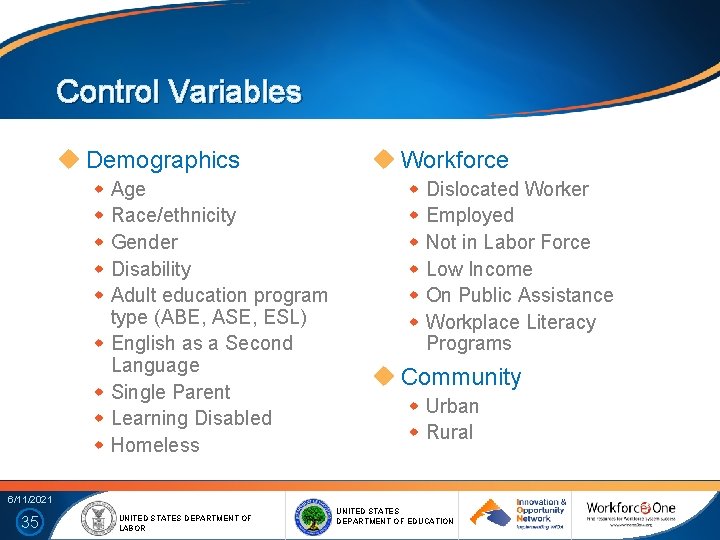
Control Variables Demographics Age Race/ethnicity Gender Disability Adult education program type (ABE, ASE, ESL) English as a Second Language Single Parent Learning Disabled Homeless Workforce Dislocated Worker Employed Not in Labor Force Low Income On Public Assistance Workplace Literacy Programs Community Urban Rural 6/11/2021 35 UNITED STATES DEPARTMENT OF LABOR UNITED STATES DEPARTMENT OF EDUCATION
Analyses are conducted at state level due to NRS limitations Decreased precision in estimating the relationships between indicators and outcome measures Can only be used to evaluate state level performance 6/11/2021 36 UNITED STATES DEPARTMENT OF LABOR UNITED STATES DEPARTMENT OF EDUCATION
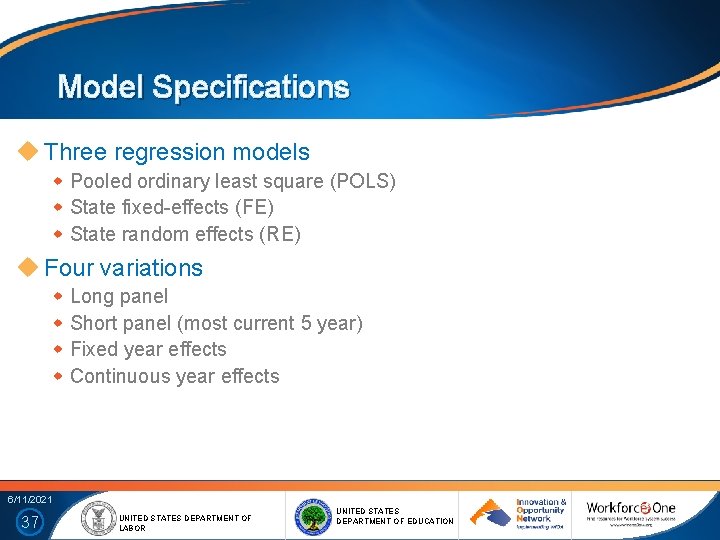
Model Specifications Three regression models Pooled ordinary least square (POLS) State fixed-effects (FE) State random effects (RE) Four variations Long panel Short panel (most current 5 year) Fixed year effects Continuous year effects 6/11/2021 37 UNITED STATES DEPARTMENT OF LABOR UNITED STATES DEPARTMENT OF EDUCATION
Procedure Estimate models by leaving the most current available data out for validation Compute predicted performance measures for the states for the most current year Compare the predicted and actual performance measures Evaluate models by using the mean squared error of the residual 6/11/2021 38 UNITED STATES DEPARTMENT OF LABOR UNITED STATES DEPARTMENT OF EDUCATION
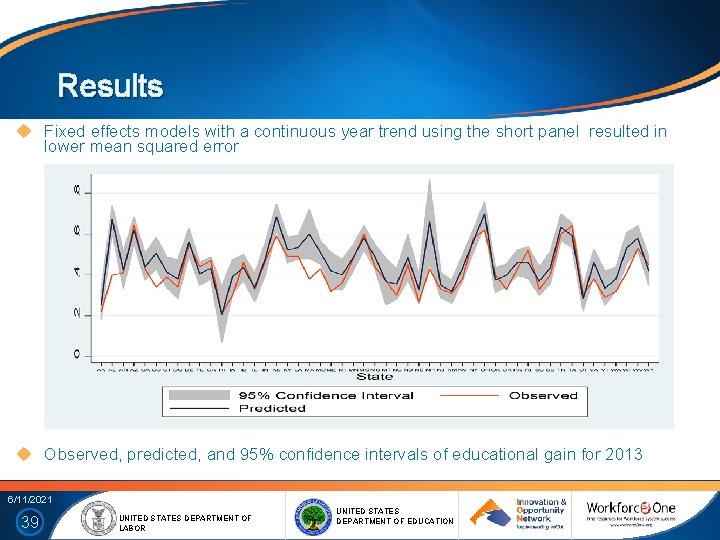
Results Fixed effects models with a continuous year trend using the short panel resulted in lower mean squared error Observed, predicted, and 95% confidence intervals of educational gain for 2013 6/11/2021 39 UNITED STATES DEPARTMENT OF LABOR UNITED STATES DEPARTMENT OF EDUCATION
POLLING QUESTION Let us know which area you represent today: Workforce Adult Education Vocational Rehabilitation Other 6/11/2021 40 UNITED STATES DEPARTMENT OF LABOR UNITED STATES DEPARTMENT OF EDUCATION

Please Enter Your Questions in the Chat Room! 6/11/2021 41 UNITED STATES DEPARTMENT OF LABOR UNITED STATES DEPARTMENT OF EDUCATION
Presenters’ Contact Information Mathematical Statistician Managing Director U. S. Department of Labor Chief Evaluation Office Sutter. Ryan@dol. gov American Institutes for Research Workforce and Lifelong Learning Program LCondelli@air. org Statistician Senior Researcher U. S. Department of Education American Institutes for Research Workforce and Lifelong Learning Program bogut@air. org Rehabilitation Services Administration Yann-Yann. Shieh@ed. gov 6/11/2021 42 UNITED STATES DEPARTMENT OF LABOR UNITED STATES DEPARTMENT OF EDUCATION

6/11/2021 43 UNITED STATES DEPARTMENT OF LABOR UNITED STATES DEPARTMENT OF EDUCATION
- Slides: 43