Decarbonization pathways Marion Labatut 28 June 2019 Energy

Decarbonization pathways Marion Labatut 28 June 2019 Energy. Post – PGE event
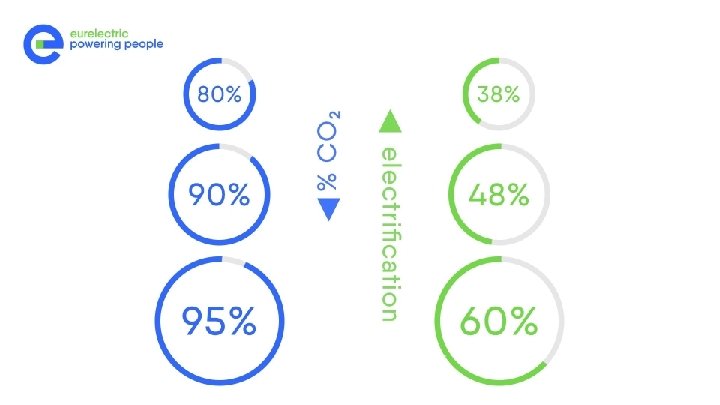

Renewables account for ~80% of total installed capacity by 2045, while coal is phased out over the period % Capacity evolution by fuel type, GW Offshore wind Onshore wind 2, 800 Solar Hydro and other RES 1 Nuclear 2 81% Gas and other non-RES 3 Share renewables Coal 2 82% 83% 2, 400 2, 000 1, 600 1, 200 800 400 0 2015 20 30 40 80% EU economy decarbonization 1 Includes also small amounts of geothermal, biomass and biogas 2 National policies on nuclear and coal phase out have been reflected 3 Up to 15% of gas capacity with CCS and other non-renewables SOURCE: 2015 capacity from Enerdata 45 2015 20 30 40 90% EU economy decarbonization 45 2015 20 30 40 45 95% EU economy decarbonization with cost breakthrough 4

Significant investments will be required to decarbonize the power sector, but will also enable decarbonization of other sectors Average annual capital investment cost 2020 - 20451, EUR bn 111 108 • 89 Reaching 80 – 95% EU economy decarbonization will require a significant ramp-up of investments to accomplish 1) large increase in generating capacity to meet electricity demand growth that is unprecedented in recent times 2) shift of the current generation stack to carbon neutral electricity sources • 80% EU economy 95% EU economy decarbonization These investments will compensate for investments needed to decarbonize other sectors and are not for the power sector alone 1 Real cost linked to 2016 price level 5

Different starting points have to be taken into account

TWh electricity generation CAPEX in power generation and storage: 128 -147 bn€ over 2020 -2045

- Slides: 8