Debugging Scalable Applications on the XT May 2

Debugging Scalable Applications on the XT May 2 nd 2009 Chris Gottbrath Director, Product Management
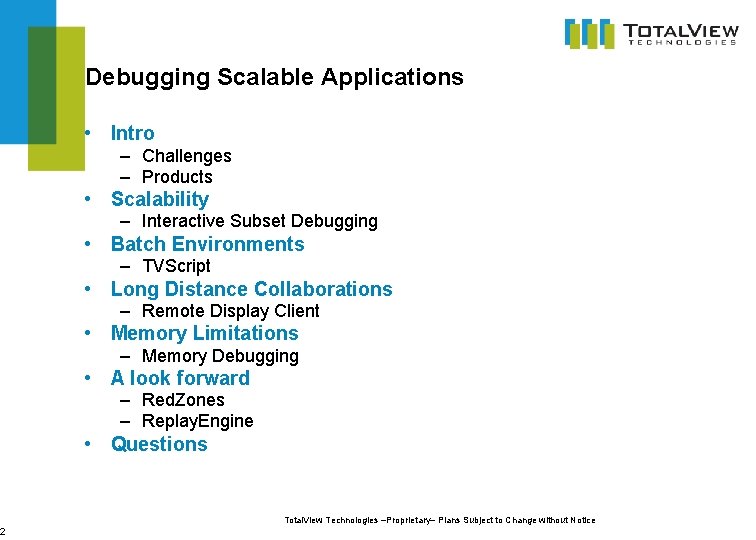
2 Debugging Scalable Applications • Intro – Challenges – Products • Scalability – Interactive Subset Debugging • Batch Environments – TVScript • Long Distance Collaborations – Remote Display Client • Memory Limitations – Memory Debugging • A look forward – Red. Zones – Replay. Engine • Questions Total. View Technologies –Proprietary– Plans Subject to Change without Notice
3 HPC Debugging Challenges • There are different kinds of challenges – Technical – Educational – Organizational • It seems to me that they revolve around 3 C’s – Concurrency – Complexity – Collaboration Total. View Technologies –Proprietary– Plans Subject to Change without Notice
4 Challenges: Concurrency • Distributed multi-process – – • Hybrid and/or multi-threaded – – • Processes may be doing the same thing or different things Data is distributed across the cluster Behavior can sometimes be hard to reproduce A hung process can sometimes be hard to differentiate from a hung node Behavior can be hard to reproduce May introduce a second tier of parallelism Scalability – Runs may include tens or hundreds of thousands of threads of execution • • • – Performance of the user’s program Performance of tool Details can overwhelm the user How do the users want to interact with these large jobs • • • Lightweight tools? Work with a subset of the processes? Fully featured debugging on the full scale jobs? Total. View Technologies –Proprietary– Plans Subject to Change without Notice
5 Challenges: Complexity • Software tool chain – Languages and new language constructs – Multiple compilers and platforms • Hardware and runtime – Available node memory – Processor characteristics (with things like the Cell) – What facilities does the runtime provide • Breaking new ground – The “right” answers may be unknown • Validation from previous models Total. View Technologies –Proprietary– Plans Subject to Change without Notice
6 Challenges: Community • Codes are developed by large teams – Train team members on the code and tools and platforms – Share the most effective techniques – Coordinate troubleshooting with the appropriate experts within the team • Teams may be highly distributed – Geographically and organizationally – Debugging may happen from across the hall or across the globe • Management of system resources – Balancing development and production needs – Problems can occur at production scale and with production datasets • Should users be allowed to troubleshoot in production queues and at production scale? – Debugging needs to be able to work with different queue policies Total. View Technologies –Proprietary– Plans Subject to Change without Notice
7 Solutions • Product Overview – Total. View – Memory. Scape – Replay. Engine • Large Scale Concurrency – Interactive Subset Debugging • Batch Environments – Batch Debugging with TVScript • Collaboration – Long Distance Remote Debugging • Memory Limitations – Memory Debugging Total. View Technologies –Proprietary– Plans Subject to Change without Notice
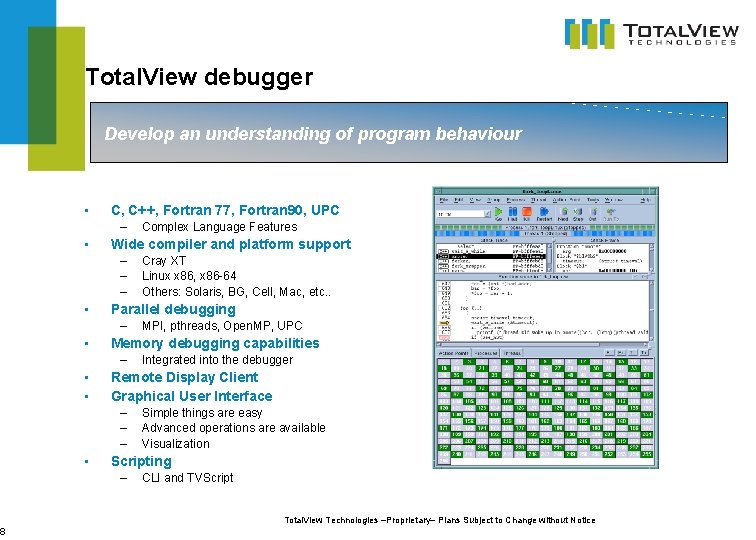
8 Total. View debugger Develop an understanding of program behaviour • C, C++, Fortran 77, Fortran 90, UPC – • Wide compiler and platform support – – – • Integrated into the debugger Remote Display Client Graphical User Interface – – – • MPI, pthreads, Open. MP, UPC Memory debugging capabilities – • • Cray XT Linux x 86, x 86 -64 Others: Solaris, BG, Cell, Mac, etc. . Parallel debugging – • Complex Language Features Simple things are easy Advanced operations are available Visualization Scripting – CLI and TVScript Total. View Technologies –Proprietary– Plans Subject to Change without Notice
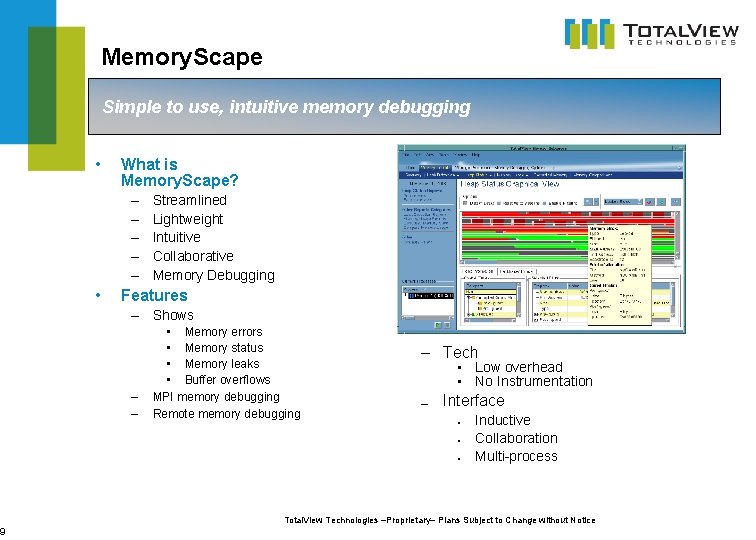
9 Memory. Scape Simple to use, intuitive memory debugging • What is Memory. Scape? – – – • Streamlined Lightweight Intuitive Collaborative Memory Debugging Features – Shows – – • Memory errors • Memory status • Memory leaks • Buffer overflows MPI memory debugging Remote memory debugging – Tech • Low overhead • No Instrumentation — Interface ● ● ● Inductive Collaboration Multi-process Total. View Technologies –Proprietary– Plans Subject to Change without Notice
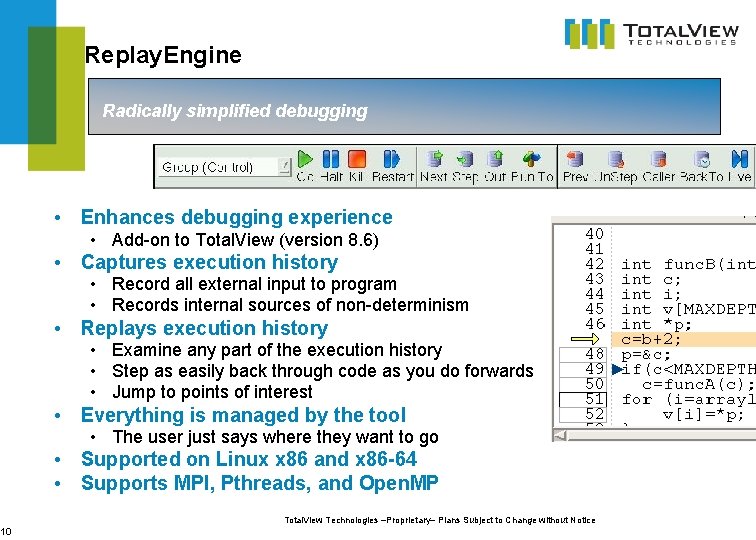
10 Replay. Engine Radically simplified debugging • Enhances debugging experience • Add-on to Total. View (version 8. 6) • Captures execution history • Record all external input to program • Records internal sources of non-determinism • Replays execution history • Examine any part of the execution history • Step as easily back through code as you do forwards • Jump to points of interest • Everything is managed by the tool • The user just says where they want to go • Supported on Linux x 86 and x 86 -64 • Supports MPI, Pthreads, and Open. MP Total. View Technologies –Proprietary– Plans Subject to Change without Notice
11 Large Scale Concurrency • Dealing with Terra and Peta Scale – Challenging for interactive tools – Multiple approaches • Interactive Subset Debugging • Ongoing Tool Scalability Improvements • Scalable Display of Data Total. View Technologies –Proprietary– Plans Subject to Change without Notice
12 Attaching the Debugger to Part of a Job • Debug a subset of the processes that make up the job – Sometimes the user does not need to control and see every process to understand the behavior or id the defect • The subset can be changed at any time – Can narrow, expand or shift focus • Uncouples interactive performance from job size – After the subset operation completes – Interactive performance depends on subset size • Supports the use of lightweight tools – LLNL’s STAT • Recent work – 1 k of 16 k acts like 1 k of 1 k – BG subset support – Enhanced support for tools integration Total. View Technologies –Proprietary– Plans Subject to Change without Notice
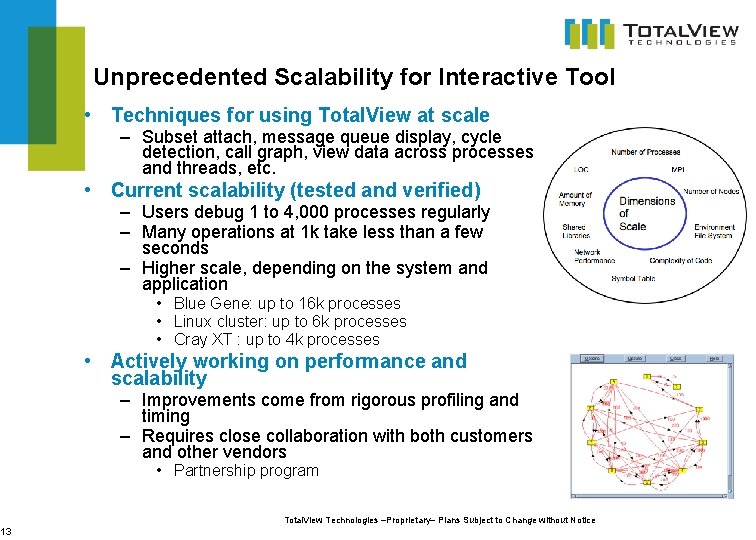
13 Unprecedented Scalability for Interactive Tool • Techniques for using Total. View at scale – Subset attach, message queue display, cycle detection, call graph, view data across processes and threads, etc. • Current scalability (tested and verified) – Users debug 1 to 4, 000 processes regularly – Many operations at 1 k take less than a few seconds – Higher scale, depending on the system and application • Blue Gene: up to 16 k processes • Linux cluster: up to 6 k processes • Cray XT : up to 4 k processes • Actively working on performance and scalability – Improvements come from rigorous profiling and timing – Requires close collaboration with both customers and other vendors • Partnership program Total. View Technologies –Proprietary– Plans Subject to Change without Notice
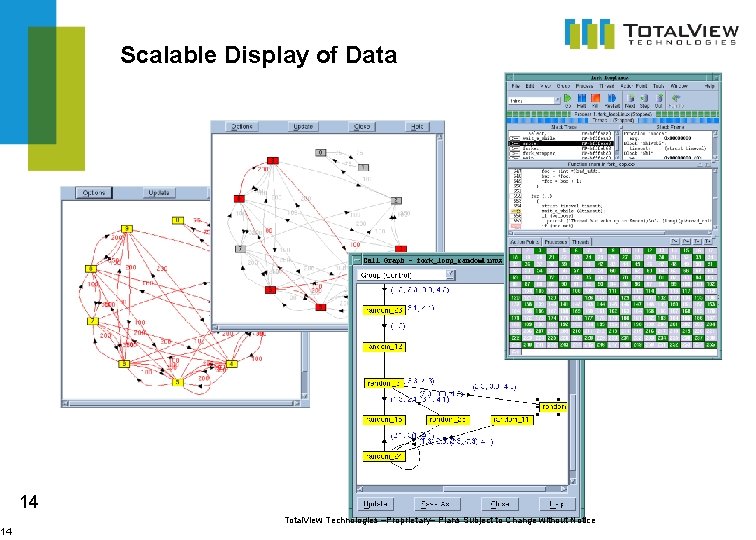
14 Scalable Display of Data 14 Total. View Technologies –Proprietary– Plans Subject to Change without Notice
15 Debugging in Batch Environment • Batch Environments Support – Many users – Non-interactive usage model • • • Upload data and code Compile Submit Wait Run Download results – Interactive queues • Some sites • Smaller scale • How to do debugging in this model? – printf() – Manual Total. View CLI scripting – TVScript Total. View Technologies –Proprietary– Plans Subject to Change without Notice
16 Batch Debugging with TVScript • • New in Total. View 8. 6 User extensible script to drive a target program to completion under the Total. View debugger. Handles all the event management overhead so the user doesn’t have to. Allows – You to gather debugging data in the “regular queue” without interactivity while the program runs – You to do very structured and reproducible kinds of problem analysis – You to “narrow down” problems so that you can do focused interactive debugging as a second stage • How does it work – You define breakpoints – You associate operations with those breakpoints such as • • • Print a specific variable Print all local variables Stack trace Count Set other breakpoints, watchpoints Set data within the program – You submits the script into the batch queue and it runs without any user interaction – Output is gathered into a single debugging output file Total. View Technologies –Proprietary– Plans Subject to Change without Notice
17 Collaboration • Diverse collaborations – – Scientific or technical domain experts Computer scientists System consultants Grad students of various flavors • Geographically Distributed • Enabling access – Long Distance Remote Debugging • Sharing Data – Reports and Exports Total. View Technologies –Proprietary– Plans Subject to Change without Notice
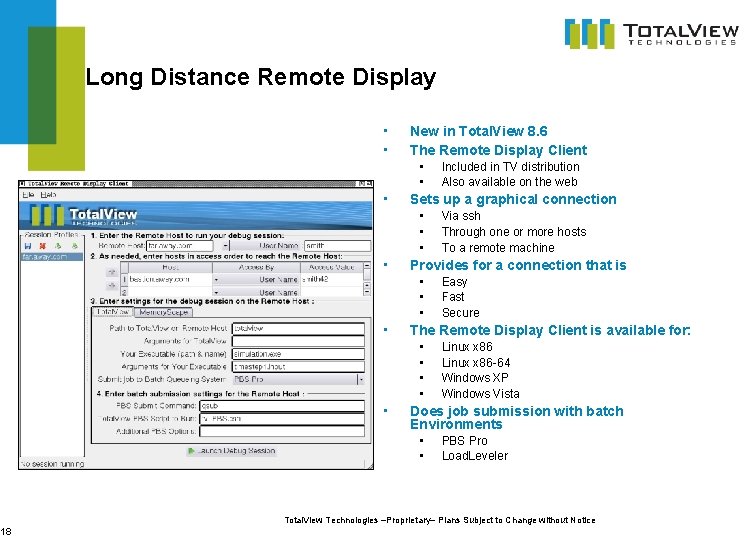
18 Long Distance Remote Display • • New in Total. View 8. 6 The Remote Display Client • • • Sets up a graphical connection • • Easy Fast Secure The Remote Display Client is available for: • • • Via ssh Through one or more hosts To a remote machine Provides for a connection that is • • Included in TV distribution Also available on the web Linux x 86 -64 Windows XP Windows Vista Does job submission with batch Environments • • PBS Pro Load. Leveler Total. View Technologies –Proprietary– Plans Subject to Change without Notice
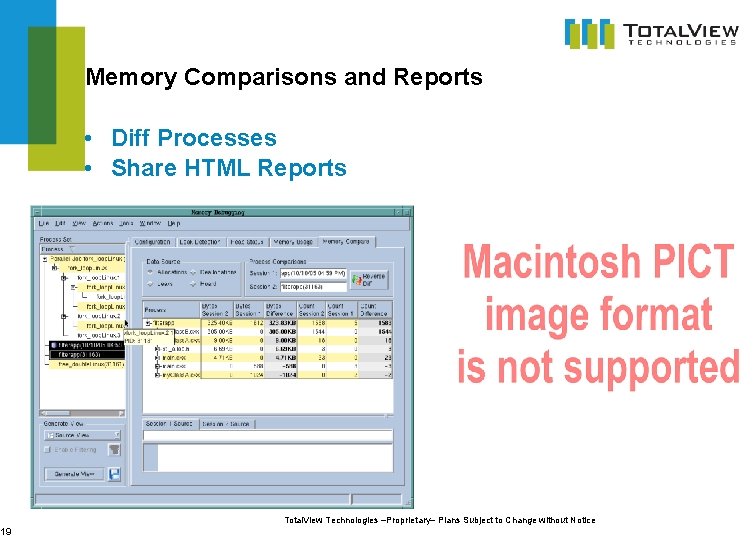
19 Memory Comparisons and Reports • Diff Processes • Share HTML Reports Total. View Technologies –Proprietary– Plans Subject to Change without Notice
20 Memory Limitations • A lot more cores, a little more memory • Detect leaks – Less space available means even small leaks are a problem • Understand memory usage – So that you know where to optimize • Compare memory behavior – – Across cluster Between two nodes Over time Between runs Total. View Technologies –Proprietary– Plans Subject to Change without Notice
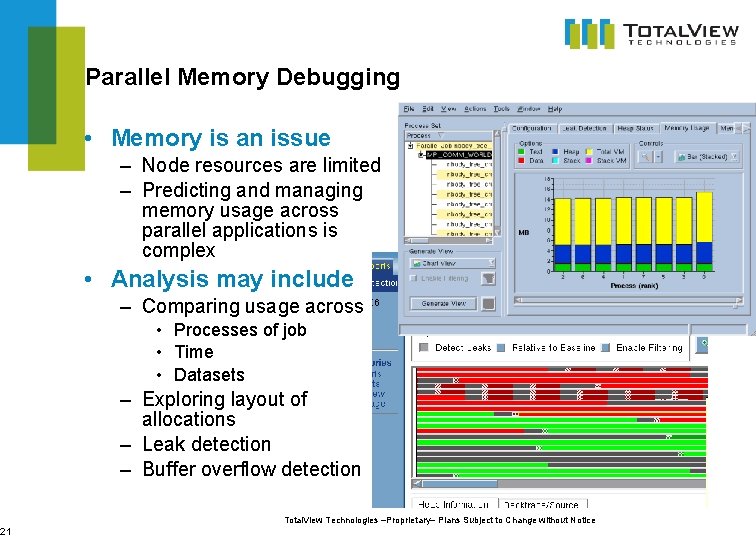
21 Parallel Memory Debugging • Memory is an issue – Node resources are limited – Predicting and managing memory usage across parallel applications is complex • Analysis may include – Comparing usage across • Processes of job • Time • Datasets – Exploring layout of allocations – Leak detection – Buffer overflow detection Total. View Technologies –Proprietary– Plans Subject to Change without Notice
22 A Look Forward • Red Zones – ‘as it happens’ heap array bounds error detection – Planned for XT in Memory. Scape 2. 0 and Total. View 8. 7 • Replay. Engine – Progress update towards support on the XT Total. View Technologies –Proprietary– Plans Subject to Change without Notice
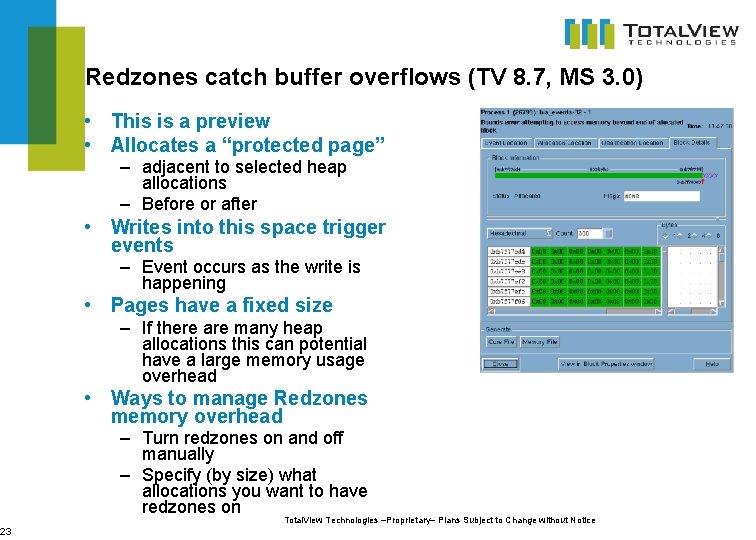
23 Redzones catch buffer overflows (TV 8. 7, MS 3. 0) • This is a preview • Allocates a “protected page” – adjacent to selected heap allocations – Before or after • Writes into this space trigger events – Event occurs as the write is happening • Pages have a fixed size – If there are many heap allocations this can potential have a large memory usage overhead • Ways to manage Redzones memory overhead – Turn redzones on and off manually – Specify (by size) what allocations you want to have redzones on Total. View Technologies –Proprietary– Plans Subject to Change without Notice
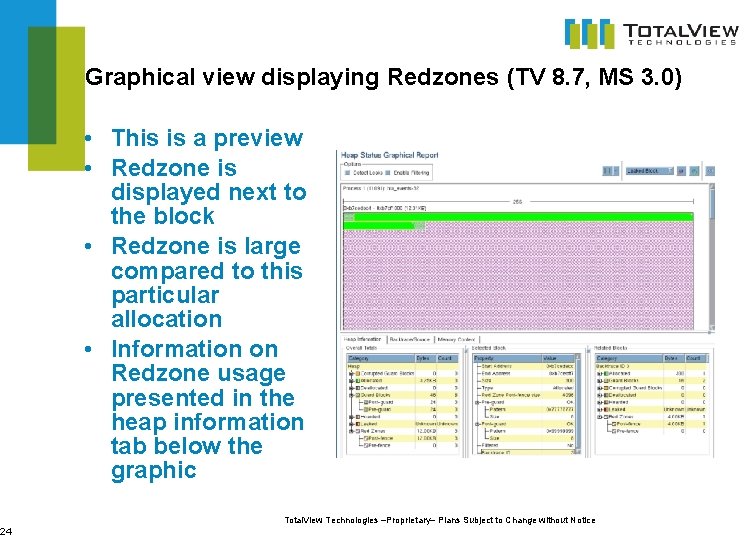
24 Graphical view displaying Redzones (TV 8. 7, MS 3. 0) • This is a preview • Redzone is displayed next to the block • Redzone is large compared to this particular allocation • Information on Redzone usage presented in the heap information tab below the graphic Total. View Technologies –Proprietary– Plans Subject to Change without Notice
25 Replay. Engine Update • In current (Replay. Engine 1. 1. 0) version • Platform: Linux-86 and Linux-86 -64 machines • Not yet supporting Cray XT CLE • MPIs (certain configurations and usage modes of) • • • MPICH 2 Open. MPI MVAPICH 2 Intel MPI HP MPI LAM • In next Version • Long-running applications • Shared memory • Remaining Issues • Actively working on XT environmental issues Total. View Technologies –Proprietary– Plans Subject to Change without Notice
26 Replay. Engine Shared Memory Support (RE 2. 0) • Multi-process shmem applications – Explicitly used in user code – Used in library code • Should enable improved MPI support – Nemesis driver in MPICH – Infiniband support • Shared memory becomes another IO stream to be recorded and replayed – Because this may involve large amounts of memory it is important to provide ways to manage memory usage. . Total. View Technologies –Proprietary– Plans Subject to Change without Notice
27 Replay. Engine Record Buffer (RE 2. 0) • Replay. Engine creates a “recording” of execution history – Collection of memory “snapshots” – Input stream – Other sources of non-determinism • Limit the size of this buffer – User configurable limit – Organize it by time – “Throw out” the oldest information when the buffer is full • Earliest part of execution history no longer accessible • Replay. Engine can be used on long-running and high -input codes Total. View Technologies –Proprietary– Plans Subject to Change without Notice
28 Questions? Total. View Technologies –Proprietary– Plans Subject to Change without Notice
29 Early Experience Program • Participate in the program to help define new products – – – High water mark memory debugging GPGPU debugging Integration of performance and debugging tools Reverse Debugging graphical representation of time Trace. Points • Broader set of users who debug using print style debugging • Eliminates frustrations – manual instrumentation – working with huge text files • Very Early Access • Input on Use Cases, Features, Designs, GUI Total. View Technologies –Proprietary– Plans Subject to Change without Notice
30 For More Information • Early Experience Program or Product Information – Contact chris. gottbrath@totalviewtech. com • Technical support – support@totalviewtech. com Total. View Technologies –Proprietary– Plans Subject to Change without Notice
- Slides: 30