Debugging is twice as hard as writing the

Debugging is twice as hard as writing the code in the first place. Therefore, if you write the code as cleverly as possible, you are, by definition, not smart enough to debug it. --Brian Kernighan Program testing can be a very effective way to show the presence of bugs, but it is hopelessly inadequate for showing their absence. --Edsger W. Dijkstra Beware of bugs in the above code; I have only proved it correct, not tried it. -- Donald Knuth

Misconceptions • Testing removes bugs Ø Inspections are more effective Ø Need multiple methods in tandem • Bugs are a problem in the code Ø Bugs in requirements, specs, and design are worse

Data from Mc. Connell / Code Complete 2 nd ed. : • Holland 1999: IBM found that 1 hour inspection prevented 100 hours testing and defect correction • Haley 1996: Raytheon reduced cost of defect correction from 40% to 20% of project cost through initiative focused on inspection • Grady and Van Slack 1994: HP reported that inspection program saved $21. 5 m/year • Gilb and Graham 1993: Imperial Chemical Ind. found that maintaining 400 inspected programs cost about 10% of maintaining a similar set of uninspected programs

• Russell 1991: in large programs 1 hour inspection avoided 33 hours maintenance on average, and inspections were up to 20 x more efficient than testing • Freedman and Weinberg 1990: 55% of oneline maintenance changes were wrong, down to 2% with inspections. <20% of all changes were correct the first time, up to 95% with inspections • Freedman and Weinberg 1990: team developed 5 programs and averaged 4. 5 errors per 100 lines; then 6 programs with inspection and averaged 0. 82 errors per 100 lines

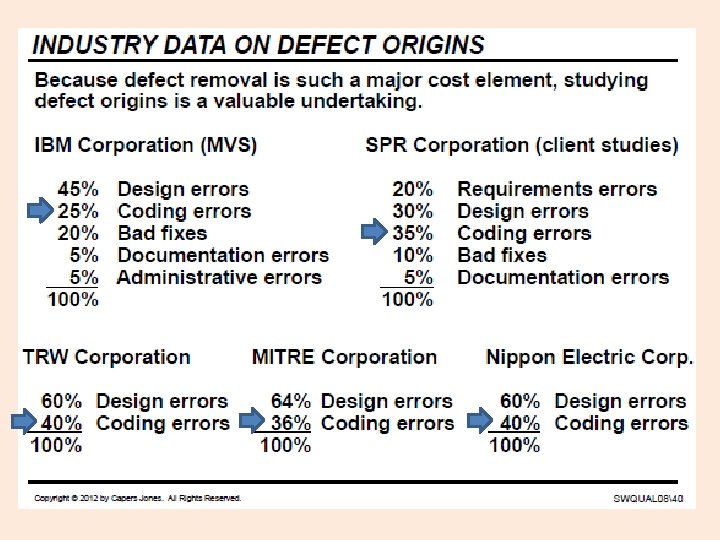
Capers Jones • Consultant • Founder/chairman of Software Productivity Research • President/CEO of Capers Jones & Associates • Collected data from 13, 500 projects at 675 corporations (150 Fortune 500) and 35 government/military agencies since 1984 • Author of multiple books and state-of-theindustry presentations
, pp. 94 -95, Apr 1996")
Data from C. Jones, “Software defect-removal efficiency”, Computer 29(4), pp. 94 -95, Apr 1996 Activity Informal design review Formal design inspections Informal code reviews Efficiency 25% - 40% 45% - 65% 20% - 35% Formal code inspections Unit test New function test Regression test Integration test System test Low-volume beta test (<10 clients) High-volume beta test (>1000 clients) 45% - 70% 15% - 50% 20% - 35% 15% - 30% 25% - 40% 25% - 55% 15% - 40% 60% - 85%
, pp. 94 -95, Apr 1996")
Data from C. Jones, “Software defect-removal efficiency”, Computer 29(4), pp. 94 -95, Apr 1996 Activity Informal design review Formal design inspections Informal code reviews Bugsinspections found by method Formal code Totaltest bugs found till 1 year post delivery Unit New function test Regression test Integration test System test Low-volume beta test (<10 clients) High-volume beta test (>1000 clients) Efficiency 25% - 40% 45% - 65% 20% - 35% 45% - 70% 15% - 50% 20% - 35% 15% - 30% 25% - 40% 25% - 55% 15% - 40% 60% - 85%
, pp. 94 -95, Apr 1996")
Data from C. Jones, “Software defect-removal efficiency”, Computer 29(4), pp. 94 -95, Apr 1996 Activity Informal design review Formal design inspections Informal code reviews Efficiency 25% - 40% 45% - 65% 20% - 35% Formal code inspections Unit test New function test Regression test Integration test System test Low-volume beta test (<10 clients) High-volume beta test (>1000 clients) 45% - 70% 15% - 50% 20% - 35% 15% - 30% 25% - 40% 25% - 55% 15% - 40% 60% - 85%
 No No")
When using combination of 4 methodologies: (QA=separate QA team; Testing=by trained specialists) No No Design inspection Code inspection no Testing no 30% - 50% 37% - 60% QA 32% - 55% 50% - 75% no Testing no 45% - 68% 65% - 87% QA 60% - 85% 77% - 95% no Testing no 43% - 66% 55% - 80% QA 53% - 78% 75% - 93% no Testing no 70% - 90% 85% - 99% QA 83% - 97% 95% - 100%

normal with inspections

Normalization • Big projects will have more bugs • Idea: use cost per defect – Measures how much each defect sets us back

Normalization • Big projects will have more bugs • Idea: use cost per defect – Measures how much each defect sets us back – Given projects of certain cost, the one with less defects (better) will have higher cost per defect! • Idea: use defects per Lo. C (defect density) – More defects per Loc imply sloppy workmanship

Normalization • Big projects will have more bugs • Idea: use cost per defect – Measures how much each defect sets us back – Given projects of certain cost, the one with less defects (better) will have higher cost per defect! • Idea: use defects per Lo. C (defect density) – More defects per Loc imply sloppy workmanship – But using higher abstraction level leads to less Lo. C and higher density – Also ignores defects in specification or design

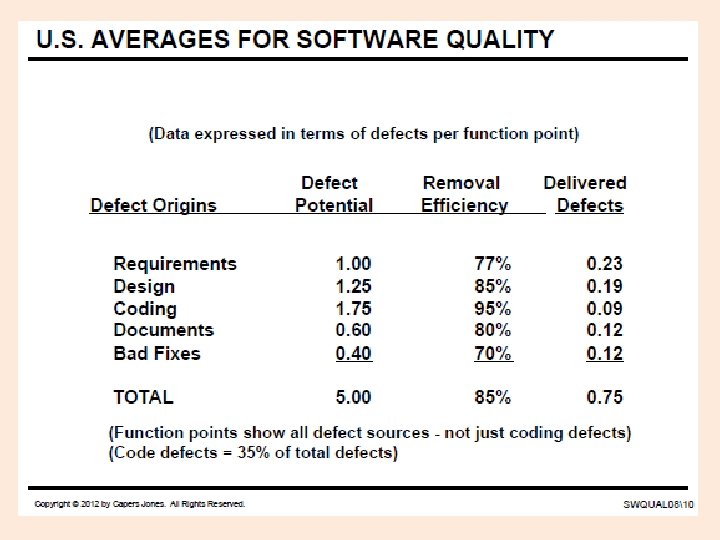
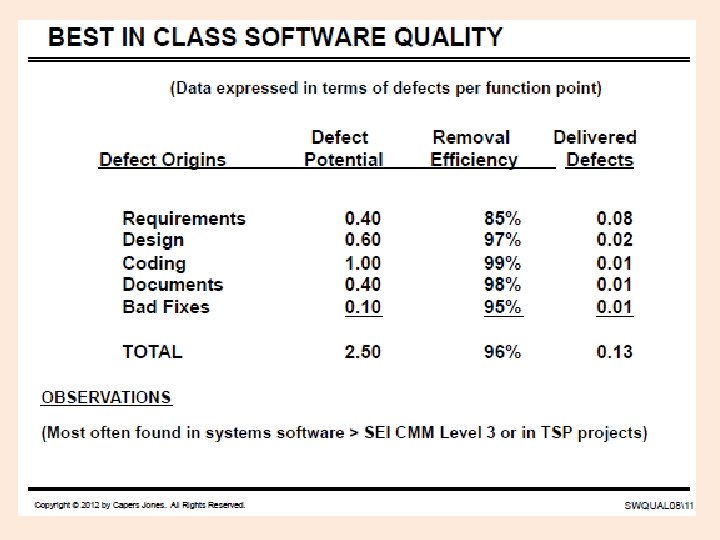
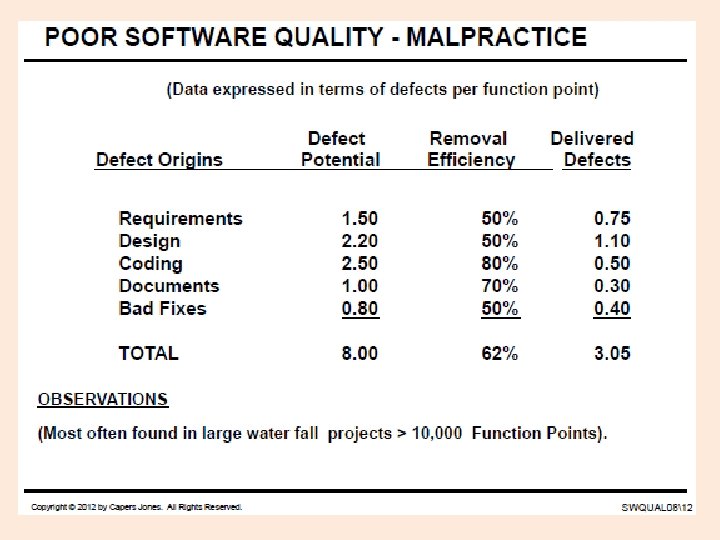
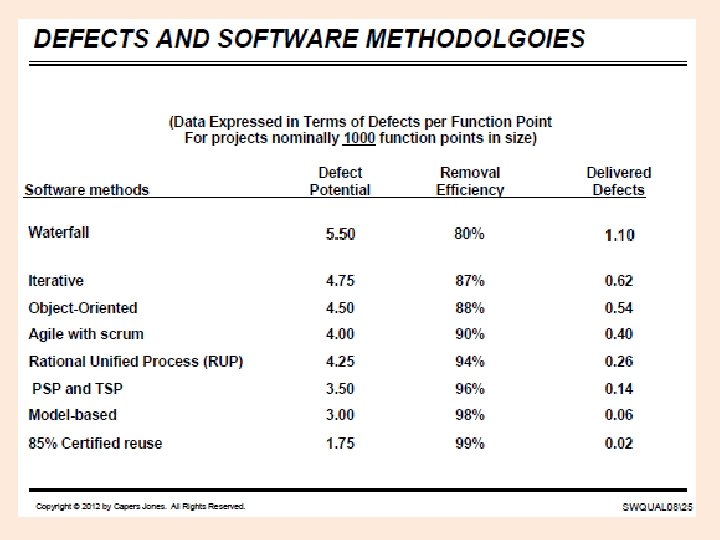
Normalization • Idea: use defects per function point • Function points are a measure of the functional content of the application • Defects per fp include all defect types – Requirements, specification, design, code, documentation • Oblivious to implementation strategy • “Defect potential” is empirical expected number of defects per fp
")
Comparison of methodologies (From interview with John Baker, 22. 12. 2010)
- Slides: 22