
DEALING WITH THE HETEROGENEITY OF CANCER Dana Peer

- Slides: 38
DEALING WITH THE HETEROGENEITY OF CANCER Dana Pe’er Department of Biological Sciences Center for Computational Biology and Bioinformatics
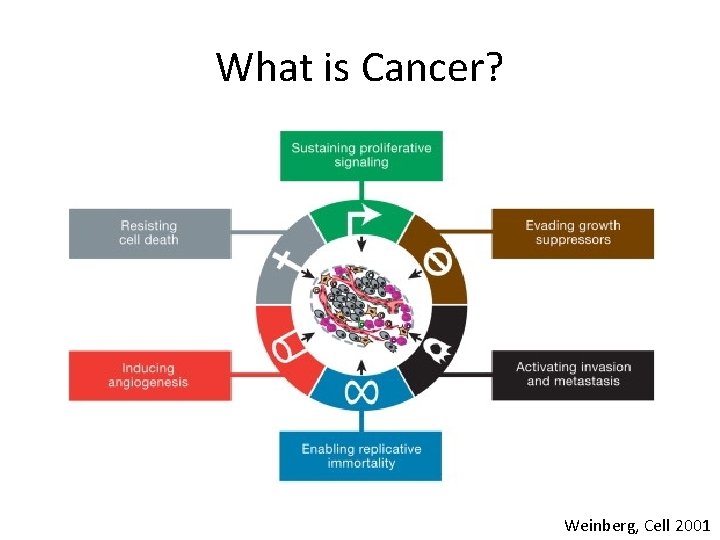
What is Cancer? Weinberg, Cell 2001
Why these phenotypes? • Cells only proliferate when they are told to do so. – Usually achieved by growth factors or cell-to-cell interaction. • Malignant cells proliferate independent of external signals
• Proliferation rate is controlled by external and internal signals. • Cells that interfere with their environment receive signals to die • Tumors evade these signals • A local tumor is almost always surgically removable. • Cancer is such a terrible disease because it metastasizes and affects other organs
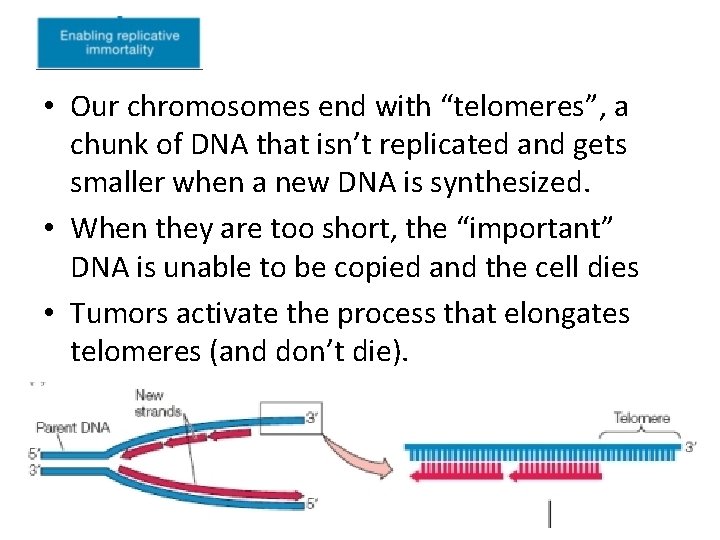
• Our chromosomes end with “telomeres”, a chunk of DNA that isn’t replicated and gets smaller when a new DNA is synthesized. • When they are too short, the “important” DNA is unable to be copied and the cell dies • Tumors activate the process that elongates telomeres (and don’t die).
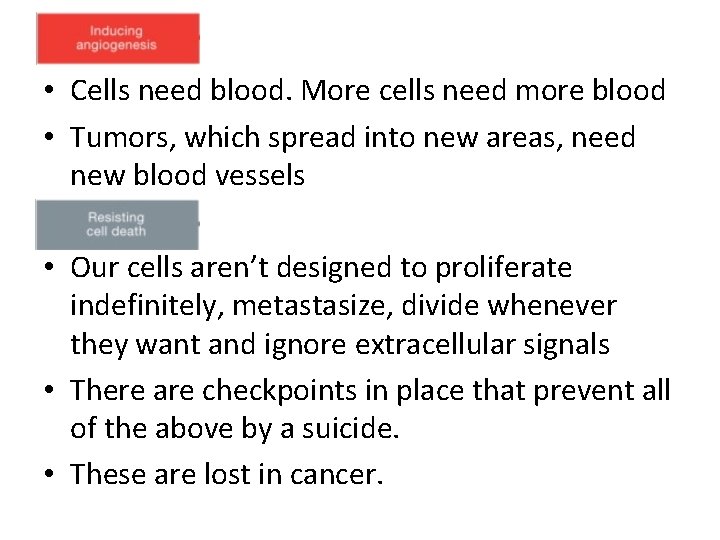
• Cells need blood. More cells need more blood • Tumors, which spread into new areas, need new blood vessels • Our cells aren’t designed to proliferate indefinitely, metastasize, divide whenever they want and ignore extracellular signals • There are checkpoints in place that prevent all of the above by a suicide. • These are lost in cancer.
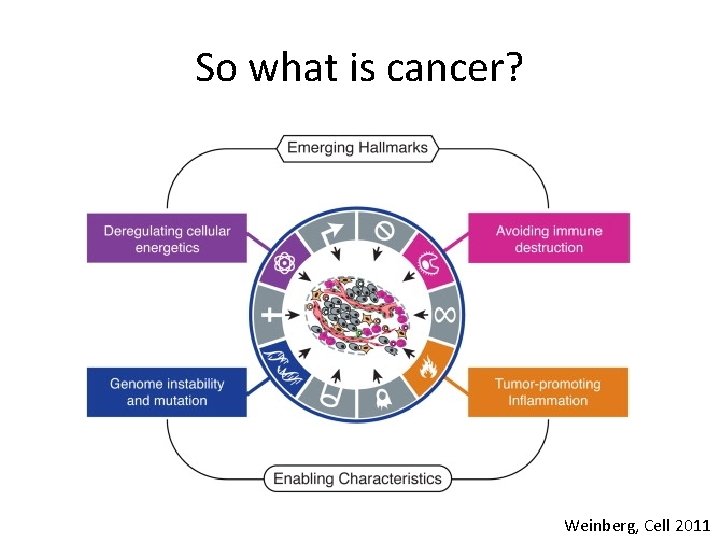
So what is cancer? Weinberg, Cell 2011
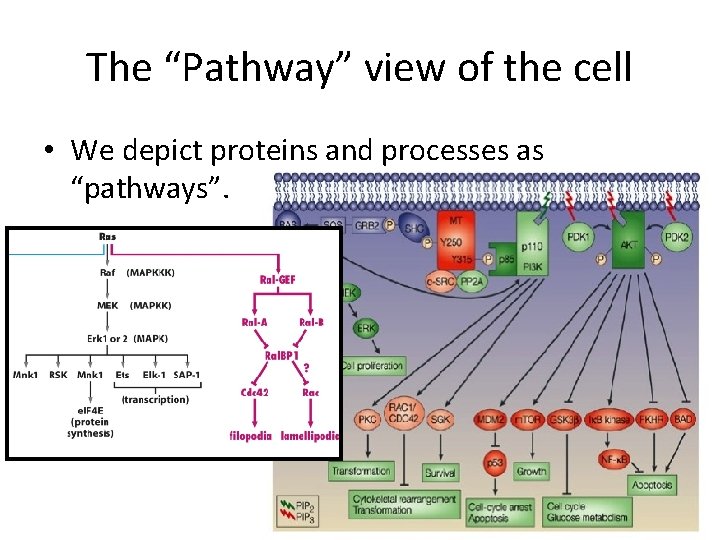
The “Pathway” view of the cell • We depict proteins and processes as “pathways”.
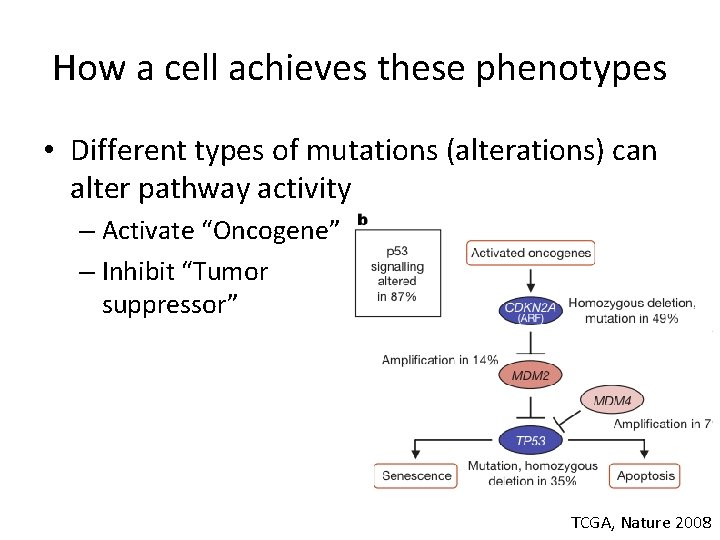
How a cell achieves these phenotypes • Different types of mutations (alterations) can alter pathway activity – Activate “Oncogene” – Inhibit “Tumor suppressor” TCGA, Nature 2008
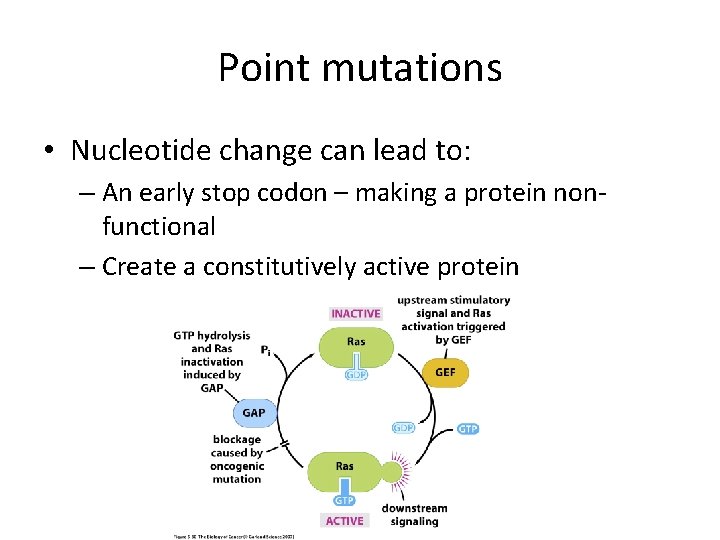
Point mutations • Nucleotide change can lead to: – An early stop codon – making a protein nonfunctional – Create a constitutively active protein
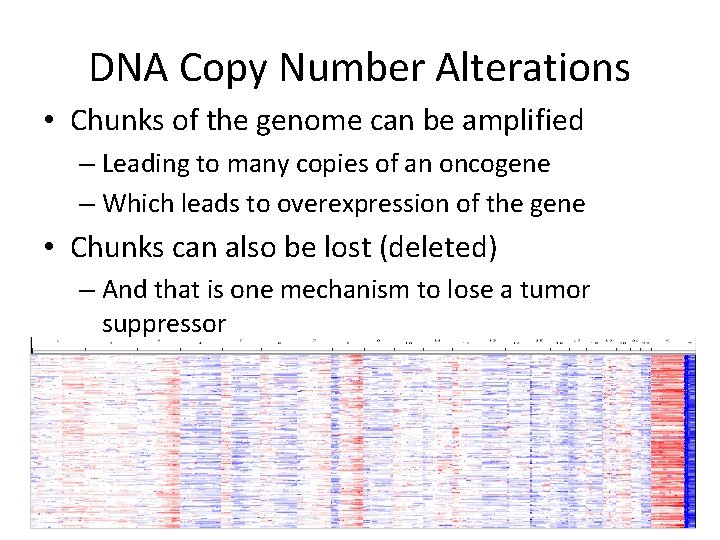
DNA Copy Number Alterations • Chunks of the genome can be amplified – Leading to many copies of an oncogene – Which leads to overexpression of the gene • Chunks can also be lost (deleted) – And that is one mechanism to lose a tumor suppressor
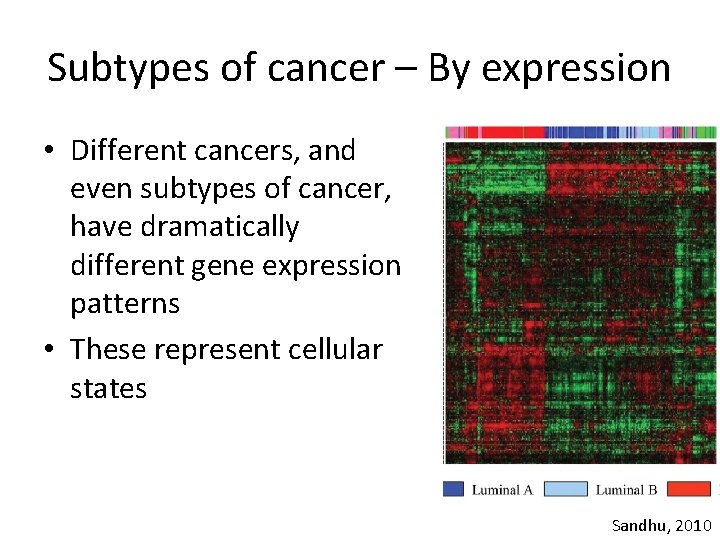
Subtypes of cancer – By expression • Different cancers, and even subtypes of cancer, have dramatically different gene expression patterns • These represent cellular states Sandhu, 2010
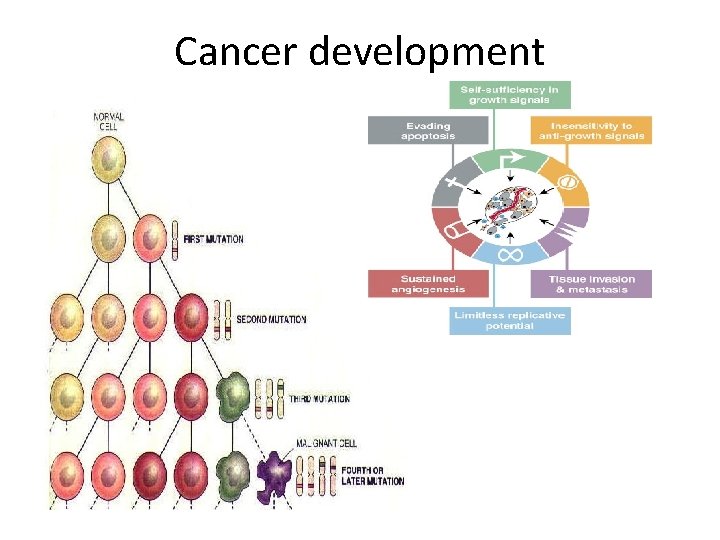
Cancer development
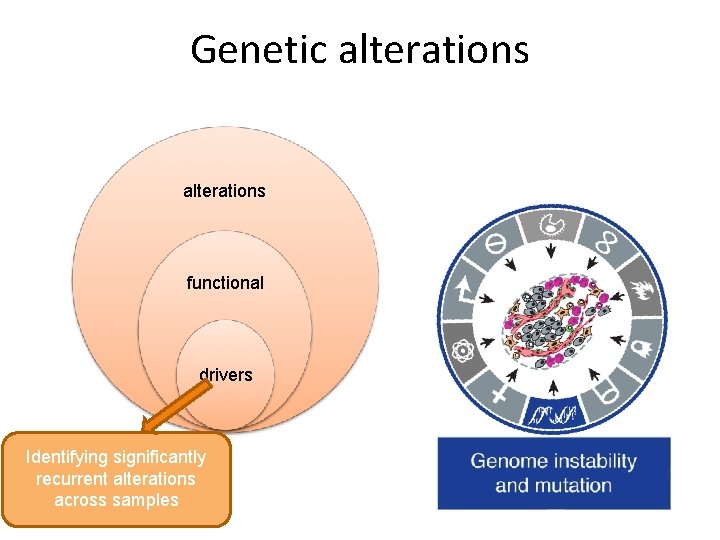
Genetic alterations functional drivers Identifying significantly recurrent alterations across samples
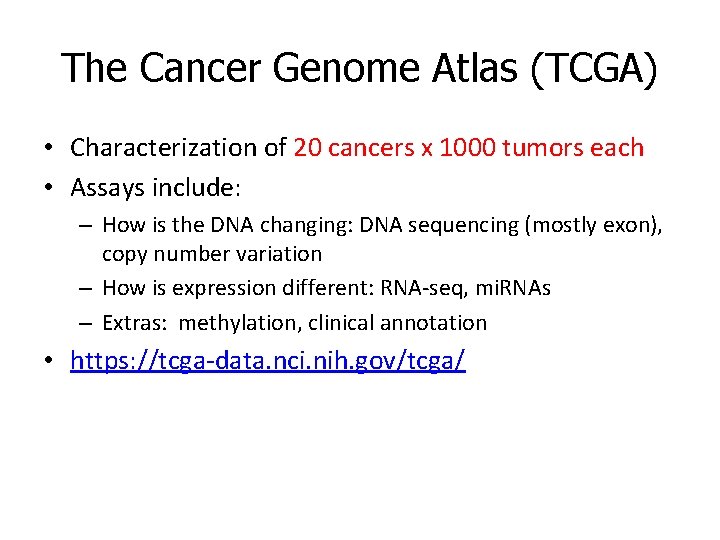
The Cancer Genome Atlas (TCGA) • Characterization of 20 cancers x 1000 tumors each • Assays include: – How is the DNA changing: DNA sequencing (mostly exon), copy number variation – How is expression different: RNA-seq, mi. RNAs – Extras: methylation, clinical annotation • https: //tcga-data. nci. nih. gov/tcga/
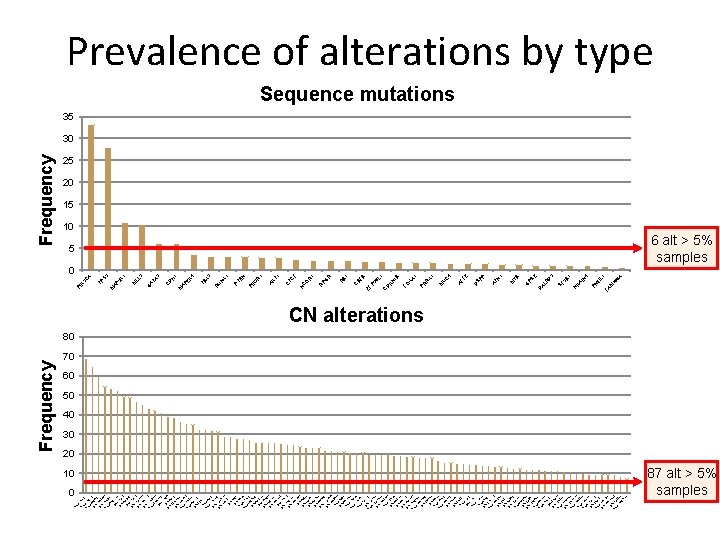
0 Am p. Am 1 q 3 p 2. Am -1 q 1 p- 21. 8 2 D q 24 el. 1 21 D 6 q 2 el 4. Am 16 q 3 p- 23 8 q. 1 2 D 1. 1 el 3 1 D 7 p el- 12 8 p D 23 el-. 2 D 17 el- p 1 1 2 D 7 p 1 el 3. 1 3 D 6 q 1 el 1. Am 11 q 2 p- 23 20. 3 q D 13 el-. 2 11 D q 25 D elel- 8 p 22 12 D q 13 el. 3 Am 13 q 1 p- 14. Am 17 q 2 p- 23. 8 1 D p 11 el. 22 21 q Am 11. Am p- 1 8 p- p 1 1 2 D 1 q 1 el 3. D 1 p 3 2 el 6 13. 13 q 1 2 D. 11 el 6 D q 27 e Am l-6 q 1 Am p-1 5 p- 7 q 1 3 q 2 D 26. el- 32 9 p D 21 el-. 3 D 18 el- q 2 3 3 D p 21 el. 15 31 q D 13 el-. 2 D el- 17 q 17 12 D q 21 el. 15 31 q 1 D 5. 3 el. D 9 p el- 23 3 D p 14 el. 4 1 D p 16 el. 3 D 4 q 3 el 5. 1 2 D 1 p 1 el 5 14. 5 q Am 24 p-. 3 6 D el- p 23 5 Am q 1 3. Am p-1 3 p- 0 p 1 1 4 Am 1 q 1 p- 4. 1 7 D p 11 e. Am l-1 2 p- p 13 12. 3 D p 13 el. 10 33 Am q 2 p- 6. 3 1 D 2 q el- 15 5 D q 21 el. 3 D 5 q 1 el 1. D 19 p 2 el 13 1 Am 0 q. 3 p- 23 19. 31 q D 13. el- 42 2 q 3 D 7. 3 el. Am 9 q 1 Am p-1 3 p- 9 q 1 14 2 D q 13 el. 7 q 2 3 D el- 6. 1 2 q Am 22 p-. 1 D 1 p 1 el 2 Am 11 q p- 11 1 Am 1 p 1 3 D p-6 el- q 2 Am 21 q 1 p- 11 15. 2 D q 26 el. 2 3 D q 21 el. 1 D 6 p 2 el 5. 1 2 Am 2 p 1 p- 3. 1 3 D p 24 e. D l-2 p 3 el 2 12 5. 1 Am q 24 p. 3 Am -4 q 1 p- 13. 16 3 q D 12 el-. 1 D 20 el- p 1 Am 12 q 3 p- 23. D 13 q 1 el 33 1. Am 2 q 1 3 p- 3. 1 10 3 Am q 2 p 2. Am -1 p 3 p- 31. 1 3 D 7 p 1 el 1. Am 20 p 2 p- 12. D 13 q 1 el 1 19 2. 3 q D 13. Am el-7 32 p- p 22 10. q 2 3 6. 13 Frequency 1 6 A 16 IL W M PI FA IN 4 1 3 D 2 3 B KA N SF R PS G M YB 1 P AT N SP D AL D 4 C U X 1 AF F 2 M 1 XA R PR FO 1 B 1 6 L KN D C ZF P 3 B B 1 R BF C R 1 F R PG R O TC C T 1 R 1 AK C N X 1 3 EN PI K 3 PT N U R TB X 4 2 K 1 H D M AP C A 3 3 1 LL AT G M 3 K M AP 3 A TP 5 C K 3 PI Frequency Prevalence of alterations by type Sequence mutations 35 30 25 20 15 10 5 0 6 alt > 5% samples CN alterations 80 70 60 50 40 30 20 10 87 alt > 5% samples
Distinguishing drivers from passengers What Aberrations Make a Cell Go Bad?
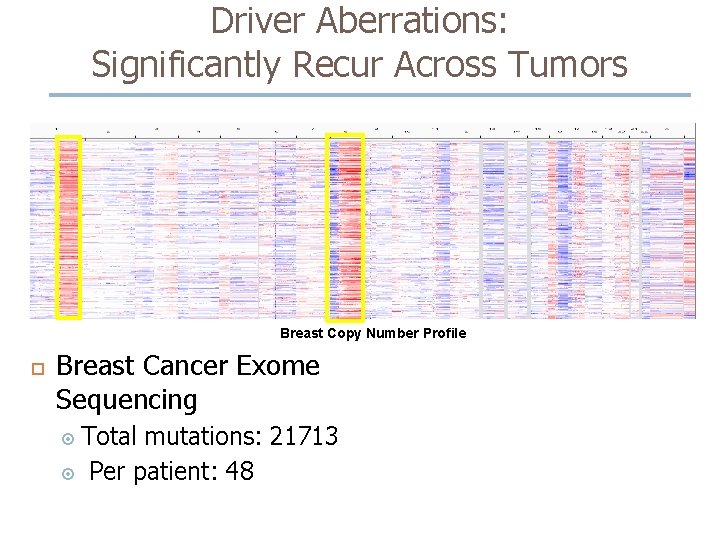
Driver Aberrations: Significantly Recur Across Tumors Breast Copy Number Profile Breast Cancer Exome Sequencing Total mutations: 21713 Per patient: 48
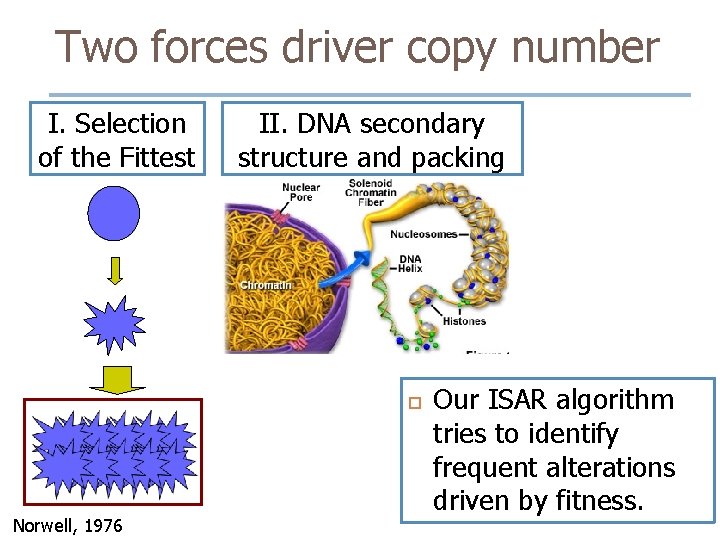
Two forces driver copy number I. Selection of the Fittest II. DNA secondary structure and packing Norwell, 1976 Our ISAR algorithm tries to identify frequent alterations driven by fitness.
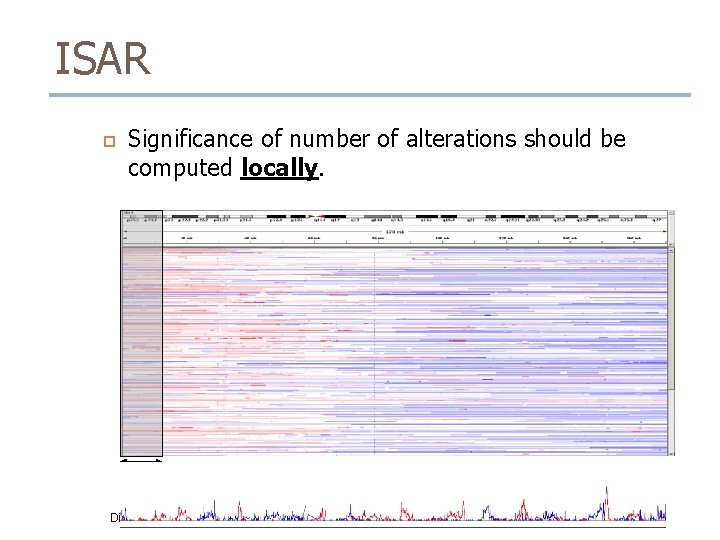
ISAR Significance of number of alterations should be computed locally. ~8 Mbp P-value Distribution
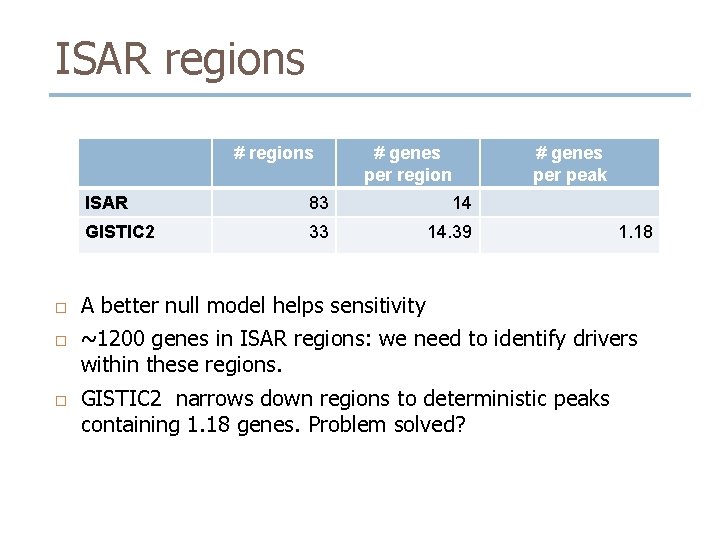
ISAR regions # regions # genes per region # genes per peak ISAR 83 14 GISTIC 2 33 14. 39 1. 18 A better null model helps sensitivity ~1200 genes in ISAR regions: we need to identify drivers within these regions. GISTIC 2 narrows down regions to deterministic peaks containing 1. 18 genes. Problem solved?
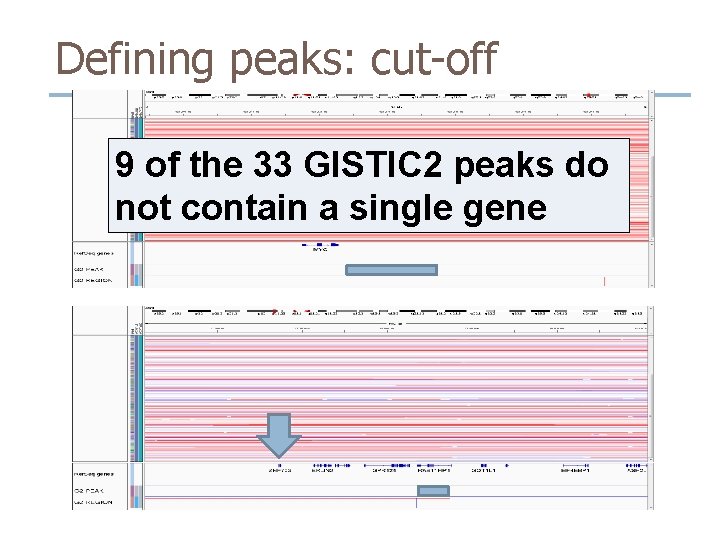
Defining peaks: cut-off 9 of the 33 GISTIC 2 peaks do not contain a single gene
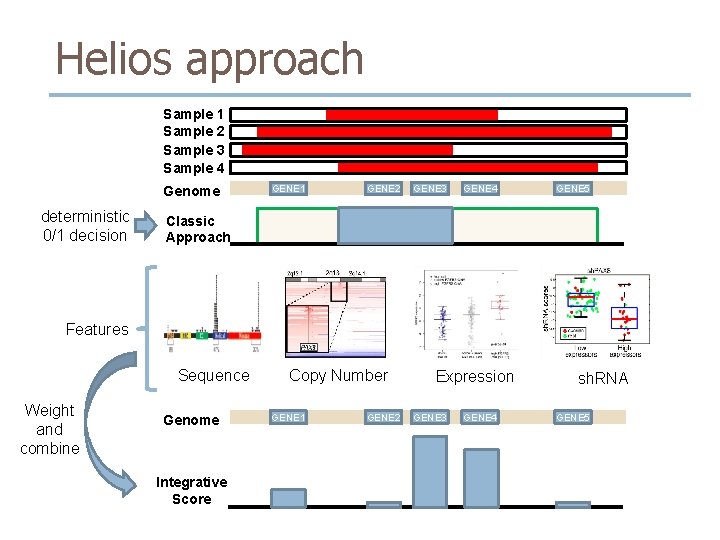
Helios approach Sample 1 Sample 2 Sample 3 Sample 4 Genome deterministic 0/1 decision GENE 1 GENE 2 GENE 3 GENE 4 GENE 5 Classic Approach Features Sequence Weight and combine Genome Integrative Score Copy Number GENE 1 GENE 2 Expression GENE 3 GENE 4 sh. RNA GENE 5
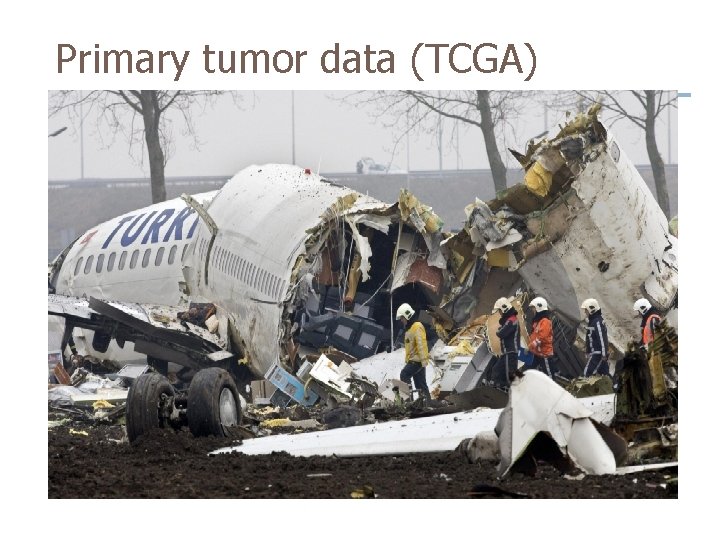
Primary tumor data (TCGA)
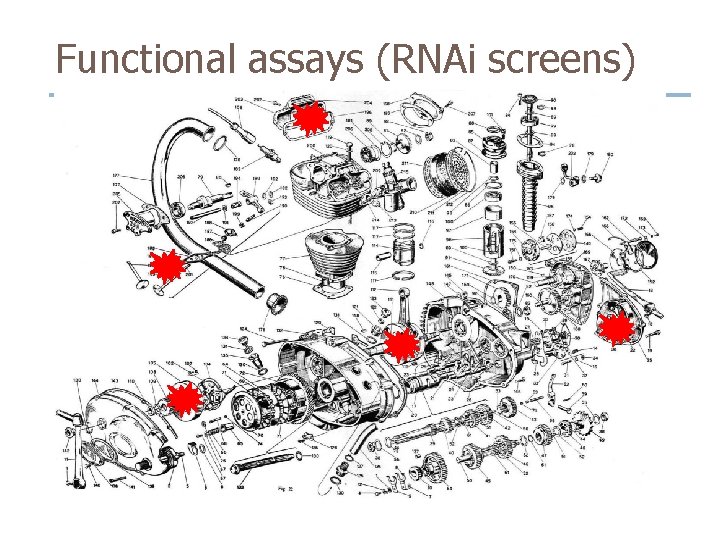
Functional assays (RNAi screens)
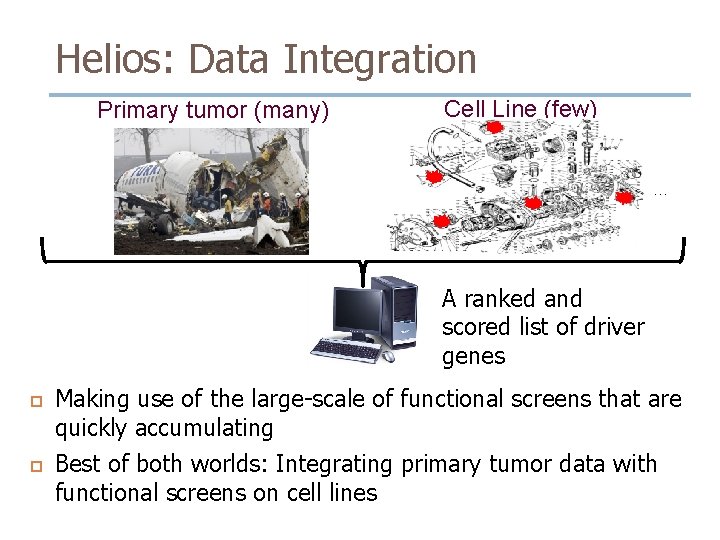
Helios: Data Integration Primary tumor (many) Cell Line (few) … A ranked and scored list of driver genes Making use of the large-scale of functional screens that are quickly accumulating Best of both worlds: Integrating primary tumor data with functional screens on cell lines
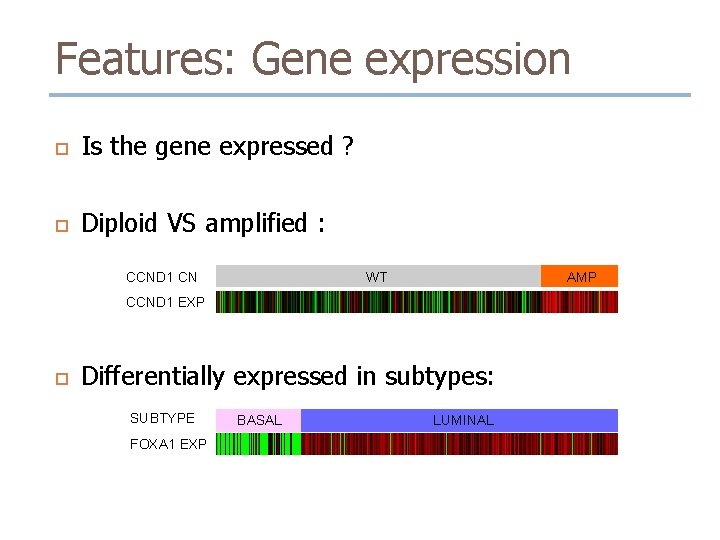
Features: Gene expression Is the gene expressed ? Diploid VS amplified : CCND 1 CN AMP WT CCND 1 EXP Differentially expressed in subtypes: SUBTYPE FOXA 1 EXP BASAL LUMINAL
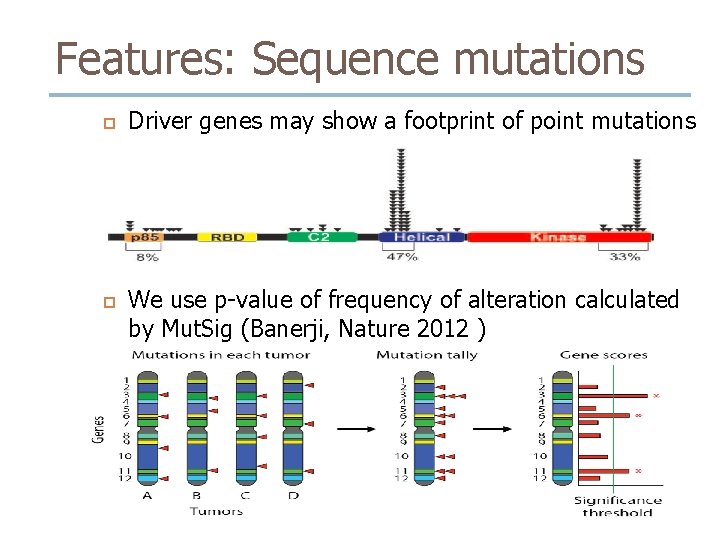
Features: Sequence mutations Driver genes may show a footprint of point mutations We use p-value of frequency of alteration calculated by Mut. Sig (Banerji, Nature 2012 )
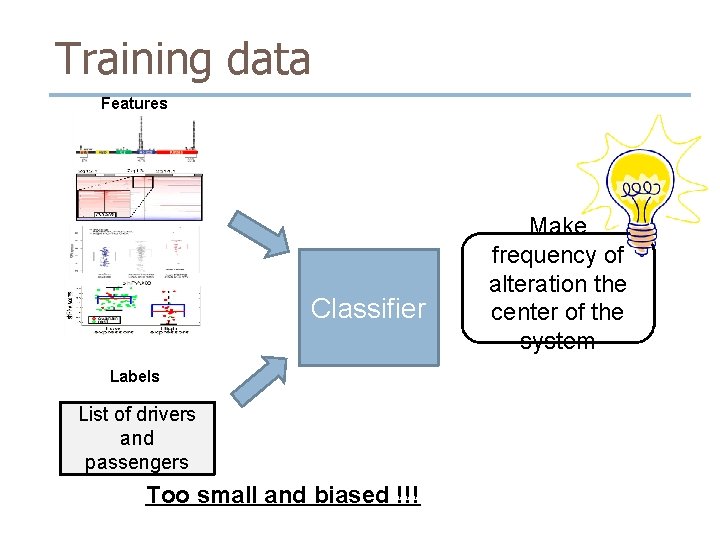
Training data Features Classifier Labels List of drivers and passengers Too small and biased !!! Make frequency of alteration the center of the system
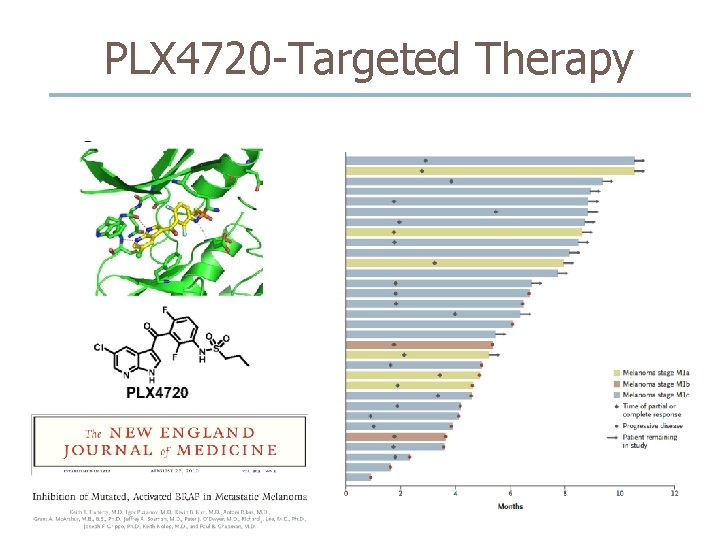
PLX 4720 -Targeted Therapy
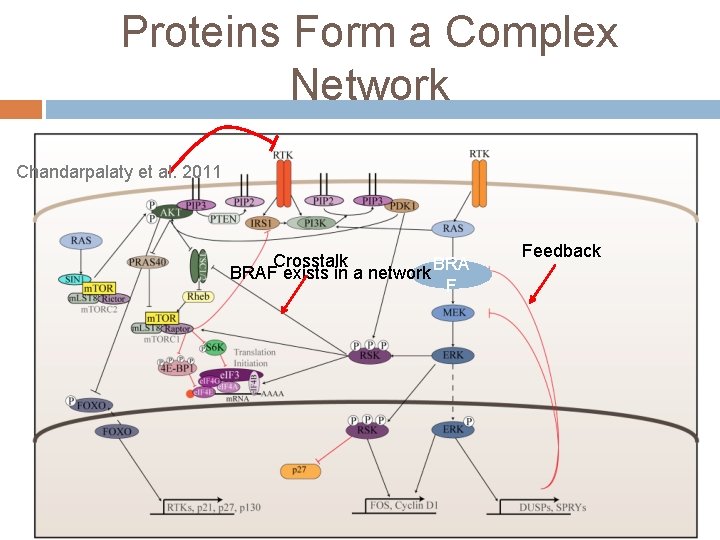
Proteins Form a Complex Network Chandarpalaty et al. 2011 Crosstalk BRAF exists in a network BRA F Feedback
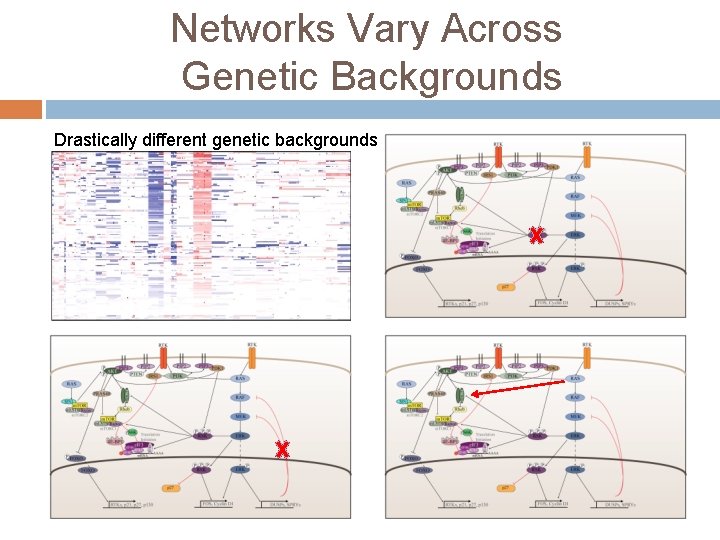
Networks Vary Across Genetic Backgrounds Drastically different genetic backgrounds
Our Aims Identify genetic determinants and master regulators of drug resistance Predict additional target pathways for combinatorial drug treatment.
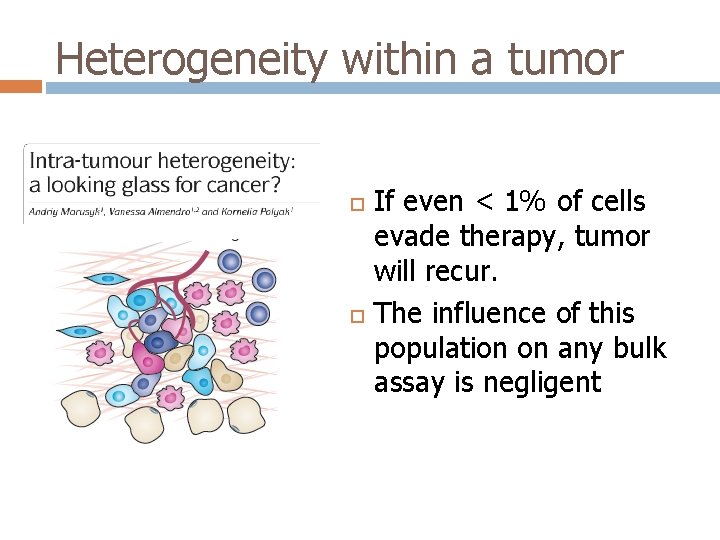
Heterogeneity within a tumor If even < 1% of cells evade therapy, tumor will recur. The influence of this population on any bulk assay is negligent
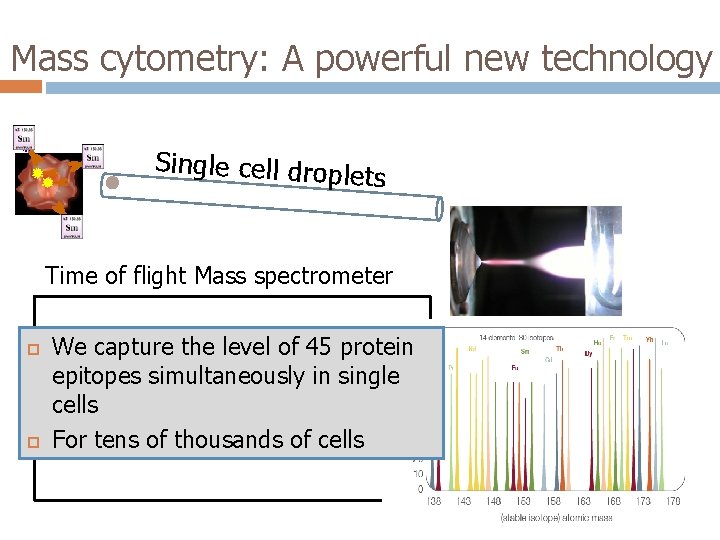
Mass cytometry: A powerful new technology Single cell drople ts Time of flight Mass spectrometer We capture the level of 45 protein epitopes simultaneously in single cells For tens of thousands of cells
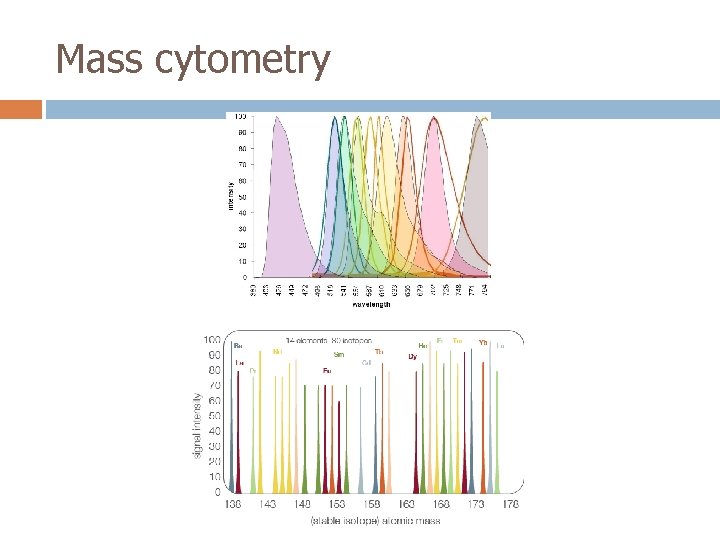
Mass cytometry
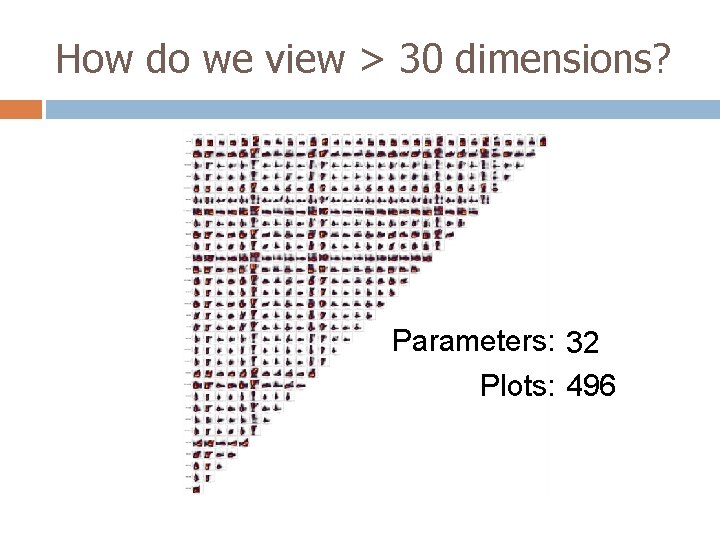
How do we view > 30 dimensions? Parameters: 32 14 8 4 Plots: 91 28 6 496
Acknowledgements Felix Sanchez-Garcia Dylan Kotliar Uri David Akavia Jose Silva (CUMC) Junji Matsui Bo-Juen Chen El-ad David Amir Jacob Levine Smita Krishnaswamy Daniel Shenfeld Michelle Tadmor Garry Nolan (Stanford) Sean Bendall Erin Simonds Kara Davis