DDM Trouble shooting Tutorial How to find when

DDM Trouble shooting Tutorial How to find when things are right and wrong Hironori Ito Brookhaven National Laboratory
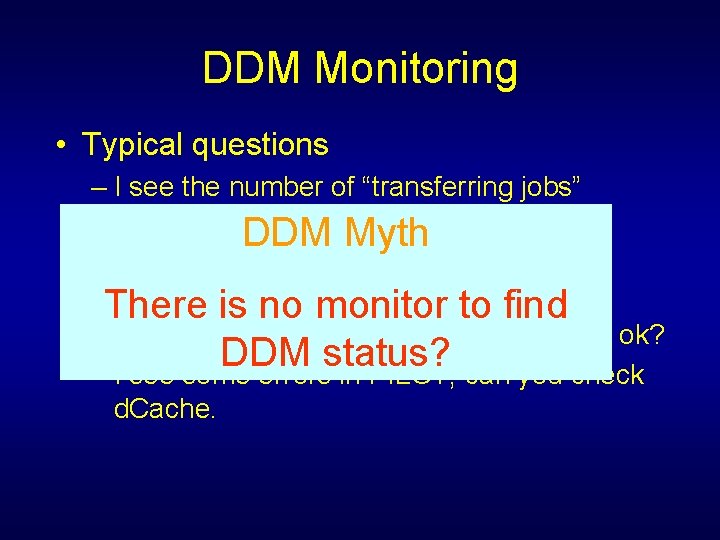
DDM Monitoring • Typical questions – I see the number of “transferring jobs” increasing, what is wrong? DDM Myth – I see the number of “assigned jobs” increasing, what is wrong? There is no monitor to find – I smell something wrong. Is BNL Cache ok? DDM status? – I see some errors in PILOT, can you check d. Cache.
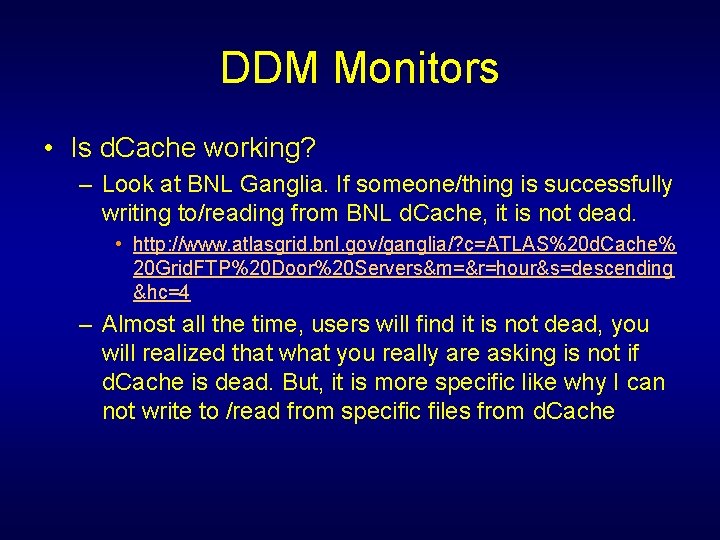
DDM Monitors • Is d. Cache working? – Look at BNL Ganglia. If someone/thing is successfully writing to/reading from BNL d. Cache, it is not dead. • http: //www. atlasgrid. bnl. gov/ganglia/? c=ATLAS%20 d. Cache% 20 Grid. FTP%20 Door%20 Servers&m=&r=hour&s=descending &hc=4 – Almost all the time, users will find it is not dead, you will realized that what you really are asking is not if d. Cache is dead. But, it is more specific like why I can not write to /read from specific files from d. Cache
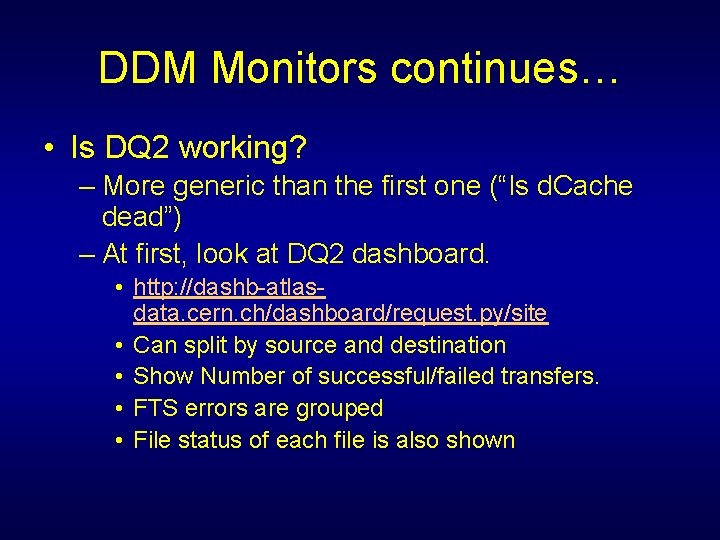
DDM Monitors continues… • Is DQ 2 working? – More generic than the first one (“Is d. Cache dead”) – At first, look at DQ 2 dashboard. • http: //dashb-atlasdata. cern. ch/dashboard/request. py/site • Can split by source and destination • Show Number of successful/failed transfers. • FTS errors are grouped • File status of each file is also shown
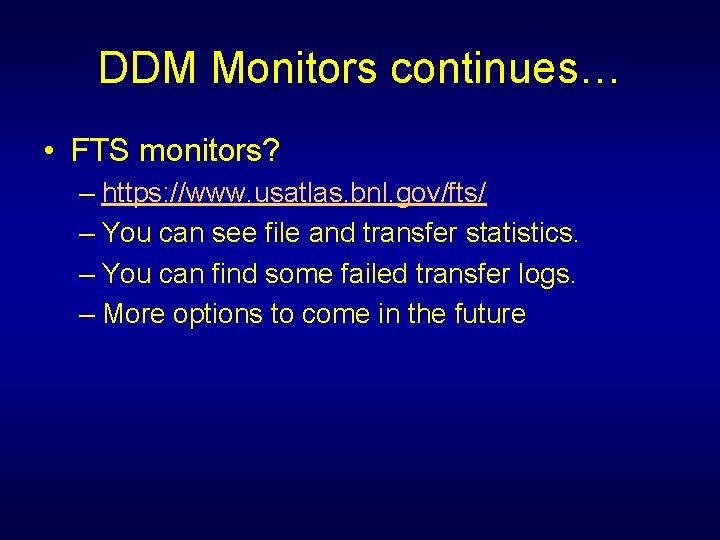
DDM Monitors continues… • FTS monitors? – https: //www. usatlas. bnl. gov/fts/ – You can see file and transfer statistics. – You can find some failed transfer logs. – More options to come in the future

DDM Monitors continues… • Are you sure if my DQ 2 site service is working – – – http: //www. usatlas. bnl. gov/dq 2/monitor/dq 2 Pings http: //www. usatlas. bnl. gov/dq 2/monitor/index One dataset is subscribed to a site every hour. Red means no files, Green is good. Click to find more info about missing files. More features are added
DDM Monitors continues… • Ok, everything said, they are fine. But, I want to make sure. I wan to see some meter or gague. – If you can not believe anything else, look at the Netflow pages. • http: //netmon. usatlas. bnl. gov/netflow/tier 2. html • http: //netmon. usatlas. bnl. gov/netflow/tier 2 -hour. html • http: //netmon. usatlas. bnl. gov/netflow/tier 2 -minute. html – It shows the network traffic between BNL and T 2 s (also other T 1 s in the separate pages. )
Conclusion • Myth has been un-mystified. – There a lot of monitors to use for DDM problems from SEs, FTS and DQ 2 services. More will be added. And, if you need something specific, just ask to make exactly what you want. • No more generic questions. – Generic questions only give you generic answers. • “Is d. Cache ok” -> Yes, of course it is ok. How useful is this conversation? – Check the monitors at first. You actually do know more about your problems than other people because of the fact that you noticed the problem. And, if you get to some problems you don’t know, ask specific problems with detailed information. • DDM monitor shows the FTS errors, myproxy not found. • FTS failed transfer log shows “transfer timeout” for a file srm: //abc
- Slides: 8