
DCB Long Term Outcomes Are the Results Durable

DCB Long Term Outcomes Are the Results Durable? Kenneth Rosenfield, MD, MHCDS, MSCAI
Kenneth Rosenfield, MD • Consultant – Abbott Vascular – Access Vascular – Amgen – Capture Vascular – Cardinal Health – CRUZAR Systems – Endospan – Inspire. MD – MD Insider – Micell – Shockwave – Silk Road – Surmodics – Valcare • • Financial Disclosures Equity • Research or Fellowship Support – Access Vascular – NIH – Contego – Atrium – Embolitech – Intact Vascular – EXIMO – MDInsider – Janacare – PQ Bypass – Primacea – Vortex Board Member – VIVA Physicians (Not For Profit 501(c) 3 Organization) • www. vivapvd. com
Goals/Value of DCB Therapy • Achieve satisfactory initial result and reduce restenosis/prolong vessel patency by eliminating cellular proliferation • Reduce need for additional therapeutic intervention, including stents • Provide more cost-effective therapy and value

Peripheral Drug-Coated Balloons IN. PACT Admiral Medtronic Lutonix. TM Bard Stellarex™ Spectranetics Ranger™ Boston Scientific 3 µg/mm 2 2 μg/mm 2 2 µg/mm 2 Free. Pac™ hydrophilic coating (excipient: urea) Proprietary hydrophilic nonpolymeric carrier Endura. Coat™ coating (excipient: Poly-ethylene Glycol) Trans. Pax coating (excipient: Citrate ester) 0. 035 OTW 0. 14/0. 18 SFA: 4 -7 mm; 40 -120 mm BTK: Recalled SFA: 4 -6 mm; 40 -100 mm SFA: 4 -6 mm; 40 -120 mm SFA: 4 -8 mm; 30 -200 mm BTK: 2 -4 mm; up to 150 mm CE Mark FDA Approval Product Image Paclitaxel Dose Coating Technology Guidewire Compatibility Matrix
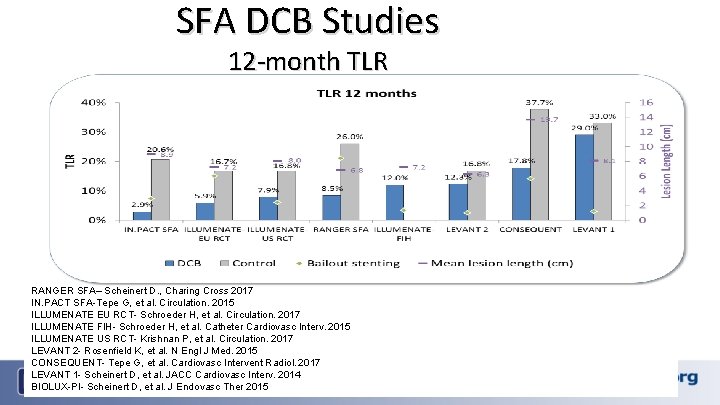
SFA DCB Studies 12 -month TLR RANGER SFA– Scheinert D. , Charing Cross 2017 IN. PACT SFA-Tepe G, et al. Circulation. 2015 ILLUMENATE EU RCT- Schroeder H, et al. Circulation. 2017 ILLUMENATE FIH- Schroeder H, et al. Catheter Cardiovasc Interv. 2015 ILLUMENATE US RCT- Krishnan P, et al. Circulation. 2017 LEVANT 2 - Rosenfield K, et al. N Engl J Med. 2015 CONSEQUENT- Tepe G, et al. Cardiovasc Intervent Radiol. 2017 LEVANT 1 - Scheinert D, et al. JACC Cardiovasc Interv. 2014 BIOLUX-PI- Scheinert D, et al. J Endovasc Ther 2015

IN. PACT SFA Trial Primary Patency Through 3 Years 2 Difference in CD-TLR between DCB/PTA at 3 Years Was 15. 9% Schneider. VIVA.
IN. PACT SFA Trial Freedom from CD-TLR through 4 Years 1 Schneider. VIVA.
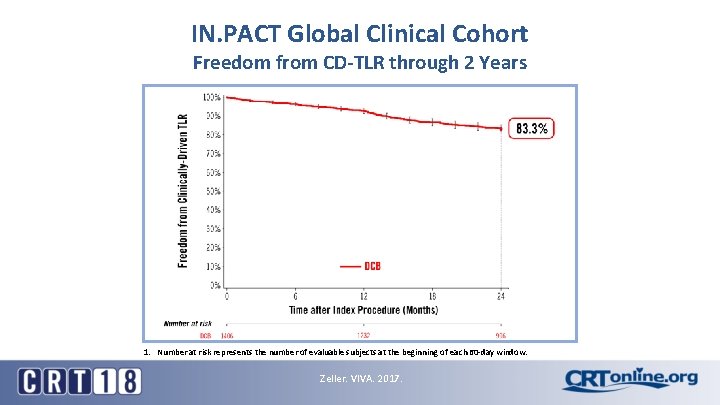
IN. PACT Global Clinical Cohort Freedom from CD-TLR through 2 Years 1. Number at risk represents the number of evaluable subjects at the beginning of each 60 -day window. Zeller. VIVA. 2017.
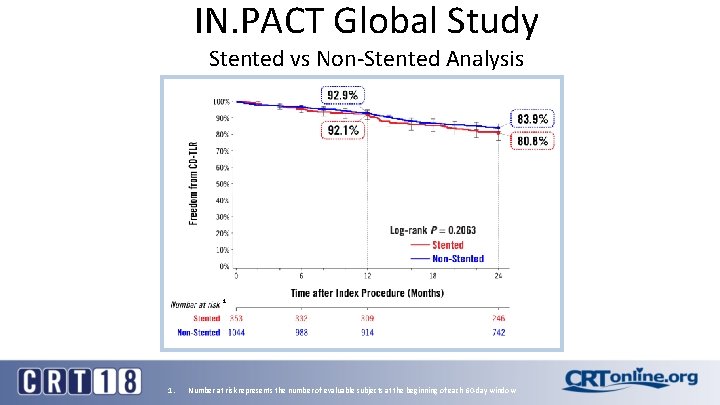
IN. PACT Global Study Stented vs Non-Stented Analysis Freedom from CD-TLR Through 2 Years 1 1. Number at risk represents the number of evaluable subjects at the beginning of each 60 -day window
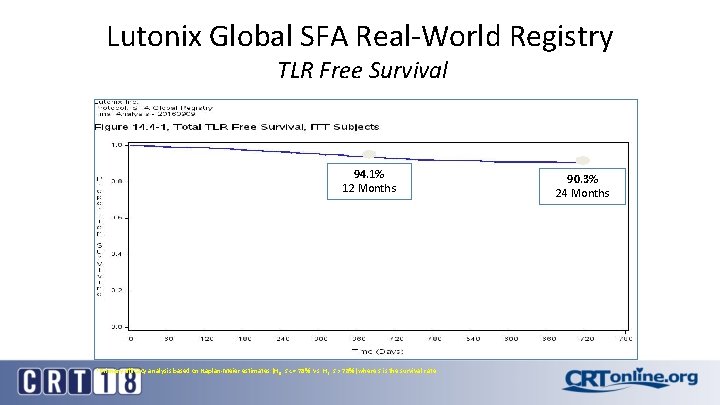
Lutonix Global SFA Real-World Registry TLR Free Survival 94. 1% 12 Months 1 Primary efficacy analysis based on Kaplan-Meier estimates (H 0: s <= 78% vs H 1: s > 78%) where s is the survival rate 90. 3% 24 Months
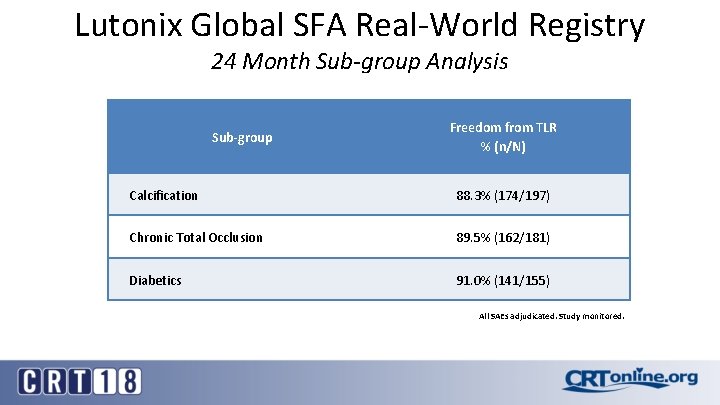
Lutonix Global SFA Real-World Registry 24 Month Sub-group Analysis Sub-group Freedom from TLR % (n/N) Calcification 88. 3% (174/197) Chronic Total Occlusion 89. 5% (162/181) Diabetics 91. 0% (141/155) All SAEs adjudicated. Study monitored.
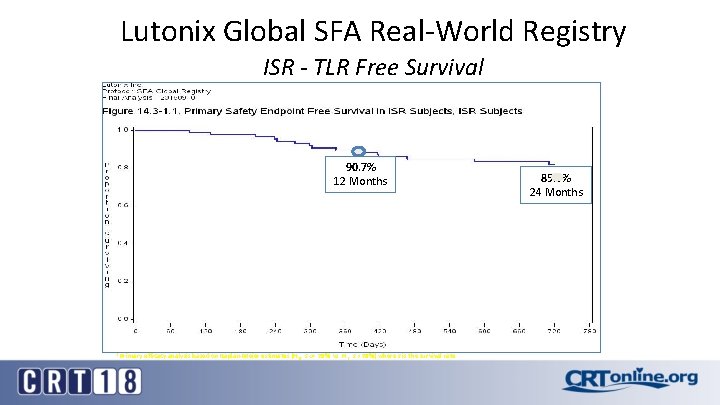
Lutonix Global SFA Real-World Registry ISR - TLR Free Survival 90. 7% 12 Months 1 Primary efficacy analysis based on Kaplan-Meier estimates (H 0: s <= 78% vs H 1: s > 78%) where s is the survival rate 85. 5% 24 Months

Lutonix Global SFA Real-World Registry Long Lesion - TLR Free Survival 93. 4% 12 Months 1 Primary efficacy analysis based on Kaplan-Meier estimates (H 0: s <= 78% vs H 1: s > 78%) where s is the survival rate 89. 4% 24 Months
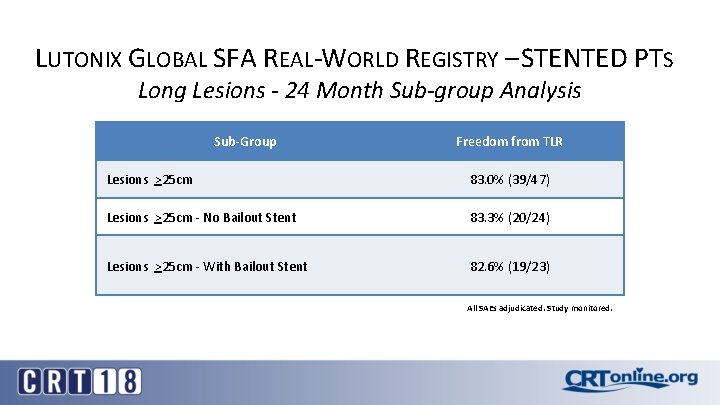
LUTONIX GLOBAL SFA REAL-WORLD REGISTRY – STENTED PTS Long Lesions - 24 Month Sub-group Analysis Sub-Group Freedom from TLR Lesions >25 cm 83. 0% (39/47) Lesions >25 cm - No Bailout Stent 83. 3% (20/24) Lesions >25 cm - With Bailout Stent 82. 6% (19/23) All SAEs adjudicated. Study monitored.
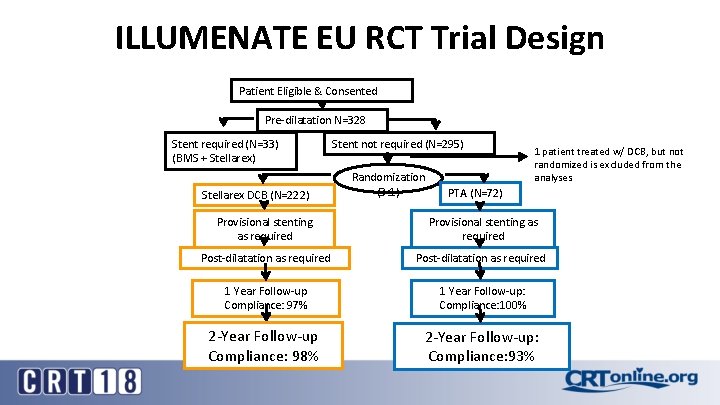
ILLUMENATE EU RCT Trial Design Patient Eligible & Consented Pre-dilatation N=328 Stent required (N=33) (BMS + Stellarex) Stellarex DCB (N=222) Stent not required (N=295) Randomization (3: 1) 1 patient treated w/ DCB, but not randomized is excluded from the analyses PTA (N=72) Provisional stenting as required Post-dilatation as required 1 Year Follow-up Compliance: 97% 1 Year Follow-up: Compliance: 100% 2 -Year Follow-up Compliance: 98% 2 -Year Follow-up: Compliance: 93%
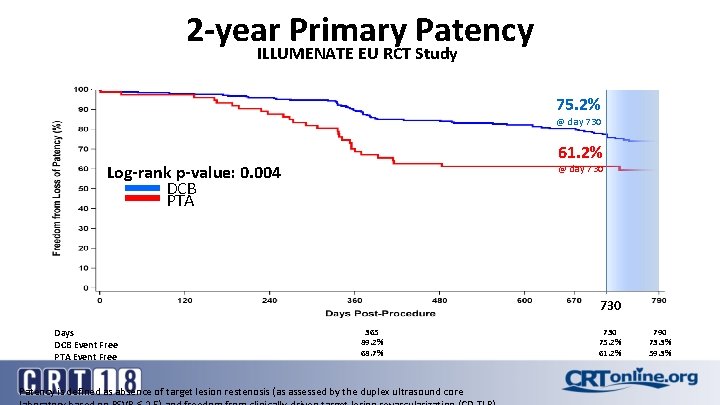
2 -year Primary Patency ILLUMENATE EU RCT Study 75. 2% @ day 730 61. 2% Log-rank p-value: 0. 004 DCB PTA @ day 730 Days DCB Event Free PTA Event Free 365 89. 2% 68. 7% Patency is defined as absence of target lesion restenosis (as assessed by the duplex ultrasound core 730 75. 2% 61. 2% 790 73. 3% 59. 3%
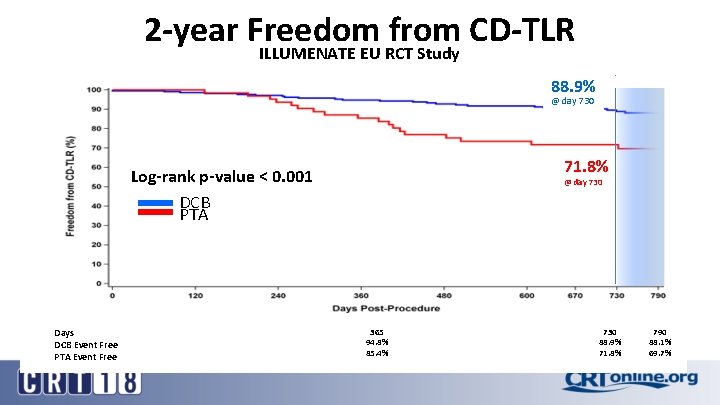
2 -year Freedom from CD-TLR ILLUMENATE EU RCT Study 88. 9% @ day 730 71. 8% Log-rank p-value < 0. 001 DCB PTA Days DCB Event Free PTA Event Free @ day 730 365 94. 8% 85. 4% 730 88. 9% 71. 8% 790 88. 1% 69. 7%
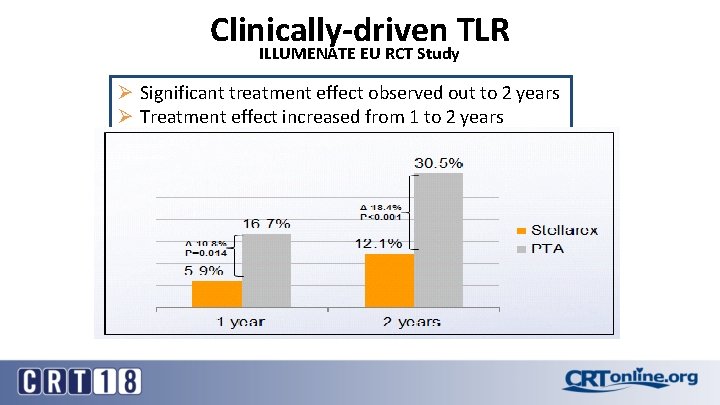
Clinically-driven TLR ILLUMENATE EU RCT Study Ø Significant treatment effect observed out to 2 years Ø Treatment effect increased from 1 to 2 years
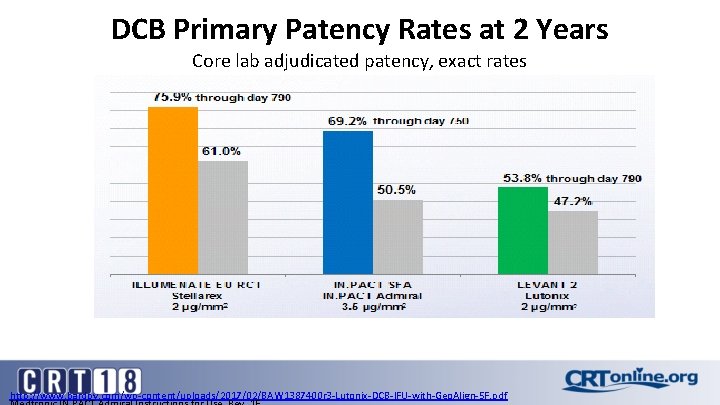
DCB Primary Patency Rates at 2 Years Core lab adjudicated patency, exact rates http: //www. bardpv. com/wp-content/uploads/2017/02/BAW 1387400 r 3 -Lutonix-DCB-IFU-with-Geo. Align-5 F. pdf
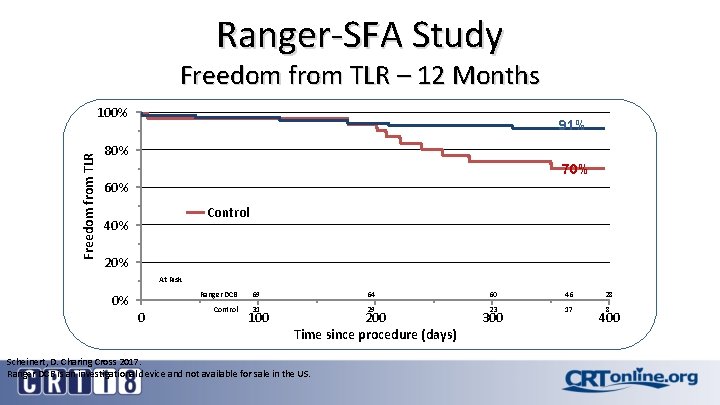
Ranger-SFA Study Freedom from TLR – 12 Months Freedom from TLR 100% 91% 80% 70% 60% Control 40% 20% At Risk Ranger DCB 0% 0 Control 69 31 100 64 60 46 28 29 300 23 17 400 200 Time since procedure (days) Scheinert, D. Charing Cross 2017. Ranger DCB is an investigational device and not available for sale in the US. 8
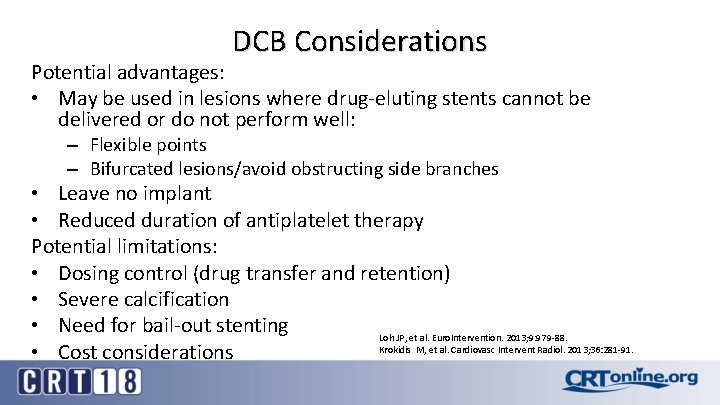
DCB Considerations Potential advantages: • May be used in lesions where drug-eluting stents cannot be delivered or do not perform well: – Flexible points – Bifurcated lesions/avoid obstructing side branches • Leave no implant • Reduced duration of antiplatelet therapy Potential limitations: • Dosing control (drug transfer and retention) • Severe calcification • Need for bail-out stenting Loh JP, et al. Euro. Intervention. 2013; 9: 979 -88. Krokidis M, et al. Cardiovasc Intervent Radiol. 2013; 36: 281 -91. • Cost considerations
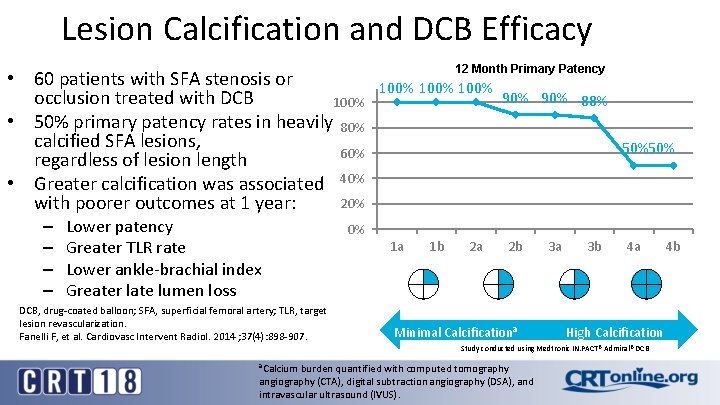
Lesion Calcification and DCB Efficacy • 60 patients with SFA stenosis or occlusion treated with DCB 100% • 50% primary patency rates in heavily 80% calcified SFA lesions, 60% regardless of lesion length • Greater calcification was associated 40% 20% with poorer outcomes at 1 year: – – Lower patency Greater TLR rate Lower ankle-brachial index Greater late lumen loss DCB, drug-coated balloon; SFA, superficial femoral artery; TLR, target lesion revascularization. Fanelli F, et al. Cardiovasc Intervent Radiol. 2014 ; 37(4): 898 -907. 12 Month Primary Patency 100% 90% 88% 50%50% 0% 1 a 1 b 2 a 2 b Minimal Calcificationa 3 a 3 b 4 a High Calcification Study conducted using Medtronic IN. PACT® Admiral® DCB a. Calcium burden quantified with computed tomography angiography (CTA), digital subtraction angiography (DSA), and intravascular ultrasound (IVUS). 4 b
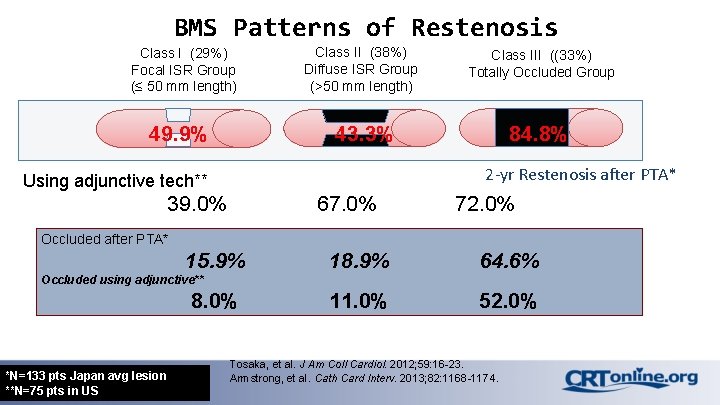
BMS Patterns of Restenosis Class I (29%) Focal ISR Group (≤ 50 mm length) 49. 9% Class II (38%) Diffuse ISR Group (>50 mm length) Class III ((33%) Totally Occluded Group 43. 3% 84. 8% 2 -yr Restenosis after PTA* Using adjunctive tech** 39. 0% 67. 0% 72. 0% Occluded after PTA* 15. 9% 18. 9% 64. 6% 11. 0% 52. 0% Occluded using adjunctive** 8. 0% *N=133 pts Japan avg lesion **N=75 pts in US Tosaka, et al. J Am Coll Cardiol. 2012; 59: 16 -23. Armstrong, et al. Cath Card Interv. 2013; 82: 1168 -1174.
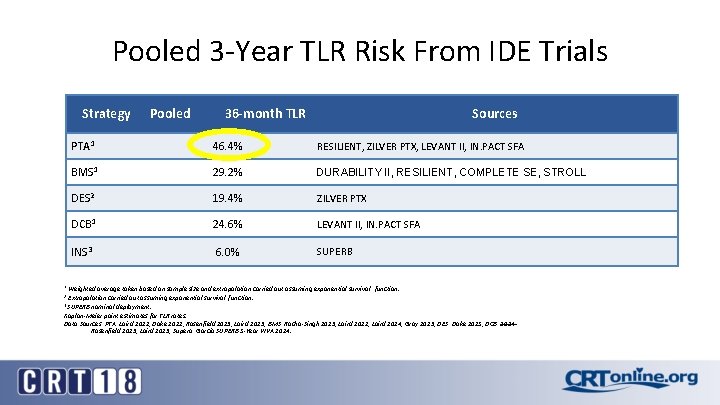
Pooled 3 -Year TLR Risk From IDE Trials Strategy Pooled 36 -month TLR Sources PTA 1 46. 4% RESILIENT, ZILVER PTX, LEVANT II, IN. PACT SFA BMS 1 29. 2% DURABILITY II, RESILIENT, COMPLETE SE, STROLL DES 2 19. 4% ZILVER PTX DCB 1 24. 6% LEVANT II, IN. PACT SFA INS 3 6. 0% SUPERB Weighted average taken based on sample size and extrapolation carried out assuming exponential survival function. Extrapolation carried out assuming exponential survival function. 3 SUPERB nominal deployment. Kaplan-Meier point estimates for TLR rates. Data Sources: PTA: Laird 2012, Dake 2011, Rosenfield 2015, Laird 2015; BMS: Rocha-Singh 2015, Laird 2012, Laird 2014, Gray 2015; DES: Dake 2013; DCB: 2014 Rosenfield 2015, Laird 2015; Supera: Garcia SUPERB 3 -Year VIVA 2014. 1 2
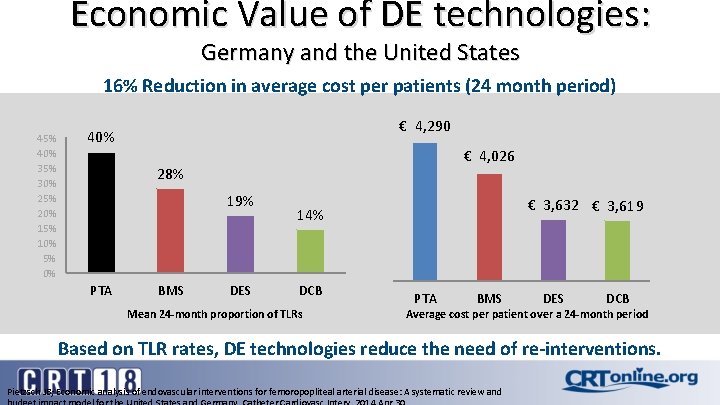
Economic Value of DE technologies: Germany and the United States 16% Reduction in average cost per patients (24 month period) 45% 40% 35% 30% 25% 20% 15% 10% 5% 0% € 4, 290 40% € 4, 026 28% 19% PTA BMS DES € 3, 632 € 3, 619 14% DCB Mean 24 -month proportion of TLRs PTA BMS DES DCB Average cost per patient over a 24 -month period Based on TLR rates, DE technologies reduce the need of re-interventions. Pietzsch JB; Economic analysis of endovascular interventions for femoropopliteal arterial disease: A systematic review and
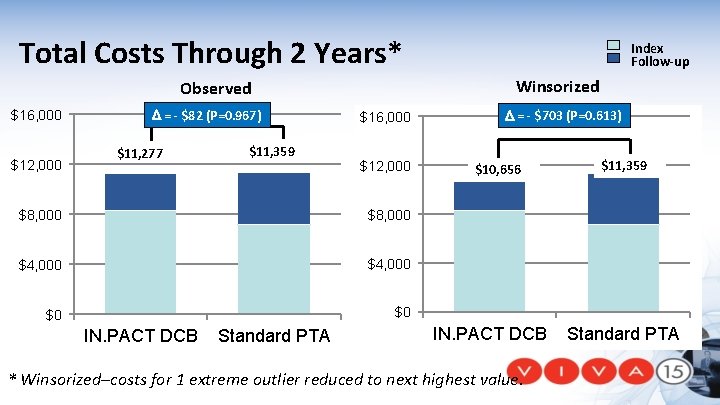
Total Costs Through 2 Years* Winsorized Observed $16, 000 $12, 000 D = - $82 (P=0. 967) $11, 277 $11, 359 $16, 000 $12, 000 $8, 000 $4, 000 $0 $0 IN. PACT DCB Standard PTA Index Follow-up D = - $703 (P=0. 613) $10, 656 IN. PACT DCB * Winsorized–costs for 1 extreme outlier reduced to next highest value. $11, 359 Standard PTA
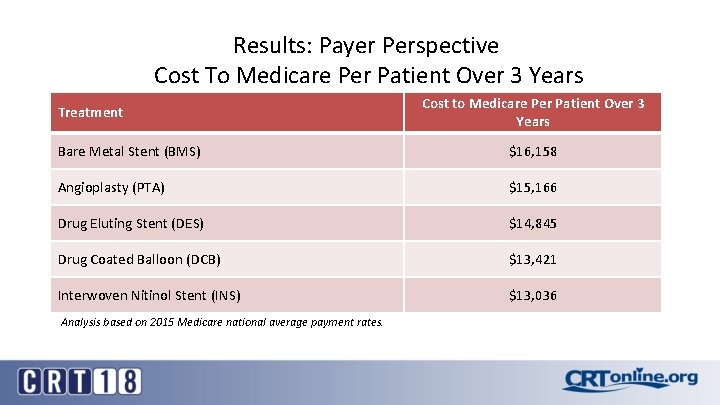
Results: Payer Perspective Cost To Medicare Per Patient Over 3 Years Treatment Cost to Medicare Per Patient Over 3 Years Bare Metal Stent (BMS) $16, 158 Angioplasty (PTA) $15, 166 Drug Eluting Stent (DES) $14, 845 Drug Coated Balloon (DCB) $13, 421 Interwoven Nitinol Stent (INS) $13, 036 Analysis based on 2015 Medicare national average payment rates.
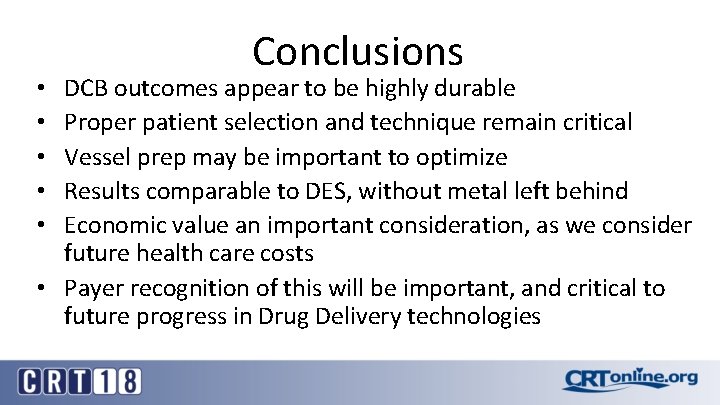
Conclusions DCB outcomes appear to be highly durable Proper patient selection and technique remain critical Vessel prep may be important to optimize Results comparable to DES, without metal left behind Economic value an important consideration, as we consider future health care costs • Payer recognition of this will be important, and critical to future progress in Drug Delivery technologies • • •
- Slides: 28