DB 2 for i Monitoring Analysis and Tuning
DB 2 for i Monitoring, Analysis and Tuning Mike Cain IBM DB 2 for i Center of Excellence Rochester, MN USA mcain@us. ibm. com © 2009 IBM Corporation
Even though DB 2 for i is: ü ü Self managing Self tuning Easy to use Easy to maintain SQL monitoring and analysis is advantageous © 2009 IBM Corporation
Review of Query Optimization and Execution © 2009 IBM Corporation
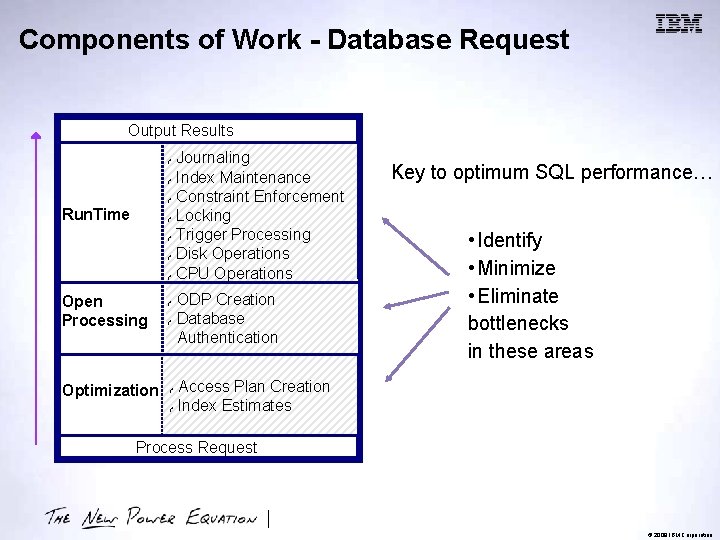
Components of Work - Database Request Output Results ƒ ƒ ƒ Run. Time ƒ ƒ Open Processing Optimization ƒ ƒ Journaling Index Maintenance Constraint Enforcement Locking Trigger Processing Disk Operations CPU Operations ODP Creation Database Authentication Key to optimum SQL performance… • Identify • Minimize • Eliminate bottlenecks in these areas Access Plan Creation Index Estimates Process Request © 2009 IBM Corporation
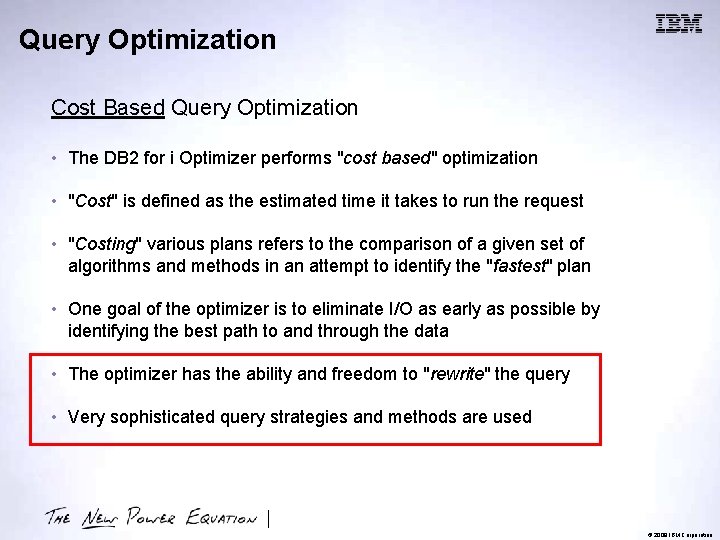
Query Optimization Cost Based Query Optimization • The DB 2 for i Optimizer performs "cost based" optimization • "Cost" is defined as the estimated time it takes to run the request • "Costing" various plans refers to the comparison of a given set of algorithms and methods in an attempt to identify the "fastest" plan • One goal of the optimizer is to eliminate I/O as early as possible by identifying the best path to and through the data • The optimizer has the ability and freedom to "rewrite" the query • Very sophisticated query strategies and methods are used © 2009 IBM Corporation
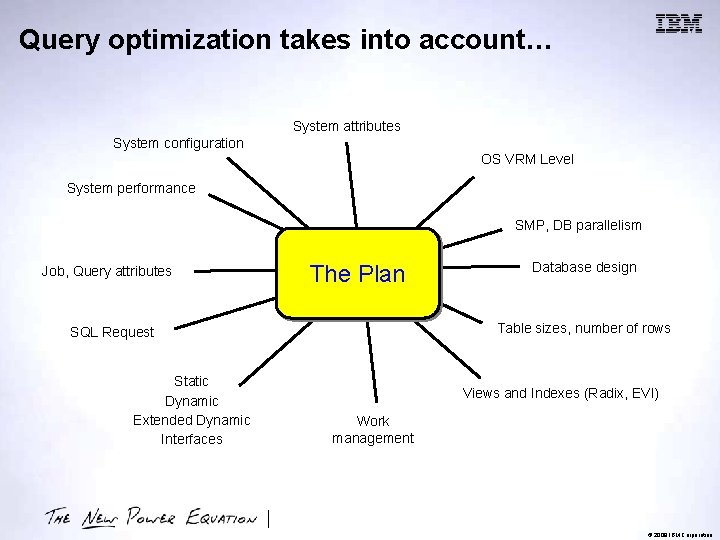
Query optimization takes into account… System attributes System configuration OS VRM Level System performance SMP, DB parallelism Job, Query attributes The Plan Table sizes, number of rows SQL Request Static Dynamic Extended Dynamic Interfaces Database design Views and Indexes (Radix, EVI) Work management © 2009 IBM Corporation
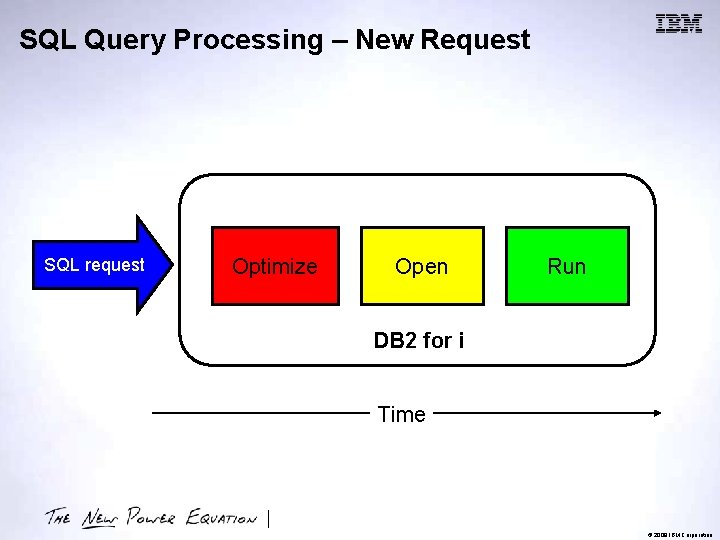
SQL Query Processing – New Request SQL request Optimize Open Run DB 2 for i Time © 2009 IBM Corporation
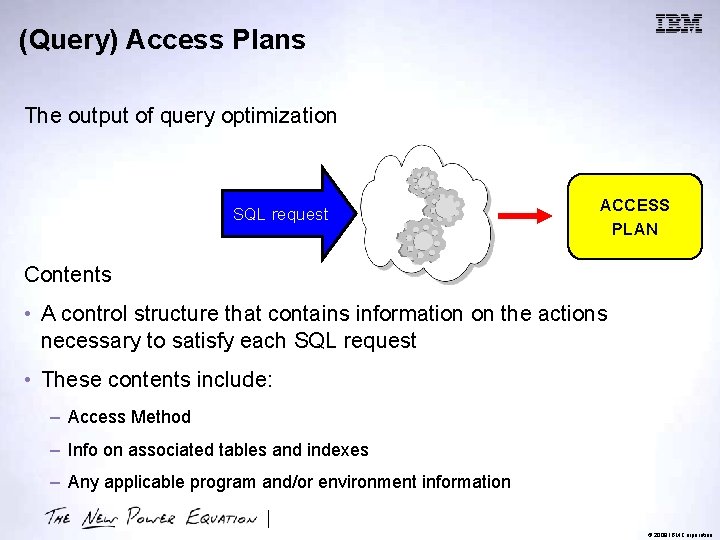
(Query) Access Plans The output of query optimization SQL request ACCESS PLAN Contents • A control structure that contains information on the actions necessary to satisfy each SQL request • These contents include: – Access Method – Info on associated tables and indexes – Any applicable program and/or environment information © 2009 IBM Corporation
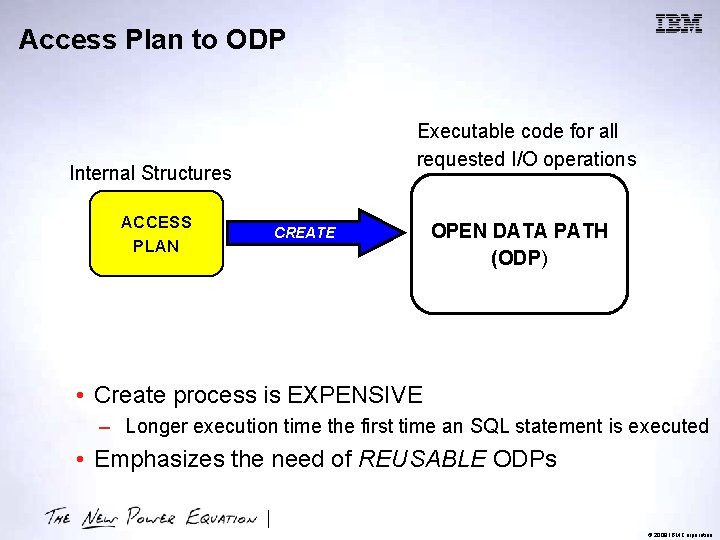
Access Plan to ODP Executable code for all requested I/O operations Internal Structures ACCESS PLAN CREATE OPEN DATA PATH (ODP) • Create process is EXPENSIVE – Longer execution time the first time an SQL statement is executed • Emphasizes the need of REUSABLE ODPs © 2009 IBM Corporation
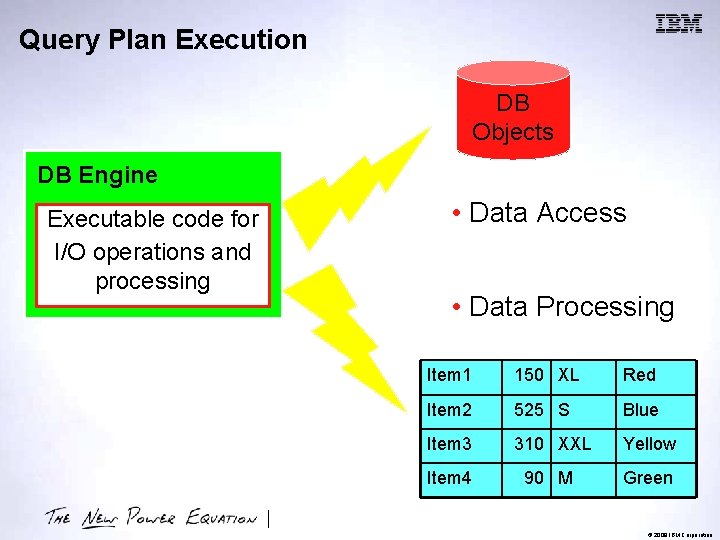
Query Plan Execution DB Objects DB Engine Executable code for I/O operations and processing • Data Access • Data Processing Item 1 150 XL Red Item 2 525 S Blue Item 3 310 XXL Yellow Item 4 90 M Green © 2009 IBM Corporation
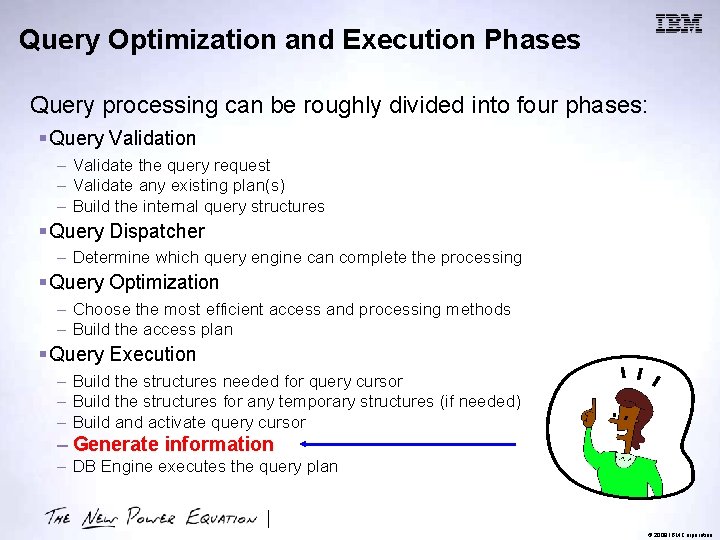
Query Optimization and Execution Phases Query processing can be roughly divided into four phases: § Query Validation – Validate the query request – Validate any existing plan(s) – Build the internal query structures § Query Dispatcher – Determine which query engine can complete the processing § Query Optimization – Choose the most efficient access and processing methods – Build the access plan § Query Execution – Build the structures needed for query cursor – Build the structures for any temporary structures (if needed) – Build and activate query cursor (ODP) – Generate information – DB Engine executes the query plan © 2009 IBM Corporation
SQL Monitoring and Analysis Mechanisms © 2009 IBM Corporation
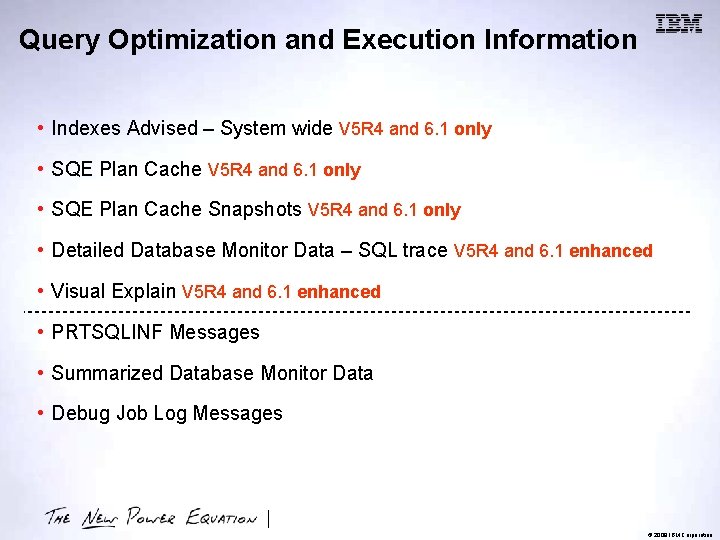
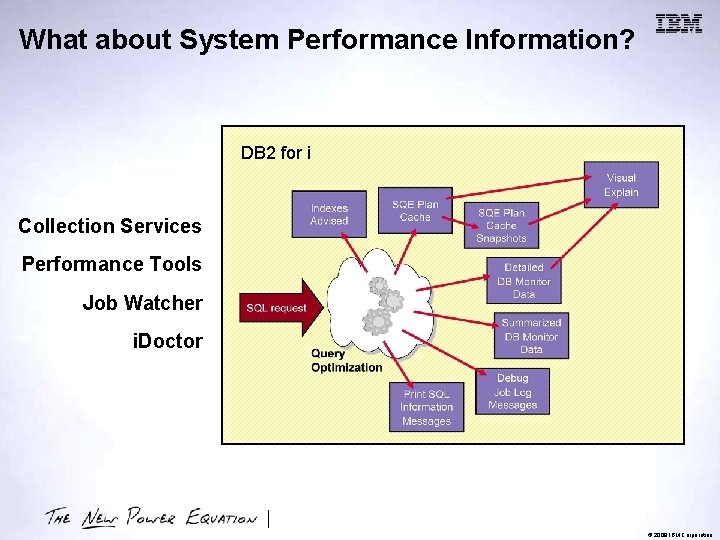
Query Optimization and Execution Information • Indexes Advised – System wide V 5 R 4 and 6. 1 only • SQE Plan Cache Snapshots V 5 R 4 and 6. 1 only • Detailed Database Monitor Data – SQL trace V 5 R 4 and 6. 1 enhanced • Visual Explain V 5 R 4 and 6. 1 enhanced • PRTSQLINF Messages • Summarized Database Monitor Data • Debug Job Log Messages © 2009 IBM Corporation
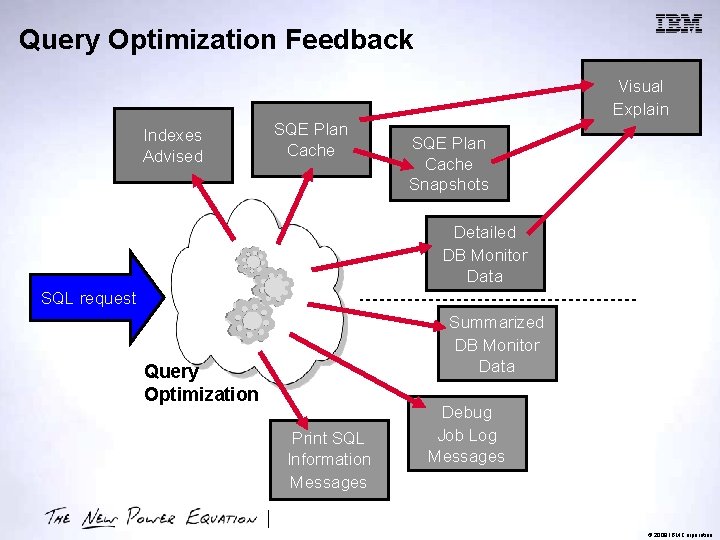
Query Optimization Feedback Visual Explain Indexes Advised SQE Plan Cache Snapshots Detailed DB Monitor Data SQL request Summarized DB Monitor Data Query Optimization Print SQL Information Messages Debug Job Log Messages © 2009 IBM Corporation
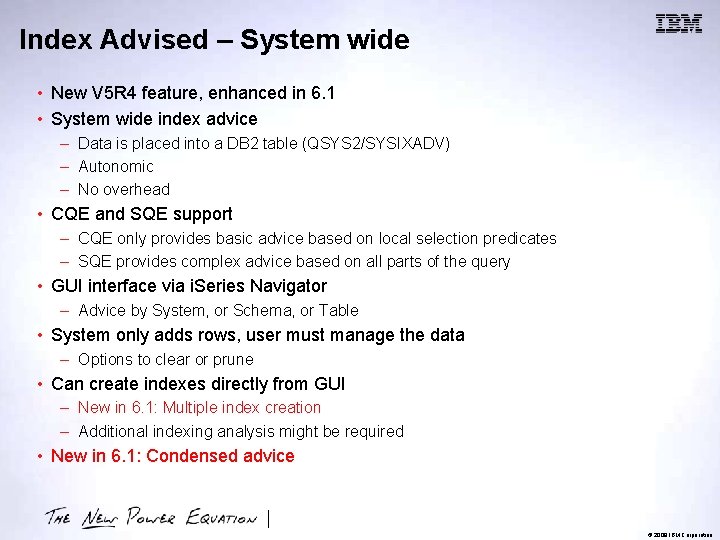
Index Advised – System wide • New V 5 R 4 feature, enhanced in 6. 1 • System wide index advice – Data is placed into a DB 2 table (QSYS 2/SYSIXADV) – Autonomic – No overhead • CQE and SQE support – CQE only provides basic advice based on local selection predicates – SQE provides complex advice based on all parts of the query • GUI interface via i. Series Navigator – Advice by System, or Schema, or Table • System only adds rows, user must manage the data – Options to clear or prune • Can create indexes directly from GUI – New in 6. 1: Multiple index creation – Additional indexing analysis might be required • New in 6. 1: Condensed advice © 2009 IBM Corporation
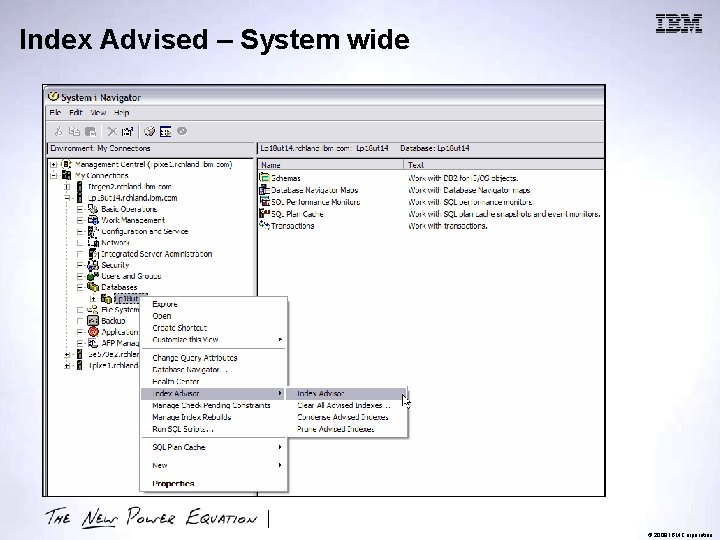
Index Advised – System wide © 2009 IBM Corporation
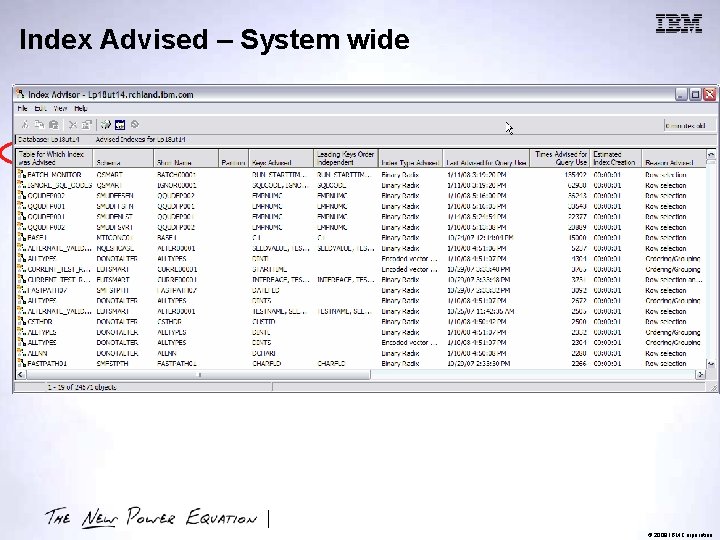
Index Advised – System wide © 2009 IBM Corporation
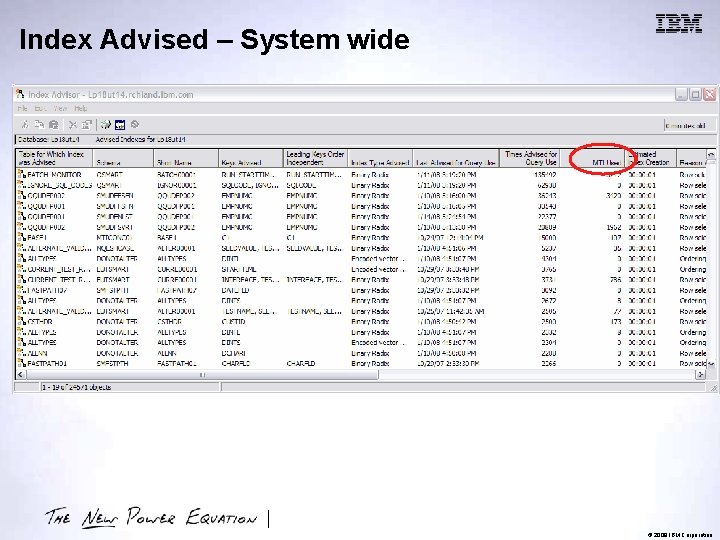
Index Advised – System wide © 2009 IBM Corporation
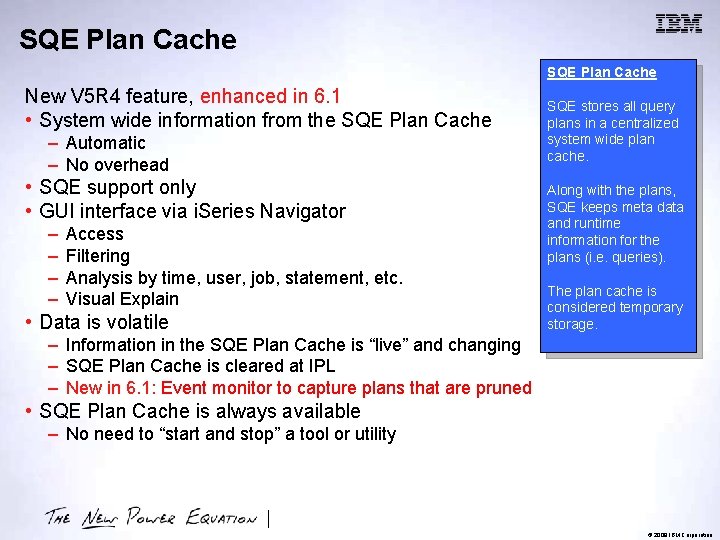
SQE Plan Cache New V 5 R 4 feature, enhanced in 6. 1 • System wide information from the SQE Plan Cache – Automatic – No overhead • SQE support only • GUI interface via i. Series Navigator – – Access Filtering Analysis by time, user, job, statement, etc. Visual Explain • Data is volatile SQE stores all query plans in a centralized system wide plan cache. Along with the plans, SQE keeps meta data and runtime information for the plans (i. e. queries). The plan cache is considered temporary storage. – Information in the SQE Plan Cache is “live” and changing – SQE Plan Cache is cleared at IPL – New in 6. 1: Event monitor to capture plans that are pruned • SQE Plan Cache is always available – No need to “start and stop” a tool or utility © 2009 IBM Corporation
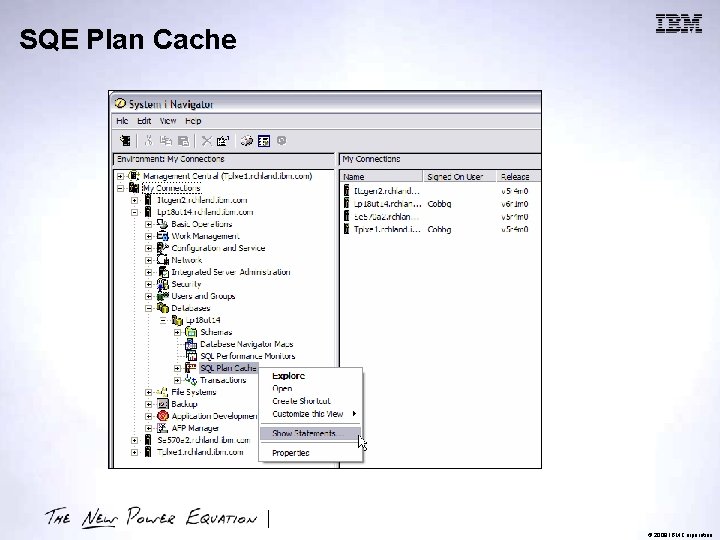
SQE Plan Cache © 2009 IBM Corporation
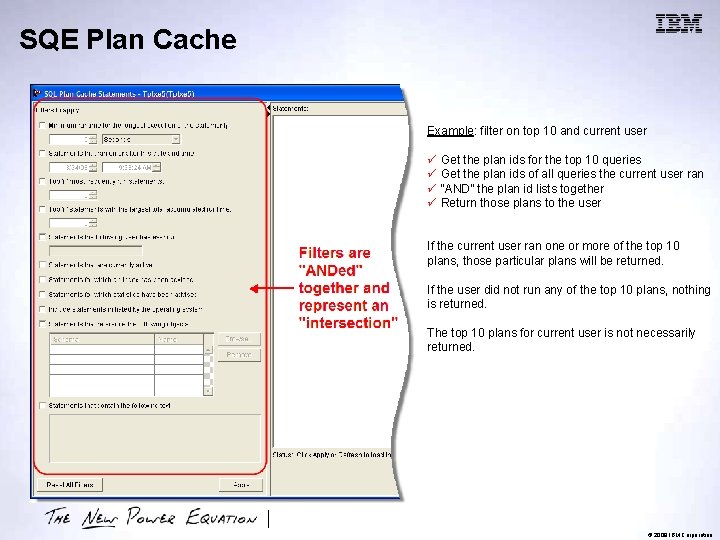
SQE Plan Cache Example: filter on top 10 and current user ü ü Get the plan ids for the top 10 queries Get the plan ids of all queries the current user ran “AND” the plan id lists together Return those plans to the user If the current user ran one or more of the top 10 plans, those particular plans will be returned. If the user did not run any of the top 10 plans, nothing is returned. The top 10 plans for current user is not necessarily returned. © 2009 IBM Corporation
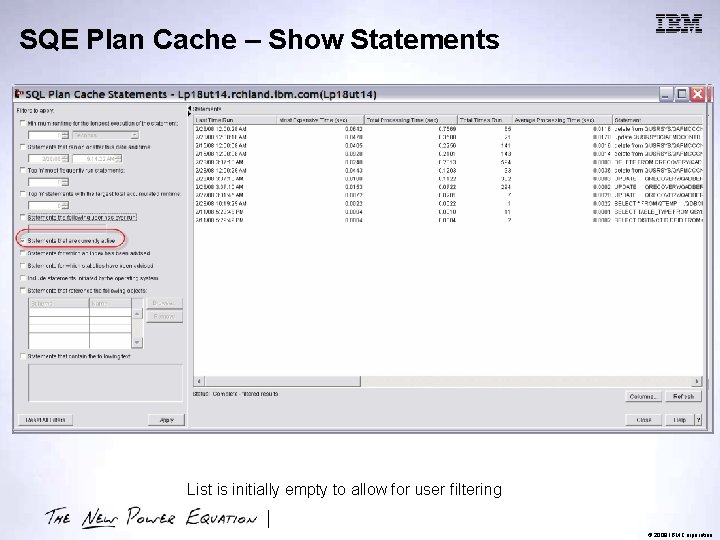
SQE Plan Cache – Show Statements List is initially empty to allow for user filtering © 2009 IBM Corporation
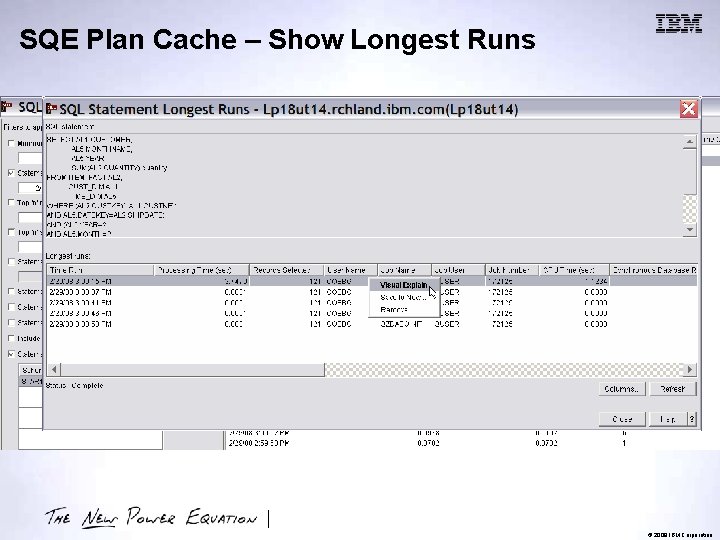
SQE Plan Cache – Show Longest Runs © 2009 IBM Corporation
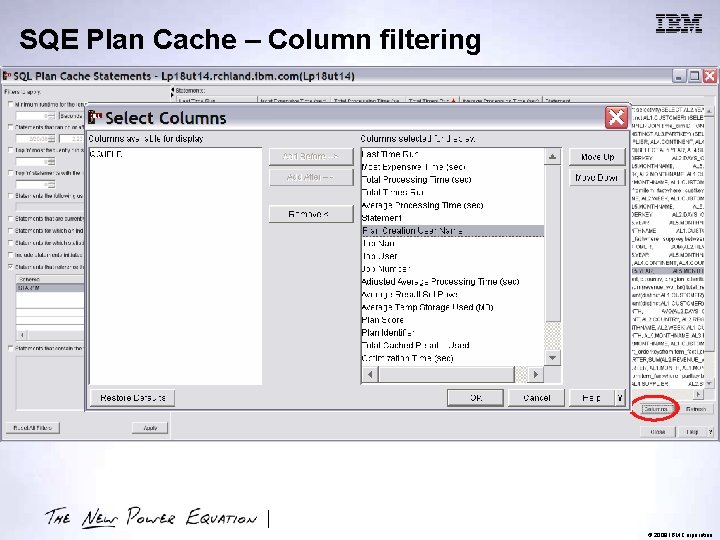
SQE Plan Cache – Column filtering © 2009 IBM Corporation
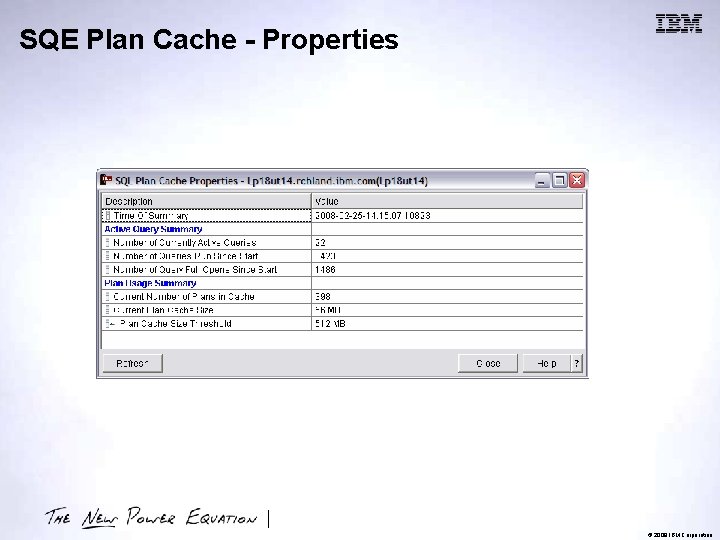
SQE Plan Cache - Properties © 2009 IBM Corporation
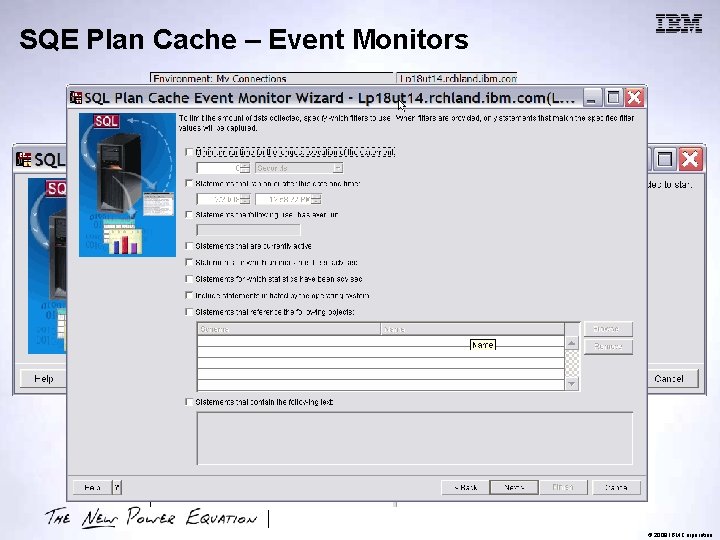
SQE Plan Cache – Event Monitors © 2009 IBM Corporation
SQE Plan Cache Snapshots • New V 5 R 4 feature, enhanced in 6. 1 • System wide information materialized from the SQE Plan Cache – No overhead – data capture is part of normal query optimization and execution – Pre-filtering – Data is placed into a single DB 2 table • SQE support only • SQL interface (CALL QSYS 2/DUMP_PLAN_CACHE) – MC Press Tech Tip - Automatically Generate an SQE Plan Cache Snapshot http: //www. mcpressonline. com/tips-techniques/system-administration/techtip-automatically-generate-an-sqe-plan-cache-snapshot. html – New in 6. 1: SQE Plan Cache Snapshots are automatically registered • GUI interface via i. Series Navigator – – Access Filtering Analysis by time, user, job, statement, etc. Visual Explain • Data is not volatile – Information from the SQE Plan Cache is “captured” at a point in time • SQE Plan Cache is always available – No need to “start and stop” a tool or utility • Additional analysis methods available like “before and after” comparisons • New in 6. 1: Copy to spreadsheet © 2009 IBM Corporation
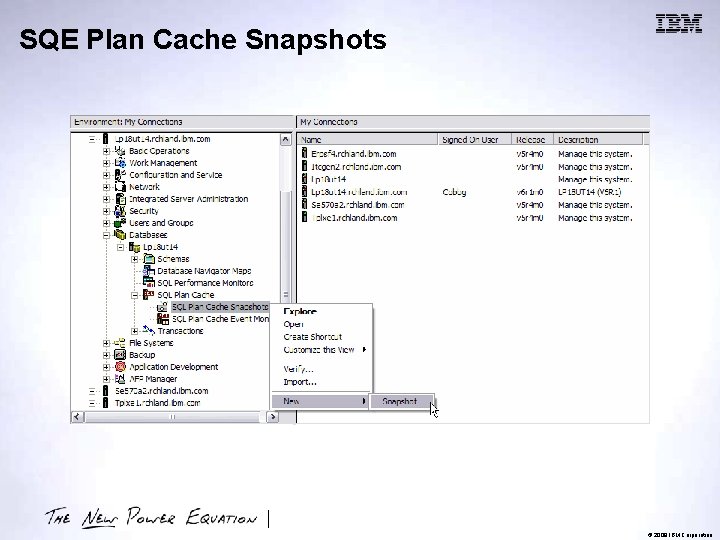
SQE Plan Cache Snapshots © 2009 IBM Corporation
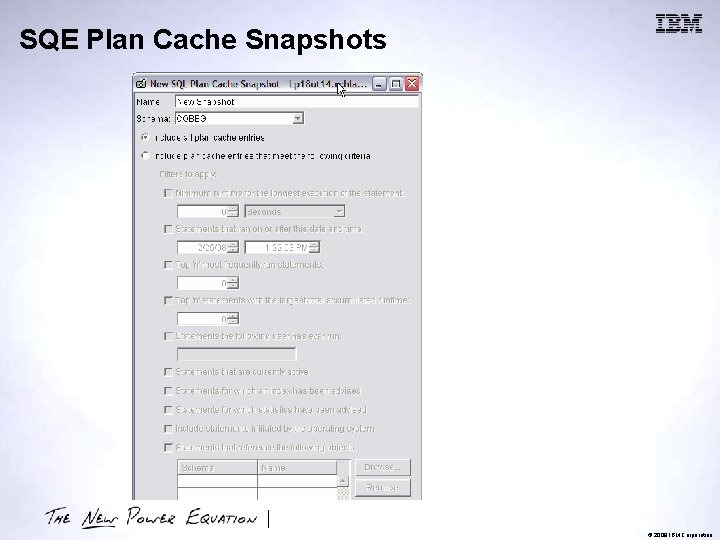
SQE Plan Cache Snapshots © 2009 IBM Corporation
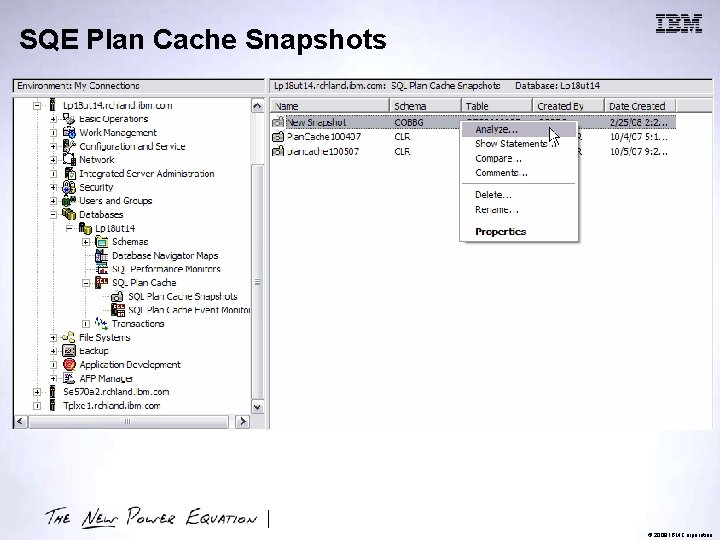
SQE Plan Cache Snapshots © 2009 IBM Corporation
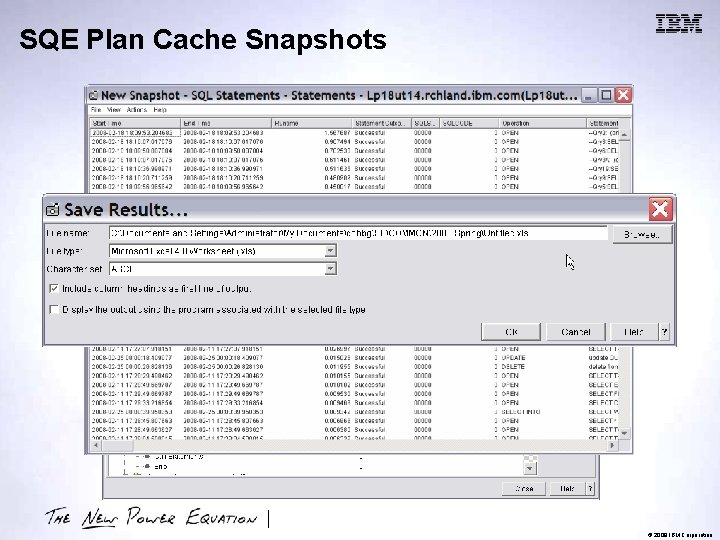
SQE Plan Cache Snapshots © 2009 IBM Corporation
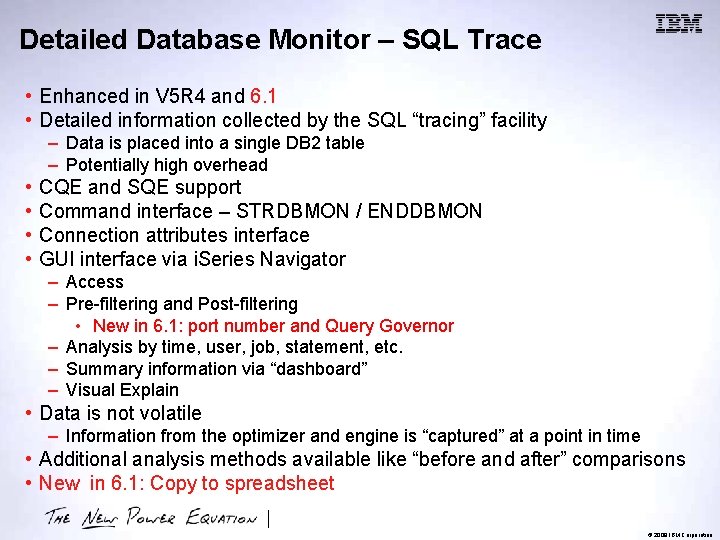
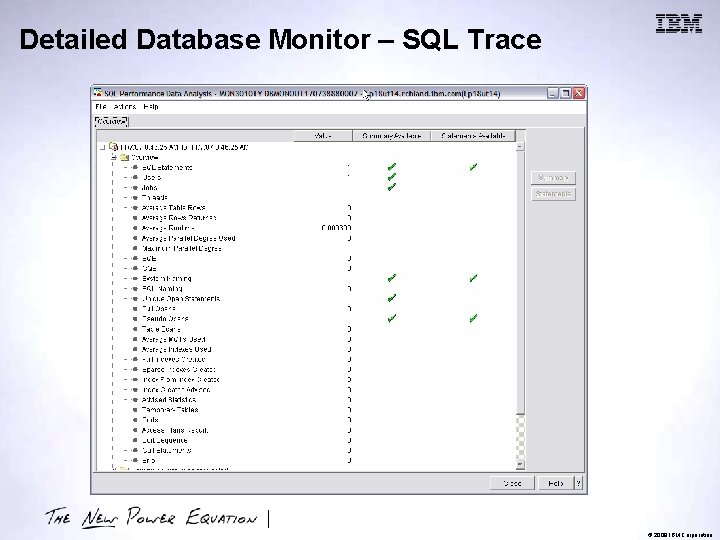
Detailed Database Monitor – SQL Trace • Enhanced in V 5 R 4 and 6. 1 • Detailed information collected by the SQL “tracing” facility – Data is placed into a single DB 2 table – Potentially high overhead • • CQE and SQE support Command interface – STRDBMON / ENDDBMON Connection attributes interface GUI interface via i. Series Navigator – Access – Pre-filtering and Post-filtering • New in 6. 1: port number and Query Governor – Analysis by time, user, job, statement, etc. – Summary information via “dashboard” – Visual Explain • Data is not volatile – Information from the optimizer and engine is “captured” at a point in time • Additional analysis methods available like “before and after” comparisons • New in 6. 1: Copy to spreadsheet © 2009 IBM Corporation
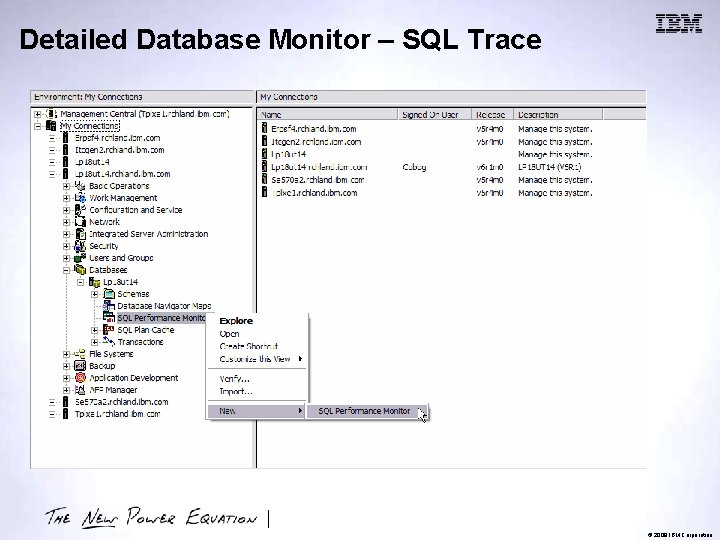
Detailed Database Monitor – SQL Trace © 2009 IBM Corporation
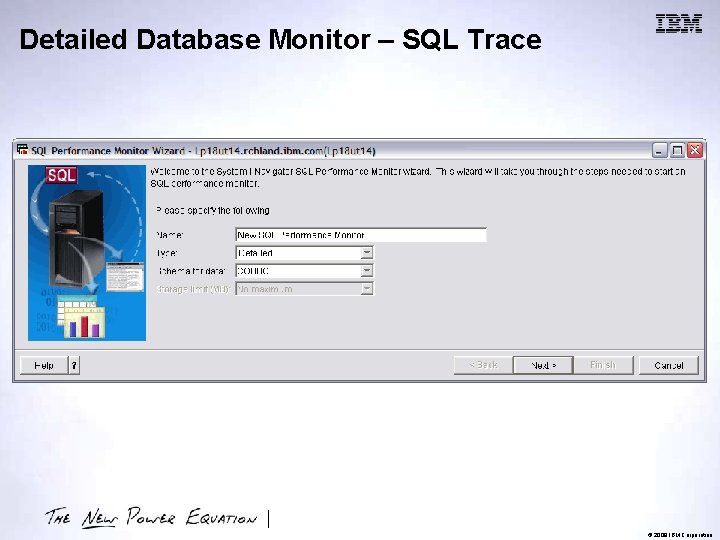
Detailed Database Monitor – SQL Trace © 2009 IBM Corporation
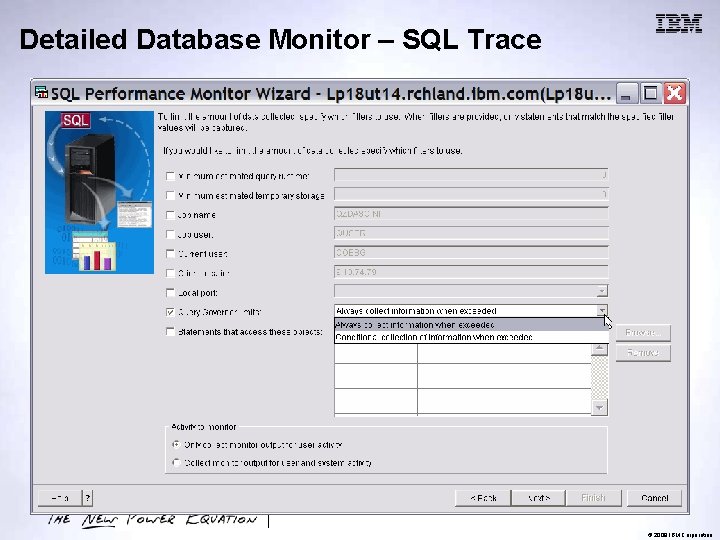
Detailed Database Monitor – SQL Trace New in 6. 1 © 2009 IBM Corporation
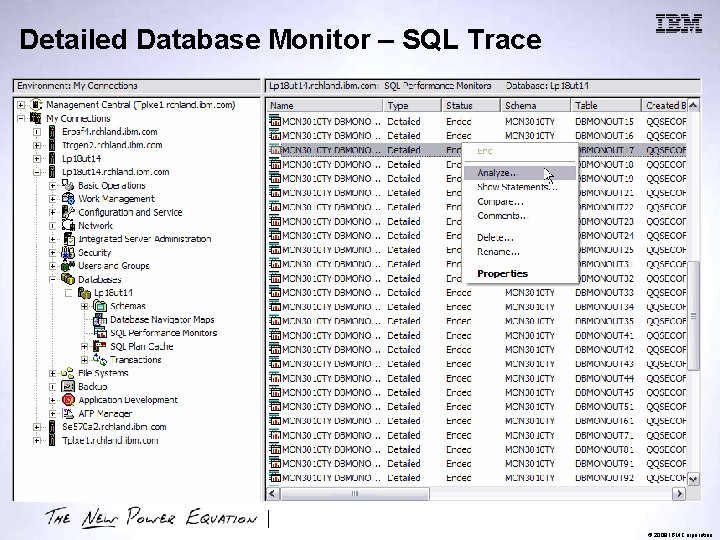
Detailed Database Monitor – SQL Trace © 2009 IBM Corporation
Detailed Database Monitor – SQL Trace © 2009 IBM Corporation
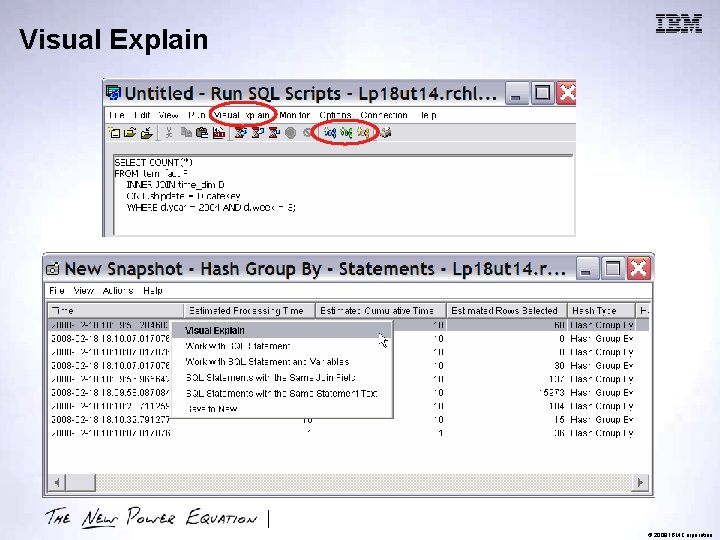
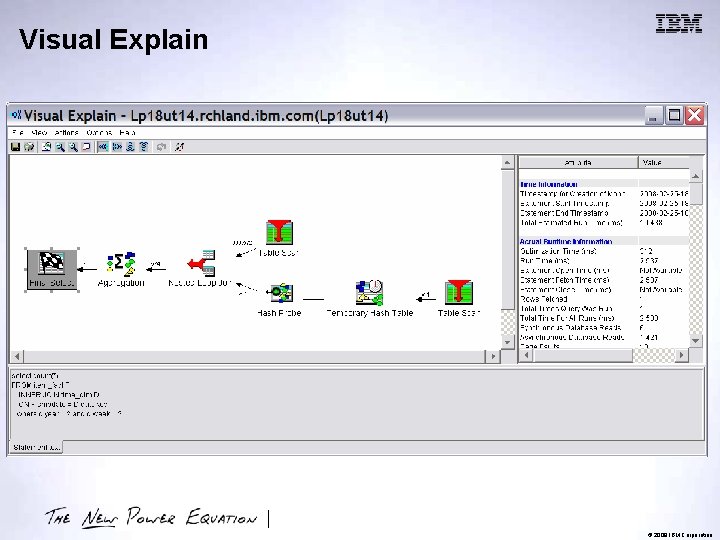
Visual Explain • Enhanced in V 5 R 4, enhanced in 6. 1 • Graphical representation of query plan – – – Representation of the DB objects and data structures Representation of the methods and strategy Associated environmental information Advice on indexes and column statistics Highlighting of specific query rewrites Highlighting of expensive methods • CQE and SQE support • GUI interface via i. Series Navigator • Based on detailed optimizer information – SQE Plan Cache Snapshots – Detailed Database Monitor Data • New in 6. 1: – Explain while running – Print attributes for a given node © 2009 IBM Corporation
Visual Explain © 2009 IBM Corporation
Visual Explain © 2009 IBM Corporation
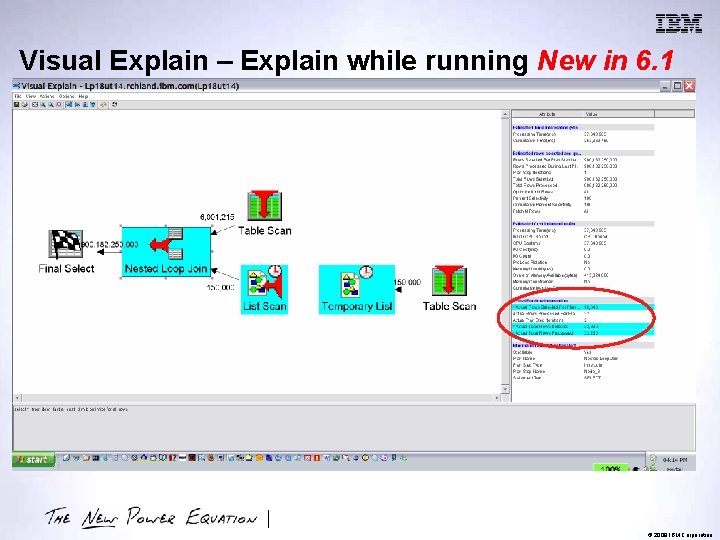
Visual Explain – Explain while running New in 6. 1 © 2009 IBM Corporation
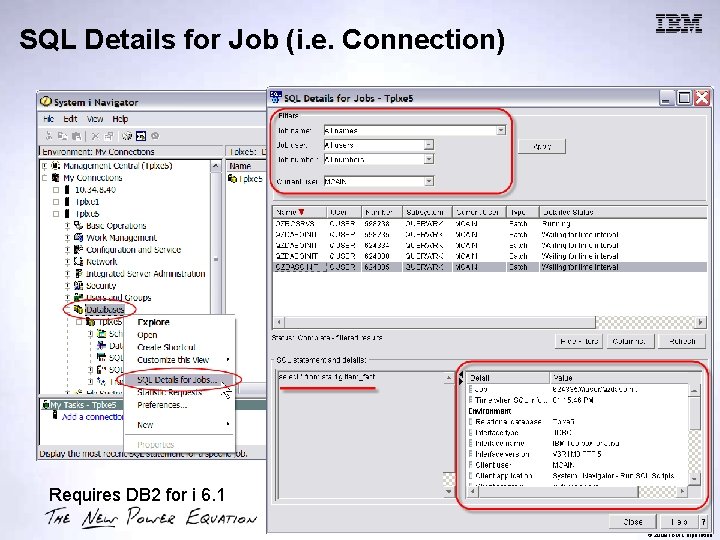
SQL Details for Job (i. e. Connection) Requires DB 2 for i 6. 1 © 2009 IBM Corporation
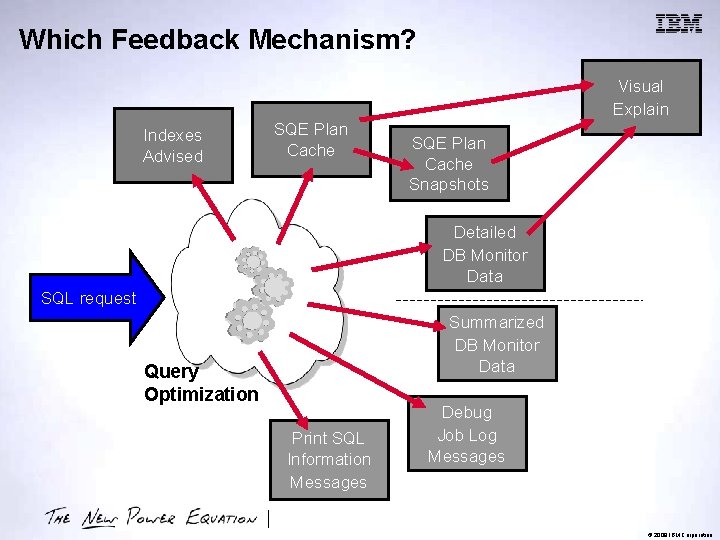
Which Feedback Mechanism? Visual Explain Indexes Advised SQE Plan Cache Snapshots Detailed DB Monitor Data SQL request Summarized DB Monitor Data Query Optimization Print SQL Information Messages Debug Job Log Messages © 2009 IBM Corporation
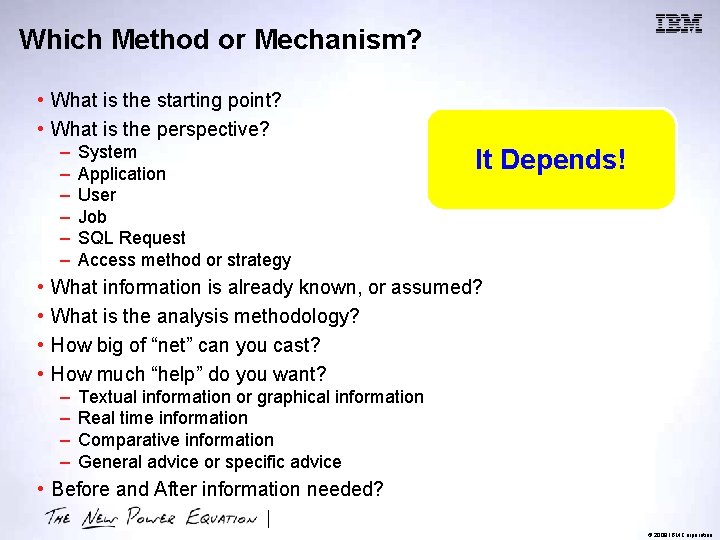
Which Method or Mechanism? • What is the starting point? • What is the perspective? – – – • • System Application User Job SQL Request Access method or strategy It Depends! What information is already known, or assumed? What is the analysis methodology? How big of “net” can you cast? How much “help” do you want? – – Textual information or graphical information Real time information Comparative information General advice or specific advice • Before and After information needed? © 2009 IBM Corporation
What about System Performance Information? DB 2 for i Collection Services Performance Tools Job Watcher i. Doctor © 2009 IBM Corporation

© 2009 IBM Corporation
- Slides: 46