
DAY 58 DATA TABLES VOCABULARY Twoway Frequency Tables
DAY 58 – DATA TABLES

VOCABULARY Two-way Frequency Tables are a visual representation of the possible relationships between two sets of categorical data. Two-way Relative Frequency Tables displays percentage or ratios instead of just frequency counts, these table can show relative frequencies for the whole table, for rows, or for columns.
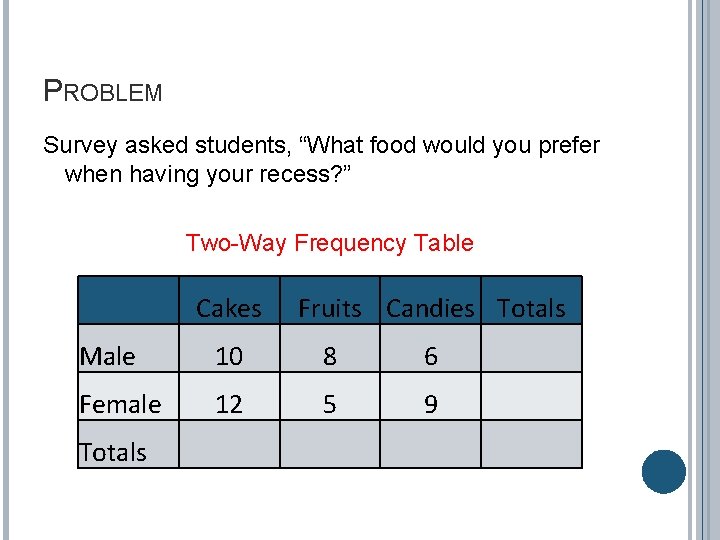
PROBLEM Survey asked students, “What food would you prefer when having your recess? ” Two-Way Frequency Table Cakes Fruits Candies Totals Male 10 8 6 Female 12 5 9 Totals
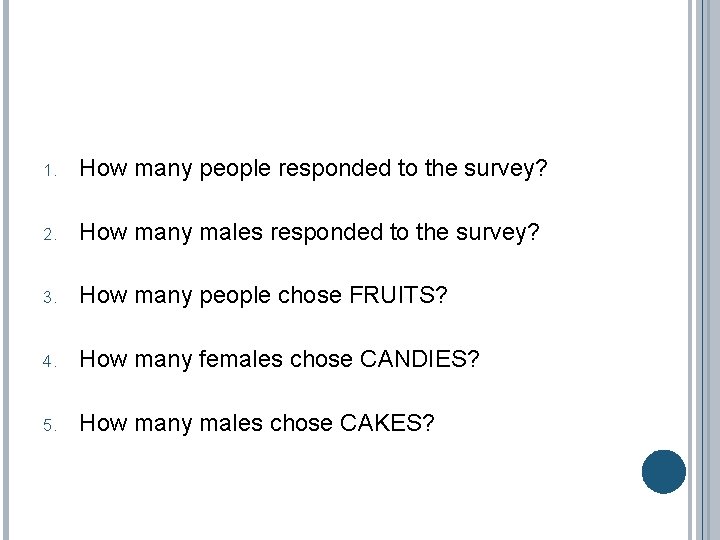
1. How many people responded to the survey? 2. How many males responded to the survey? 3. How many people chose FRUITS? 4. How many females chose CANDIES? 5. How many males chose CAKES?
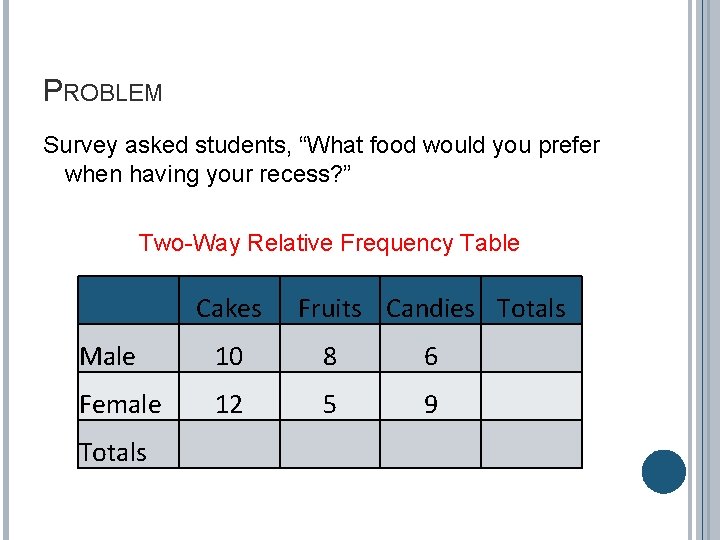
PROBLEM Survey asked students, “What food would you prefer when having your recess? ” Two-Way Relative Frequency Table Cakes Fruits Candies Totals Male 10 8 6 Female 12 5 9 Totals
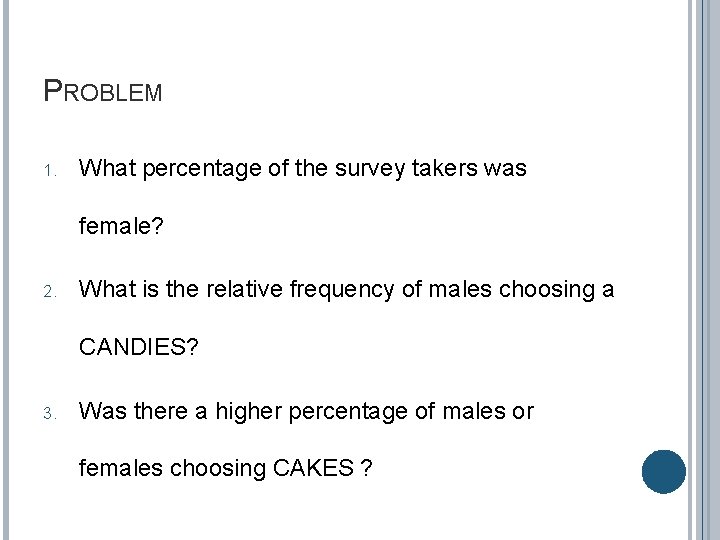
PROBLEM 1. What percentage of the survey takers was female? 2. What is the relative frequency of males choosing a CANDIES? 3. Was there a higher percentage of males or females choosing CAKES ?
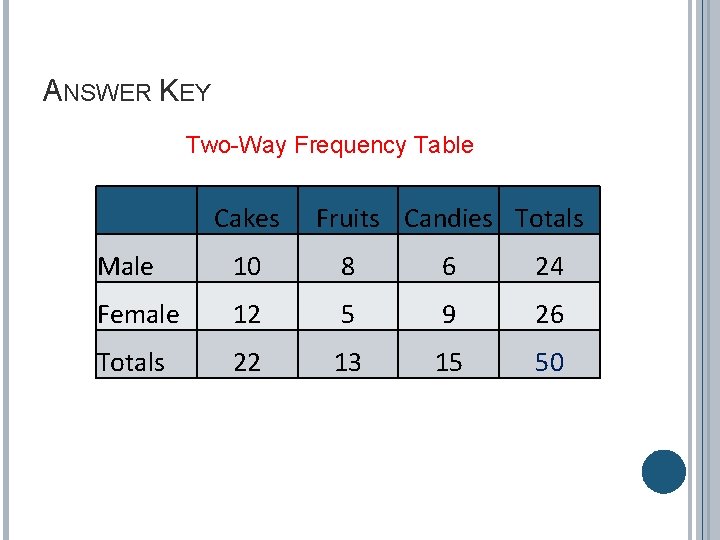
ANSWER KEY Two-Way Frequency Table Cakes Fruits Candies Totals Male 10 8 6 24 Female 12 5 9 26 Totals 22 13 15 50
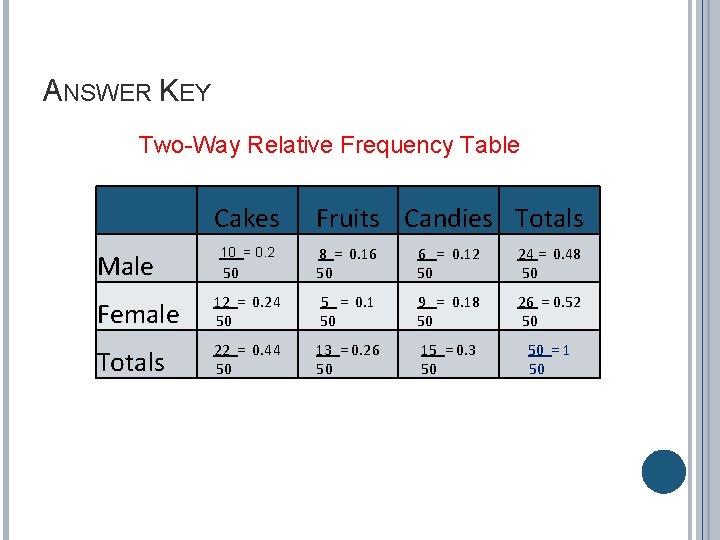
ANSWER KEY Two-Way Relative Frequency Table Cakes Fruits Candies Totals Male 50 8 = 0. 16 50 Female 12 = 0. 24 50 5 = 0. 1 50 9 = 0. 18 50 26 = 0. 52 50 Totals 22 = 0. 44 50 13 = 0. 26 50 15 = 0. 3 50 50 = 1 50 10 = 0. 2 6 = 0. 12 50 24 = 0. 48 50
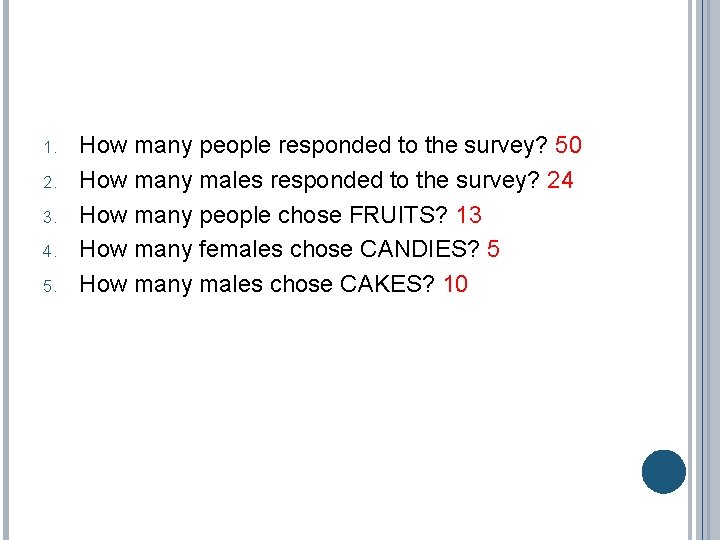
1. 2. 3. 4. 5. How many people responded to the survey? 50 How many males responded to the survey? 24 How many people chose FRUITS? 13 How many females chose CANDIES? 5 How many males chose CAKES? 10
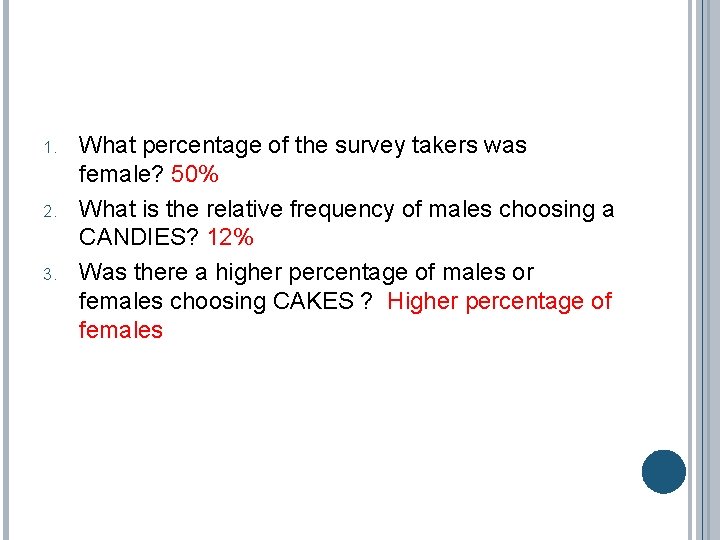
1. 2. 3. What percentage of the survey takers was female? 50% What is the relative frequency of males choosing a CANDIES? 12% Was there a higher percentage of males or females choosing CAKES ? Higher percentage of females
- Slides: 10