Day 5 Two Way Tables Conditional Probability CCM

Day 5: Two Way Tables & Conditional Probability CCM 2 Unit 6: Probability

Warm-Up: Use the fundamental counting principle, permutation or combination formulas to answer the following. 1) As I’m choosing a stocking for my nephew, I’m given a choice of 3 colors for the stocking itself. I plan to have his name embroidered. I have 8 thread choices and 5 font choices. How many variations of stocking can be made for my nephew? 2) I have a candy jar filled with 250 different candies. How many ways can I grab a handful of 7 yummy confections to eat? 3) The Von. Trapp family is taking pictures (they have 7 children). How many ways can we line the children up? 4) The Von. Trapp children are being ornery. Kurt and Brigitta have to be on either side of the picture (away from one another). Now, how many ways can I line the children up? 5) I need to choose a password for my computer. It must be 5 characters long. I can choose any of the 26 letters of the alphabet (lowercase only) or any number as a character. How many possible passwords can I create?

Warm-Up Answers: Use the fundamental counting principle, permutation or combination formulas to answer the following. 1) As I’m choosing a stocking for my nephew, I’m given a choice of 3 colors for the stocking itself. I plan to have his name embroidered. I have 8 thread choices and 5 font choices. How many variations of stocking can be made for my nephew? 3 x 8 x 5 = 120 2) I have a candy jar filled with 250 different candies. How many ways can I grab a handful of 7 yummy confections to eat? 250 C 7 = 1. 11 x 1013 3) The Von. Trapp family is taking pictures (they have 7 children). How many ways can we line the children up? 4) 7 P 7 = 5040 The Von. Trapp children are being ornery. Kurt and Brigitta have to be on either side of the picture (away from one another). Now, how many ways can I line the children up? 240 5) I need to choose a password for my computer. It must be 5 characters long. I can choose any of the 26 letters of the alphabet (lowercase only) or any number as a character. How many possible passwords can I create? 36 x 36 x 36 = 60, 466, 176

Warm-Up: Did you get #4? The Von. Trapp children are being ornery. Kurt and Brigitta have to be on either side of the picture (away from one another). Now, how many ways can I line the children up? (Remember from #3, they have 7 children) 2 * 5*4*3*2*1 *1 = 240 K or B any of other 5 kids K or B (whichever 1 is left)
 5/36 b) 5/18 c) 13/18 2. ½; Yes 3.")
Probability Homework Answers 1. a) 5/36 b) 5/18 c) 13/18 2. ½; Yes 3. ¼; Yes 4. 0 5. 1/10 (mutually inclusive) 6. 3/5 7. a) 53/71 b) 18/71 8. 11/26 9. a) 7/26 b) 5/26 c) 5/13
 m� R = 70°, m� S")
HW Answers: Cumulative Rev. After Unit 5 22) m� R = 70°, m� S = 70°, m� T = 40°, SR = 3, TR = 6 23) a) y = |x - 4| + 2 c) all real numbers b) V (4, 2) d) y ≥ 2 e) right 4, up 2 24 & 25) on next slide 26) a) b) x ≠ -2 (x > -2, x < -2) c) y ≠ 0 (y > 0, y <0) d) left 2
 a) 6 b) -5 c) 3 d) all real")
Cumul. Rev. HW Answers: 24) a) 6 b) -5 c) 3 d) all real numbers e) y < -1, y ≥ 3 25) b) (-3. 5, -2. 25) c & d) (-5, 0) (-2, 0) e) x = -3. 5 f) opens up g) (0, 10)

Notes Day 5 Part 1: Two Way frequency Tables and Conditional Probability

Conditional Probability • contains a CONDITION that may LIMIT the sample space for an event • can be written with the notation P(B|A), which is read “the probability of event B, GIVEN event A” • How likely is one event to happen, given that another event HAS happened? • percentages/probability based on the ROW or COLUMN total of the given event -> for two-way table problems • more complex “given” problems may require use of this formula: Probability of A given B =
 A B S")
Why does this formula work? Joint Probability P(A and B) A B S

Conditional Probability Since Event A has happened, the sample space S is reduced to the outcomes in A A S P(A and B) represents the outcomes from B that are included in A

Examples 1. You are playing a game of cards where the winner is determined by drawing two cards of the same suit. What is the probability of drawing clubs on the second draw if the first card drawn is a club? P(club) = P(2 nd club and 1 st club)/P(1 st club) = (13/52 x 12/51)/(13/52) = 12/51 or 4/17 The probability of drawing a club on the second draw given the first card is a club is 4/17 or 23. 5%

2. A bag contains 6 blue marbles and 2 brown marbles. One marble is randomly drawn and discarded. Then a second marble is drawn. Find the probability that the second marble is brown given that the first marble drawn was blue. P(brown blue) = P(blue and brown)/P(blue) = (6/8 x 2/7)/(6/8) = 2/7 The probability of drawing a brown marble given the first marble was blue is 2/7 or 28. 6%

3. In Mr. Jonas' homeroom, 70% of the students have brown hair, 25% have brown eyes, and 5% have both brown hair and brown eyes. A student is excused early to go to a doctor's appointment. If the student has brown hair, what is the probability that the student also has brown eyes? P(brown eyes brown hair) = P(brown eyes and brown hair)/P(brown hair) =. 05/. 7 =. 071 The probability of a student having brown eyes given he or she has brown hair is 7. 1%

Using Two-Way Frequency Tables to Compute Conditional Probabilities • In CCM 1 you learned how to put data in a twoway frequency table (using counts) or a twoway relative frequency table (using percents), and use the tables to find joint and marginal frequencies and conditional probabilities. • Let’s look at some examples to review this.

1. Suppose we survey all the students at school and ask them how they get to school and also what grade they are in. The chart below gives the results. Complete the two-way frequency table: Bus 106 9 th or 10 th 11 th or 41 12 th Total Walk 30 Car 70 Other Total 4 58 184 7

9 th or 10 th Bus 106 11 th or 41 12 th Total 147 Walk 30 Car 70 Other Total 4 210 58 184 7 290 88 254 11 500 Suppose we randomly select one student. a. What is the probability that the student walked to school? • 88/500 = 22/125 b. P(9 th or 10 th grader) • 210/500 = 21/50 c. P(rode the bus OR 11 th or 12 th grader) • 147/500 + 290/500 – 41/500 = 396/500 = 99/125

Bus Walk Car Other Total 9 th or 10 th 106 30 70 4 210 11 th or 12 th 41 58 184 7 290 Total 147 88 254 11 500 d. What is the probability that a student is in 11 th or 12 th grade given that they rode in a car to school? P(11 th or 12 th car) * We only want to look at the car column for this probability! = 11 th or 12 th graders in cars/total in cars = 184/254 = 99/127 (or 72. 4%) The probability that a person is in 11 th or 12 th grade given that they rode in a car is 72. 4%

Bus Walk Car Other Total 9 th or 10 th 106 30 70 4 210 11 th or 12 th 41 58 184 7 290 Total 147 88 254 11 500 e. What is P(Walk|9 th or 10 th grade)? = walkers who are 9 th or 10 th / all 9 th or 10 th = 30/210 = 1/7 or 14. 2% The probability that a person walks to school given he or she is in 9 th or 10 th grade is 14. 2%

2. The manager of an ice cream shop is curious as to which customers are buying certain flavors of ice cream. He decides to track whether the customer is an adult or a child and whether they order vanilla ice cream or chocolate ice cream. He finds that of his 224 customers in one week that 146 ordered chocolate. He also finds that 52 of his 93 adult customers ordered vanilla. Build a two-way frequency table that tracks the type of customer and type of ice cream. Vanilla Chocolate Total Adult Child Total Let’s fill in the two-way table together!

You Try – Find the Probabilities! Adult Child Total Vanilla 52 26 78 Chocolate 41 105 146 Total 93 131 224 a. Find P(vanilla) = 78/224 = 39/112 b. Find P(child) = 131/224 c. Find P(vanilla adult) = (52/224)/(93/224) = 52/93 (OR look @ adult row) d. Find P(child chocolate) = (105/224)/(146/224) = 105/146 (OR look @ choc. column)

3. A survey asked students which types of music they listen to? Out of 200 students, 75 indicated pop music and 45 indicated country music with 22 of these students indicating they listened to both. Use a Venn diagram to find the probability that a randomly selected student listens to pop music given that they listen country music. 1 st You Try Filling in Venn Diagram! Pop Country 102

3. A survey asked students which types of music they listen to? Out of 200 students, 75 indicated pop music and 45 indicated country music with 22 of these students indicating they listened to both. Use a Venn diagram to find the probability that a randomly selected student listens to pop music given that they listen country music. Pop 53 Country 22 23 102
 Probability that a randomly selected")
You Try! Pop 53 Country 22 23 102 a) Probability that a randomly selected student listens to pop music given that they listen to country music 22/45 b) P(pop U country) 49/100 c) P(pop country) 11/100 31/40 d) P(country c)
 Probability that")
Did you get part a? Pop 53 Country 22 23 102 a) Probability that a randomly selected student listens to pop music given that they listen to country music P(Pop Country) = 22/(22+23) look at “country” circle (or use formula (22/200)/(45/200) and get same answer) = 22/45 or 48. 9% of students who listen to country also listen to pop.

Using Conditional Probability to Determine if Events are Independent • If two events are statistically independent of each other, then: P(A B) = P(A) and P(B A) = P(B) • Let’s revisit some previous examples and decide if the events are independent.

• 13 clubs out of 52 cards Only 12 clubs left and only 51 cards left

13 clubs out of 52 cards Still 13 clubs out of 52 cards

3. In Mr. Jonas' homeroom, 70% of the students have brown hair, 25% have brown eyes, and 5% have both brown hair and brown eyes. A student is excused early to go to a doctor's appointment. If the student has brown hair, what is the probability that the student also has brown eyes? P(brown eyes brown hair) = P(brown eyes and brown hair)/P(brown hair) =. 05/. 7 =. 071 P(brown eyes) = 0. 25 P(brown eyes brown hair) ≠ P(brown eyes) so these are dependent events

You Try! Adult Child Total Vanilla 52 26 78 Chocolate 41 105 146 Total 93 131 224 4. Determine whether age and choice of ice cream are independent events. We could start by looking at the P(vanilla adult) and P(vanilla). If they are the same, then the events are independent. P(vanilla adult) = 52/93 = 55. 9% P(vanilla) = 78/224 = 34. 8% P(vanilla adult) P(vanilla), so the events are dependent!

Notes Day 5 Part 2: Experimental and Theoretical Probability

Remember. . . • Probability is the chance or likelihood of an event occurring. • We will study two types of probability, theoretical and experimental.
 List sample")
Complete Notes p. 22 on your own… For Part A, 1 st) List sample space. 2 nd) Find the probabilities. Compare answers with those around you. For Part B, Borrow a die from the teacher AFTER completing question 1. Compare answers with those around you.

Let’s review what we found….

Theoretical Probability • is the ratio of the number of favorable outcomes to the total possible outcomes. P(Event) = Number or favorable outcomes Total possible outcomes Sample Space: The set of all possible outcomes. (Ex. The sample space for tossing a coin is {heads, tails} Theoretical probability is based on the set of all possible outcomes, or the sample space.

Let’s review what we found: List the sample space for rolling a six-sided die (remember you are listing a set, so you should use brackets {} ): Find the following probabilities: P(2) P(3 or 6) P(odd) P(1, 2, 3, 4, 5, or 6) P(not a 4) P(8) Did you get the same answers as those around you on this part? Why or why not? Yes! Theoretical probability is based on a sample space, so all should get the same answers.

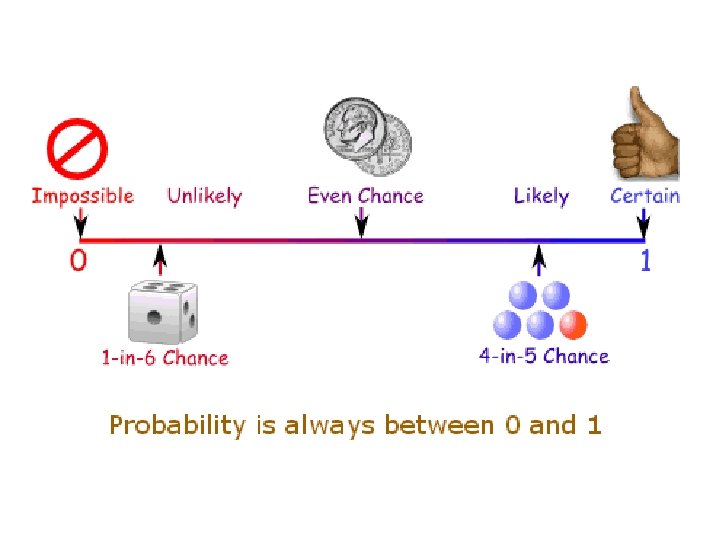
Let’s review what we found: • When would you expect a probability of an event occurring to be 1 or 100%? Probability should be 1 or 100% for a certain event, for something that MUST happen. • When would you expect the probability of an even occurring to be 0 or 0%? Probability should be 0 or 0% for an impossible event, for something that CANNOT happen.

Experimental Probability • The ratio of the number of times the event occurs to the total number of trials. P(Event) = Number of times the event occurs Total number of trials

Rolling Dice Experiment Did you get the same answers as those around you on this part? Why or why not? Experimental probability is due to chance, so it is unlikely you’ll get the same answers as others.

Why can there be differences? ? -Theoretical probability tells us what we can expect to happen. -Experimental probability is dependent on the number of trials conducted AND what happens to occur on those trials.

Which one do I use? ? Theoretical probability is always the best choice when it can be calculated. Experimental probability is best used when we cannot know all the possible outcomes. Ex. Calculating the probability a student’s favorite color is green – we would have to collect data on the class and then use experimental probability.

Fairness • For a game to be fair, theoretical probability for each player winning should be equal. • Why should we base our decision about fairness of a game on theoretical probability not experimental probability?

Practice! Which type of Probability is better? 1. What is the probability of someone tripping on the stairs today between first and second period? Experimental 2. What is the probability of rolling a 3 on a six-sided die, then tossing a coin and getting a head? Theoretical 3. What is the probability that a student will get 4 of 5 true false questions correct on a quiz? Theoretical 4. What is the probability that a student in class is wearing exactly four buttons on his or her clothes? Experimental

Start Homework! • Remember to study for your quiz tonight!
- Slides: 45