Day 15 AGENDA QUIZ 3 30 minutes Work


 95% conf int when sample size is 15 Confidence Level = 95% n")
 99 th percentile when sample size is 30 Confidence Level = 98% WHY?")


")


- Slides: 35
Day 15 AGENDA: • QUIZ #3 --- 30 minutes • Work Day PW Lesson #11: CLT • Begin Unit 1 Lesson #12 • UNIT 1 TEST 1 Thurs; Rev on blog
Accel Precalc Unit #1: Data Analysis Lesson #12: Confidence Intervals For Means EQ: How do you use confidence intervals to estimate population means and proportions?
Terms to Recall Statistics --- measures of a sample; also called point estimates Parameters --- measures of a population
What are some statistics and parameters we have discussed thus far? Measure Statistic Mean Standard Deviation Parameters s In theory you will never know parameters. That is why you use statistics to estimate.
New Terms: Interval Estimates ---interval of values used to estimate a parameter Ex. average of students might be in an interval 17. 9 < < 18. 7 or 18. 3 ± 0. 4 years 0. 4 is called the margin of error
Confidence Level --- probability that the confidence interval will contain the true parameter. Confidence Interval ---specific interval estimate for a population parameter determined by using statistics obtained from a sample.
Handout Table C
See Table C for critical values Use the Table C to determine the corresponding t* value for each interval when n is very large. Confidence Level = 90% t*= 1. 645 5% 90% 1. 645 5% Common Confidence Intervals: 90%, 95%, 99%
Confidence Level = 95% t*= 1. 96 2. 5% 95% 1. 96 Confidence Level = 99% t*= 2. 576 0. 5% 99% 0. 5% 2. 576
Verify by finding the probability under the curve at the given z values. P(z < 1. 645) = 0. 95 RECALL: How do you find area when given a z-score?
Verify by finding the probability under the curve at the given z values. P(z < 1. 96) = 0. 975 RECALL: How do you find area when given a z-score?
Verify by finding the probability under the curve at the given z values. P(z < 2. 575) = 0. 995 RECALL: How do you find area when given a z-score?
AGENDA: • Finish Unit 1 Lesson #12 • Review for Test • UNIT 1 TEST 1 Fri; Rev on blog
Formula for Confidence Intervals For Means: RECALL: Standard Error
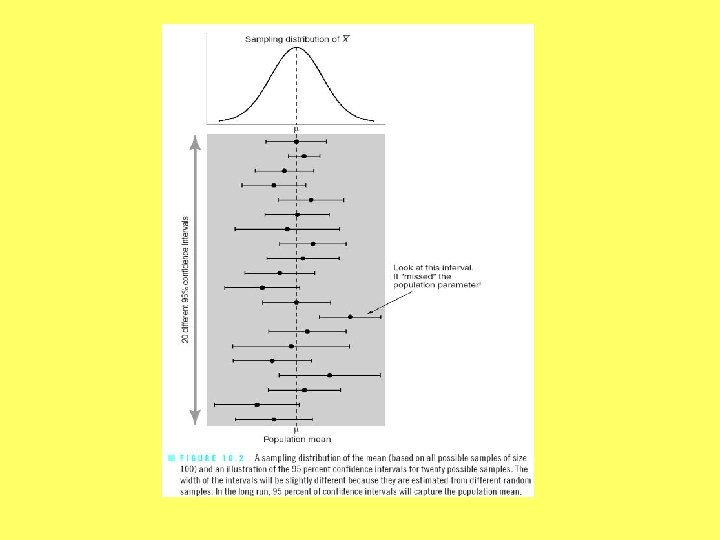
Uses a t-distribution and degrees of freedom where df = n - 1 Recall: Central Limit Theorem When the sample size is large enough, 95% of the sample means will fall within 1. 96 standard deviations of the true parameter.
This means for a 95% confidence interval:
Write the general formula for: Margin of Error
Write the general formula for: Margin of Error
Ex 1 Find the t* values for the following then write the general formula for the confidence interval. a) 90% conf int when sample size is 22 Confidence Level = 90% n = 22 df = 21 Now you must pay attention to sample size.
CL = 90% n = 22 df = 21 t*= 1. 721 Margin of Error
b) 95% conf int when sample size is 15 Confidence Level = 95% n = 15 df = 14 t*= 2. 145 Margin of Error
c) 99 th percentile when sample size is 30 Confidence Level = 98% WHY? n = 30 t*= 2. 462 df = 29 Margin of Error
Confidence Interval Statement: We are _______% confident the true population mean _______________________ is between _______ and _____ for a sample size n = ______.
In Class Examples. Place formula and work on your own paper. Make a conclusion statement in context of the problem. 1. A researcher wishes to estimate the average of money a person spends on lottery tickets each month. A sample of 50 people who play the lottery found the mean to $19 and the standard deviation to be 6. 8. Find the best point estimate of the population and the 95% confidence interval of the population mean. Confidence Level = 95% df = 49 Must read t* at 40 What is the margin of error? ± 1. 944 n = 50 t*= 2. 021
Confidence Interval Statement: 95 We are _______% confident the true population mean of _________ money a person spends on lottery tickets each month ______________ is $17. 06 and _____ $20. 94 between _______ for 50 people a sample size n = ______.
2. The following data represent a sample of the assets (in millions of dollars) of 30 credit unions in southwestern Pennsylvania. Find the 90% confidence interval of the mean. How would you find these values if I didn’t give them to you? CL = 90% n = 30 df = 29 t*= 1. 699 What is the margin of error? ± $4. 468 million
Confidence Interval Statement: 90 We are _______% confident the true of credit unions in population mean assets _________ southwestern Pennsylvania ______________ is million for million and $15. 56 between $6. 623 _________ 30 credit unions a sample size n = ______.
3. A study of 30 marathon runners showed that they could run at an average of 7. 8 miles per hour. The sample standard deviation is 0. 6. Find the point estimate for the mean of all runners. Based on the results, what minimum speed should a runner obtain to qualify in a marathon at a 90% confidence level. Confidence Level = 90% df = 29 n = 30 t*= 1. 699 What is the margin of error? ± 0. 1861 mph Point Estimate At a 90% confidence level and using a sample size of n= 30 runners, the minimum speed necessary for a runner to qualify for a marathon is 7. 61 mph.
4. Ten randomly selected automobiles were stopped and the tread depth of the right front tire was measured. The mean was 0. 32 in and the standard deviation was 0. 08 in. Find the 95% confidence interval of the mean depth. Assume that the variable is approximately normally distributed. Confidence Level = 95% df = 9 t*= 2. 262 What is the margin of error? ± 0. 057 in n = 10
Confidence Interval Statement: 95 We are _______% confident the true tread depth of the right front population mean _________ tire of a selected make of automobile ______________ is in 0. 26 in between _______ and 0. 38 _____ for 10 automobiles a sample size n = ______.
5. The data below represent a sample of the number of home fires started by candles for the past seven years. Find the 99% confidence interval for the mean number of home fires started by candles each year. Assume the variable is normally distributed. 5460 5900 6090 6310 7160 8440 9930 How do you find these values if I didn’t give them to you? Confidence Level = 99% n = 7 df = 6 t*= 3. 707 What is the margin of error? ± 2256. 2 fires
Confidence Interval Statement: 99 We are _______% confident the true of home fires population mean number _________ started by candles ______________ is fires for fires and 9, 297. 6 between 4, 785. 2 _________ 7 years a sample size n = ______.
Assignment : Practice Worksheet Confidence Intervals