
DATATHON OPEN DATA INSIGHTS 10 AM 5 PM




- Slides: 36
DATATHON OPEN DATA INSIGHTS 10 AM - 5 PM November 9, 2017 AGRICULTURAL POLICY SUPPORT UNIT 22, Sech Bhaban - 4 th Floor Manik Mia Avenue Sher-e-Bangla Nagar Dhaka 1207
FTF Datasets • Population Based Surveys for 11 FTF countries publicly available on the USAID Development Data Library: • • • Bangladesh* Ethiopia Ghana Malawi* Mozambique Nepal* • • • Kenya Rwanda* Tajikistan Uganda* Zambia* *Baseline and follow-up available
Bangladesh • Among the three countries most affected by extreme weather events (Anemülle et al. , 2006; UNDP, 2004) • Climate variability accounts for 41%, 45% and 49% of yield variability in dry, terrace and coastal ecosystems, respectively (Rahman et al. , 2017) • Increase in female share of the agricultural labour force, especially in postharvest activities, in recent decades (> 50%) (FAO, 2011; Thompson and Sanabria, 2010) • Reduced gender disparities associated with higher levels of plot-level technical efficiency (Seymour, 2017)
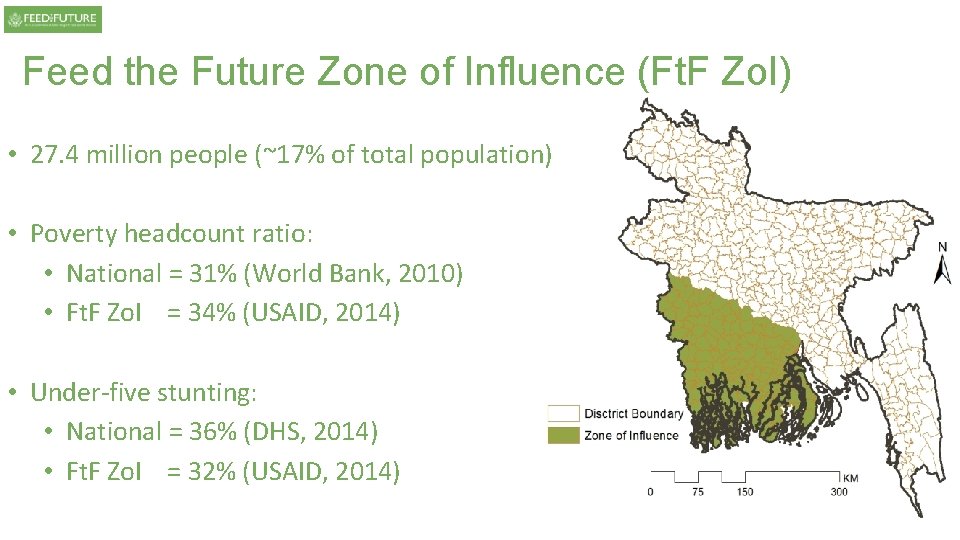
Feed the Future Zone of Influence (Ft. F Zo. I) • 27. 4 million people (~17% of total population) • Poverty headcount ratio: • National = 31% (World Bank, 2010) • Ft. F Zo. I = 34% (USAID, 2014) • Under-five stunting: • National = 36% (DHS, 2014) • Ft. F Zo. I = 32% (USAID, 2014)
Data: Bangladesh Integrated Household Survey (BIHS) • Funded by USAID • Bangladesh Policy Research and Strategy Support Program (PRSSP), IFPRI, and Data Analysis and Technical Assistance (DATA) • Representative of rural divisions and Ft. F Zo. I in south-western Bangladesh • Two rounds of panel data (2011 -2 and 2015), with a two-stage stratified sampling (villages and households)
Two-stage sampling • The country
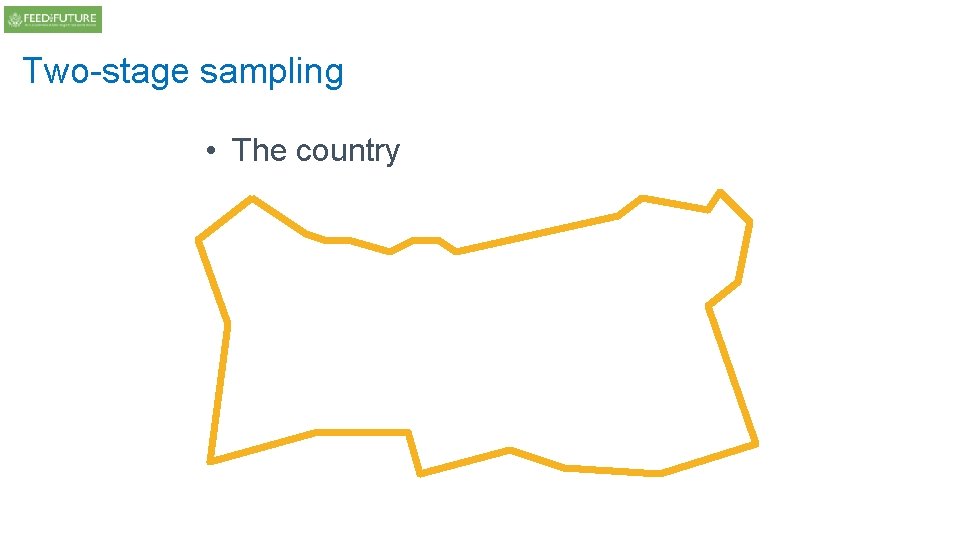
Two-stage sampling • The country can be divided…
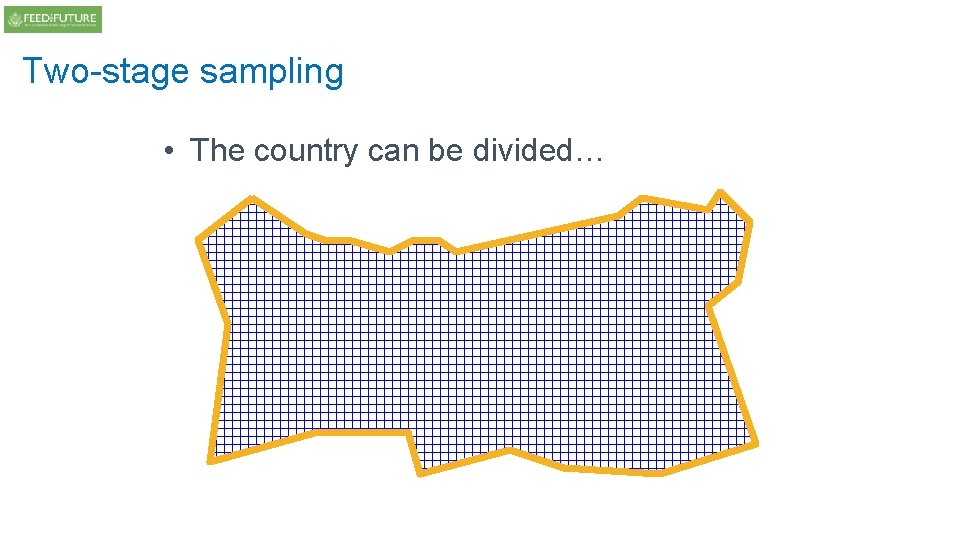
Two-stage sampling p …into small Primary Sampling Units (PSUs) (and strata)
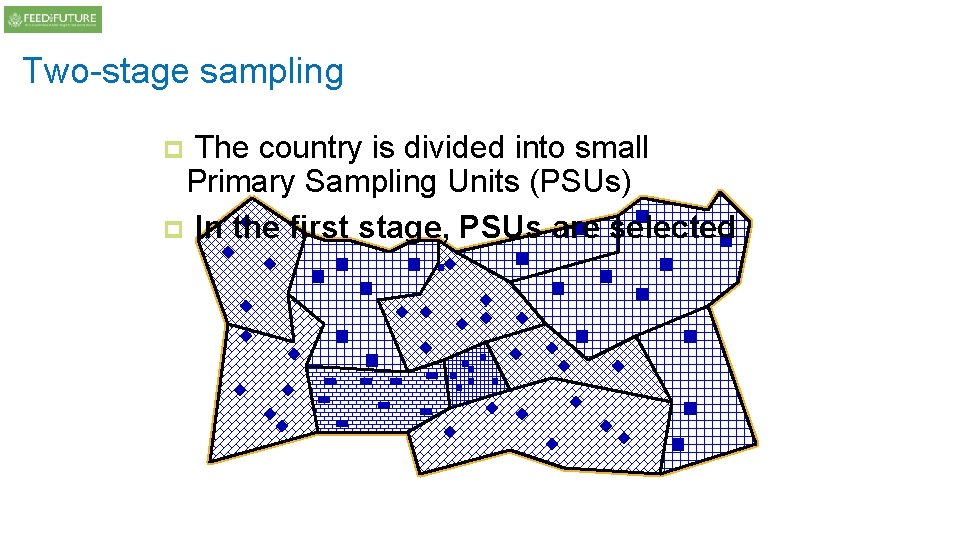
Two-stage sampling The country is divided into small Primary Sampling Units (PSUs) p In the first stage, PSUs are selected p
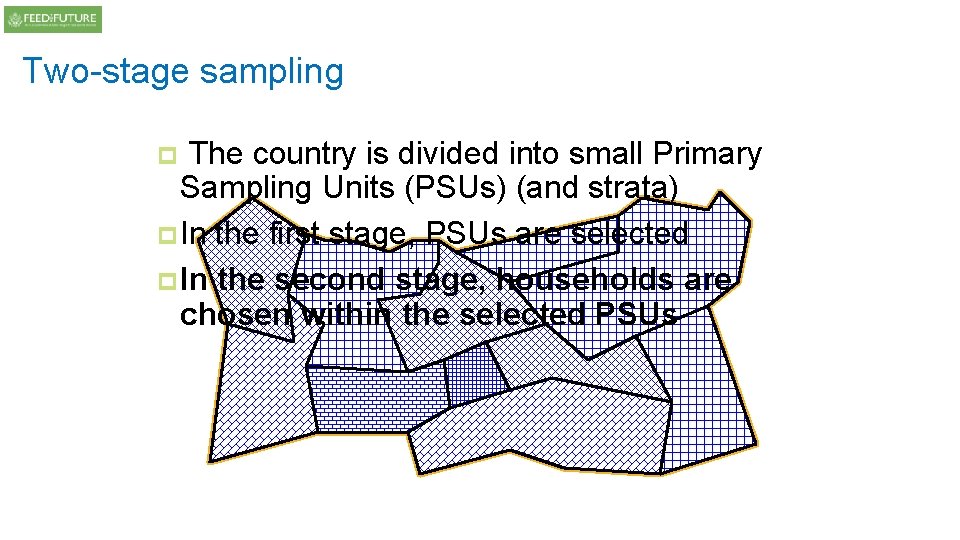
Two-stage sampling The country is divided into small Primary Sampling Units (PSUs) (and strata) p. In the first stage, PSUs are selected p. In the second stage, households are chosen within the selected PSUs p
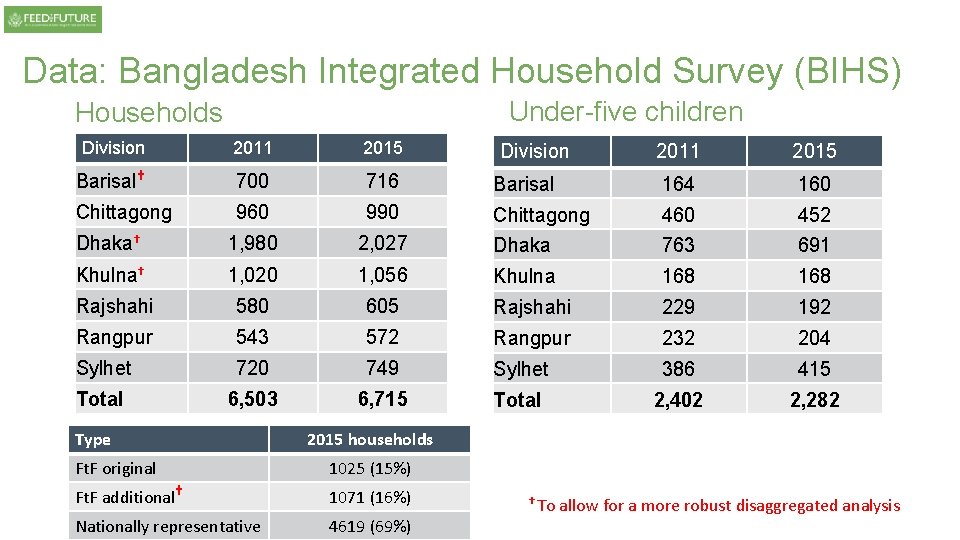
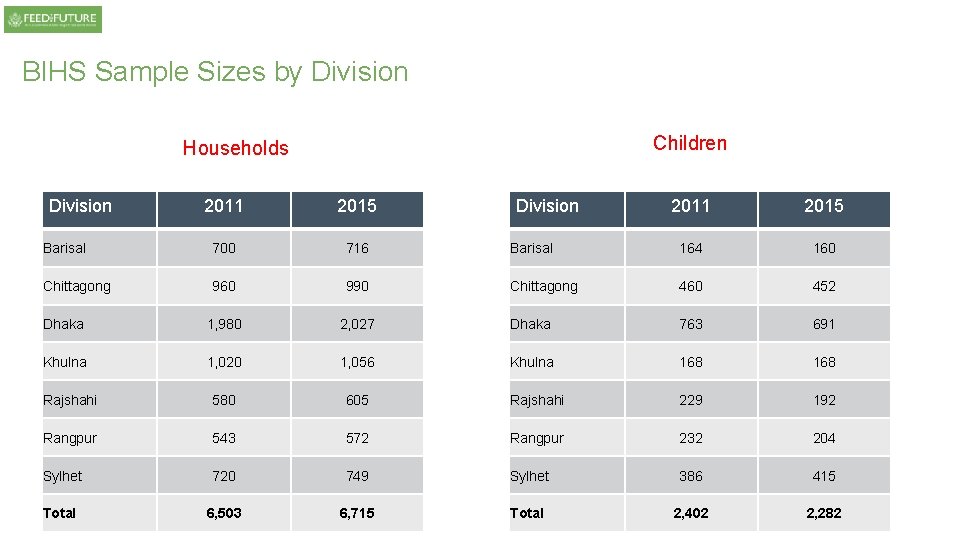
Data: Bangladesh Integrated Household Survey (BIHS) Under-five children Households Division 2011 2015 Barisal† 700 716 Chittagong 960 990 Dhaka† 1, 980 Khulna† 2011 2015 Barisal 164 160 Chittagong 460 452 2, 027 Dhaka 763 691 1, 020 1, 056 Khulna 168 Rajshahi 580 605 Rajshahi 229 192 Rangpur 543 572 Rangpur 232 204 Sylhet 720 749 Sylhet 386 415 Total 6, 503 6, 715 Total 2, 402 2, 282 Type Division 2015 households Ft. F original 1025 (15%) Ft. F additional† 1071 (16%) Nationally representative 4619 (69%) † To allow for a more robust disaggregated analysis
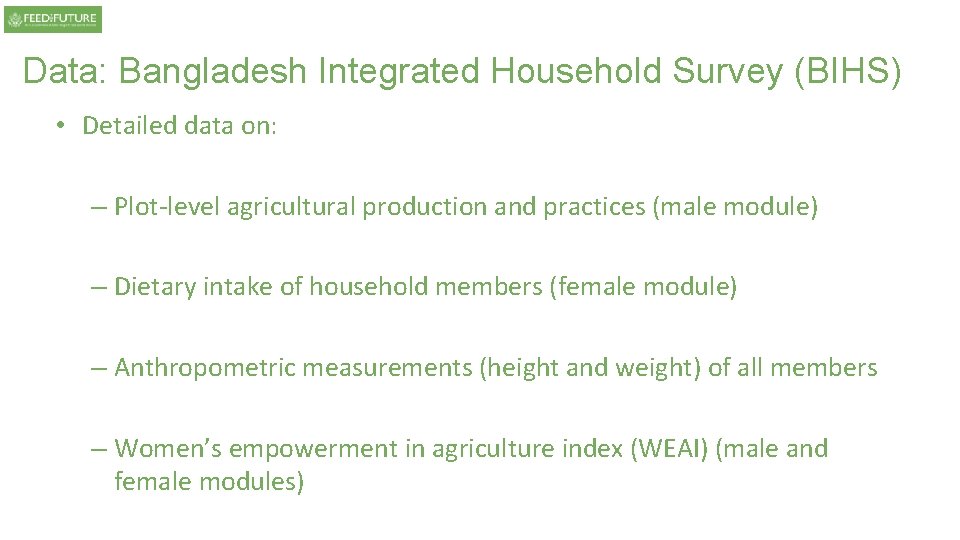
Data: Bangladesh Integrated Household Survey (BIHS) • Detailed data on: – Plot-level agricultural production and practices (male module) – Dietary intake of household members (female module) – Anthropometric measurements (height and weight) of all members – Women’s empowerment in agriculture index (WEAI) (male and female modules)
Topics/issues 1. Weather variability and female farming 2. Cropping patterns and dietary quality 3. Women’s empowerment in agriculture and nutritional outcomes
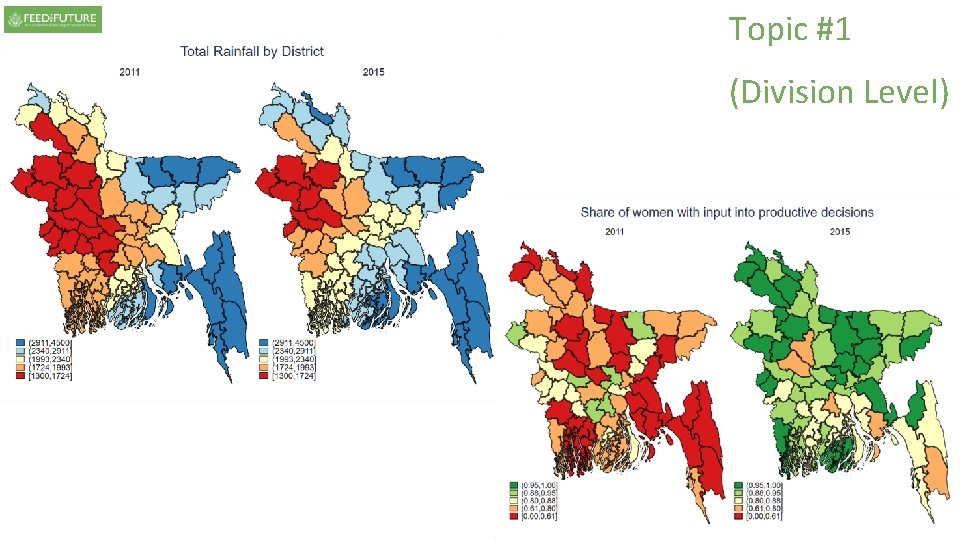
Topic #1 1. Weather variability and female farming
Topic #1 STOP! Can you do it yourself? Please use datafiles: -2. Bangladesh_1950_2015_rainfall -3. Bangladesh_1950_2015_temperature to produce two different graphs with annual distribution of [rainfall, temperature] over time (possibly with smoothed line), in any software you like!
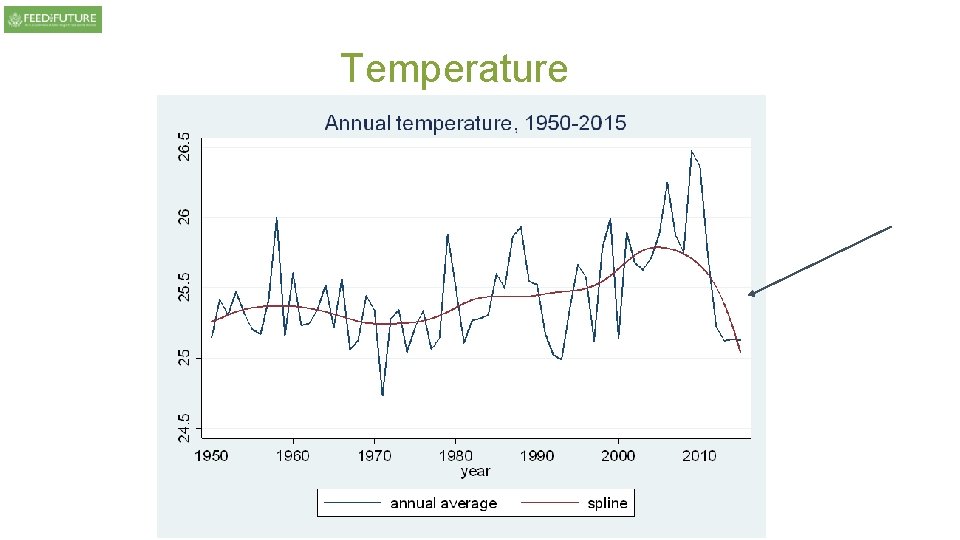
Temperature
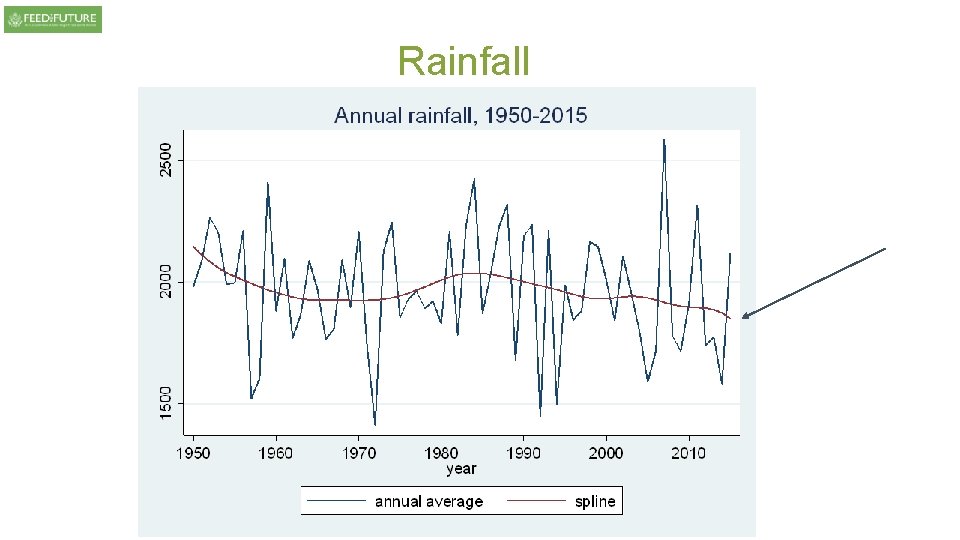
Rainfall
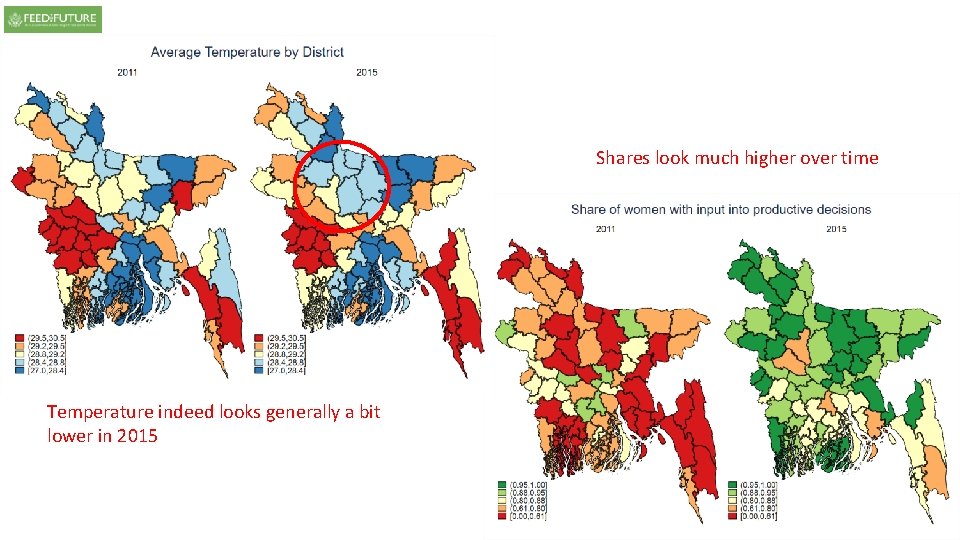
Shares look much higher over time Temperature indeed looks generally a bit lower in 2015
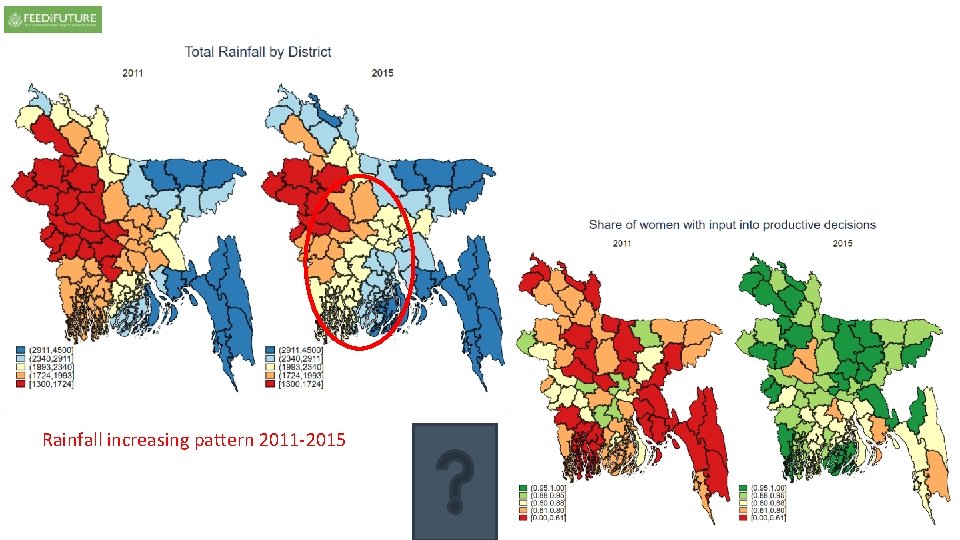
Rainfall increasing pattern 2011 -2015
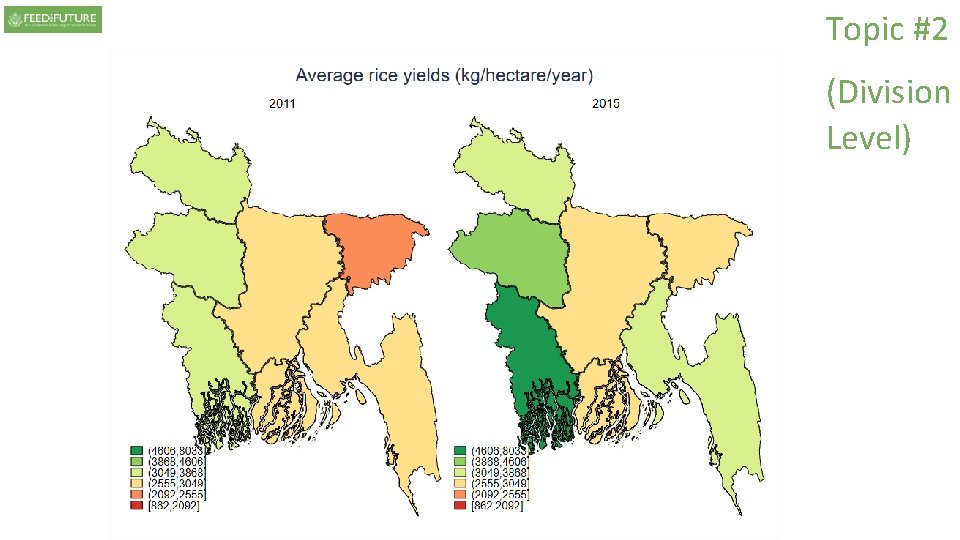
Topic #2 2. Cropping patterns and dietary quality
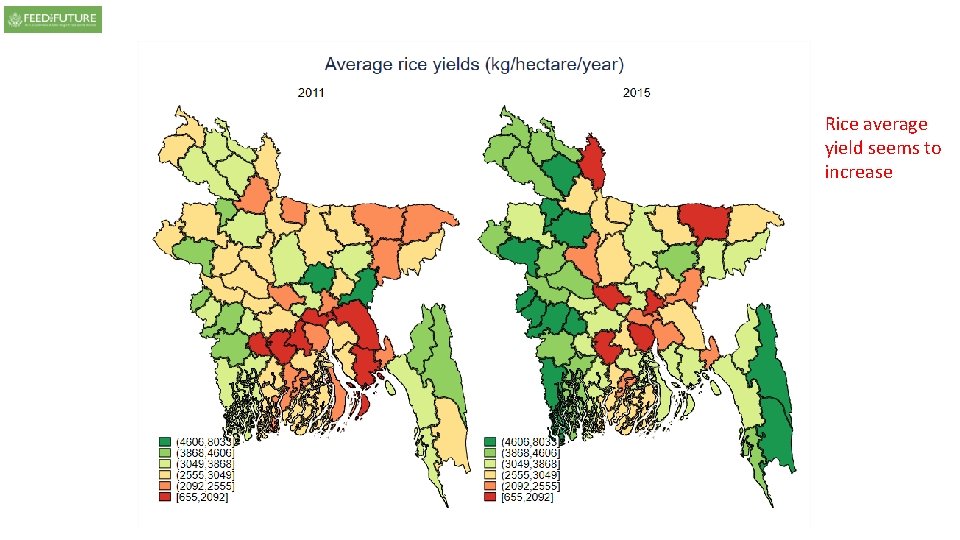
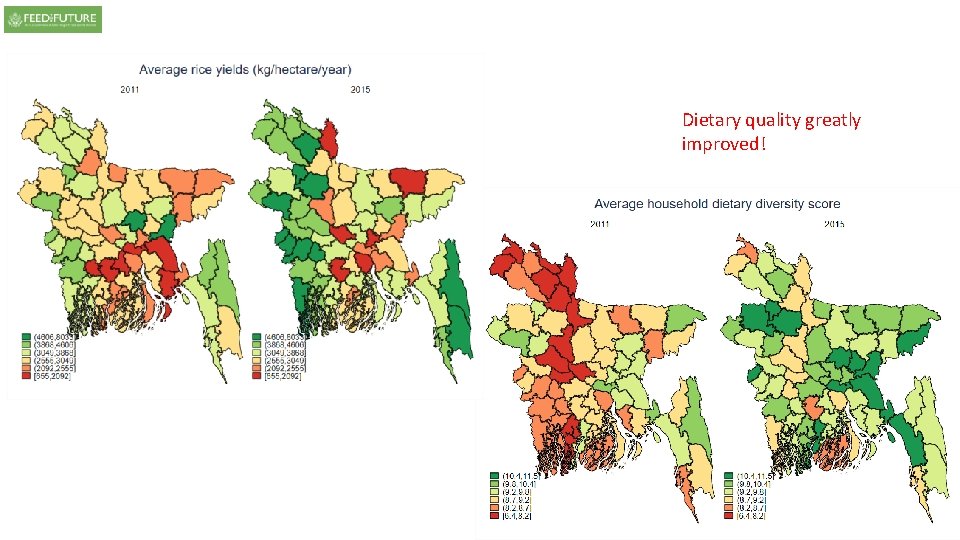
Rice average yield seems to increase
Dietary quality greatly improved!
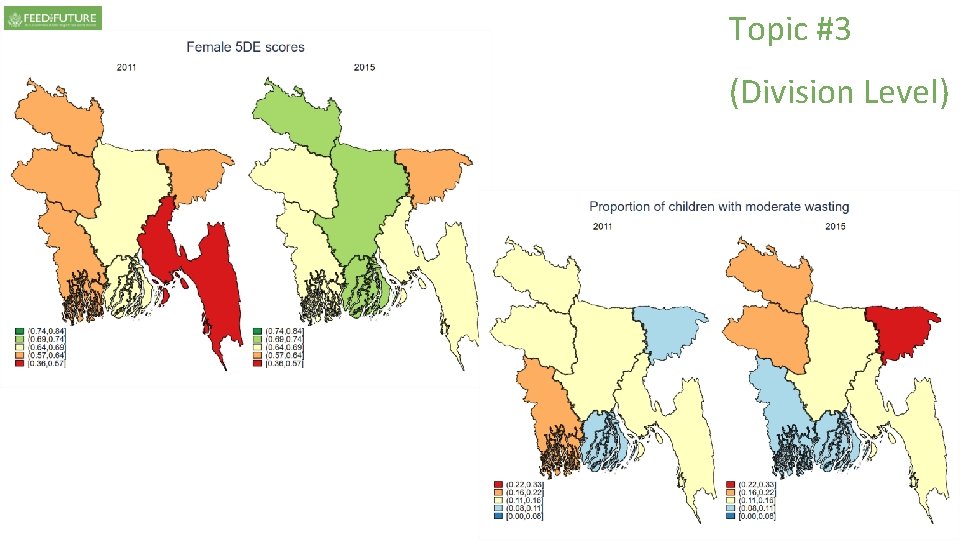
Topic #3 3. Women’s empowerment in agriculture and nutritional outcomes
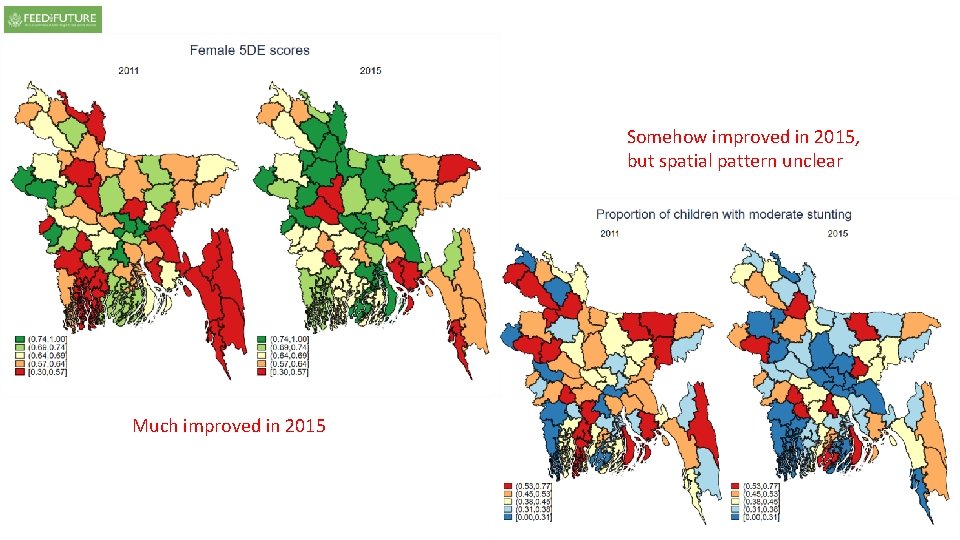
Somehow improved in 2015, but spatial pattern unclear Much improved in 2015
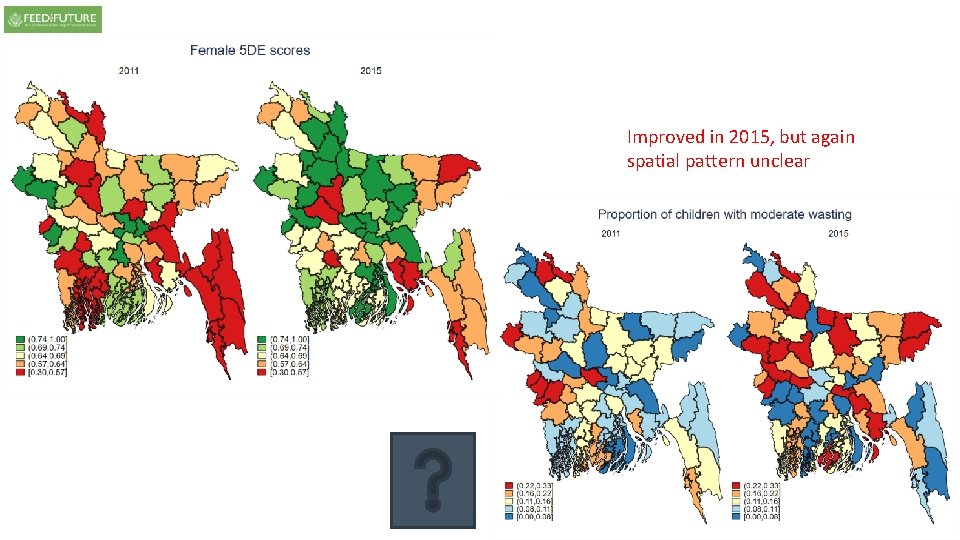
Improved in 2015, but again spatial pattern unclear
Finally, the end!? No, please delete the previous maps!
BIHS Sample Sizes by Division Children Households 2011 2015 Barisal 164 160 Chittagong 460 452 2, 027 Dhaka 763 691 1, 020 1, 056 Khulna 168 Rajshahi 580 605 Rajshahi 229 192 Rangpur 543 572 Rangpur 232 204 Sylhet 720 749 Sylhet 386 415 Total 6, 503 6, 715 Total 2, 402 2, 282 Division 2011 2015 Barisal 700 716 Chittagong 960 990 Dhaka 1, 980 Khulna Division
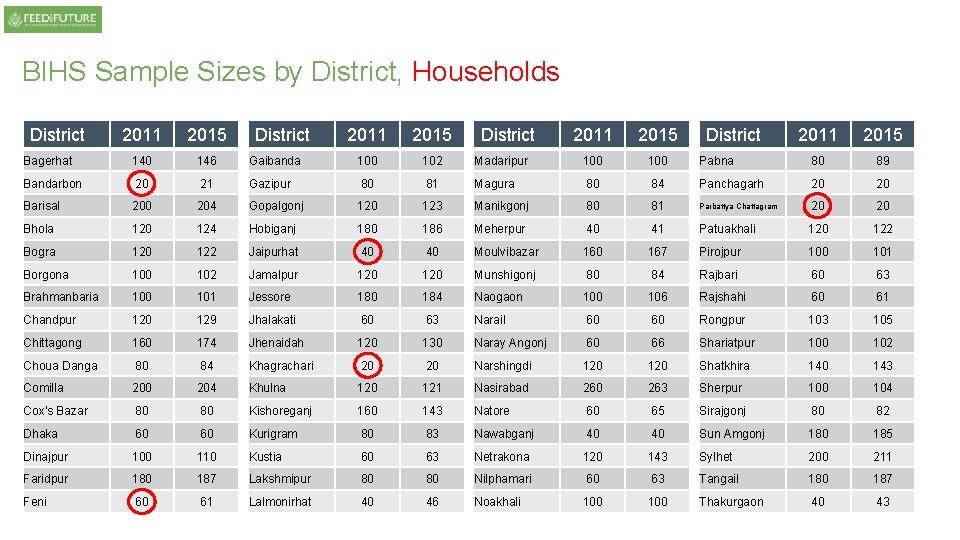
BIHS Sample Sizes by District, Households District 2011 2015 Bagerhat 140 146 Bandarbon 20 Barisal District 2011 2015 Gaibanda 100 102 21 Gazipur 80 204 Gopalgonj Bhola 120 124 Bogra 120 Borgona District 2011 2015 Madaripur 100 81 Magura 80 123 Manikgonj Hobiganj 180 186 122 Jaipurhat 40 102 Jamalpur Brahmanbaria 100 101 Chandpur 120 Chittagong District 2011 2015 Pabna 80 89 84 Panchagarh 20 20 80 81 Parbattya Chattagram 20 20 Meherpur 40 41 Patuakhali 120 122 40 Moulvibazar 160 167 Pirojpur 100 101 120 Munshigonj 80 84 Rajbari 60 63 Jessore 180 184 Naogaon 100 106 Rajshahi 60 61 129 Jhalakati 60 63 Narail 60 60 Rongpur 103 105 160 174 Jhenaidah 120 130 Naray Angonj 60 66 Shariatpur 100 102 Choua Danga 80 84 Khagrachari 20 20 Narshingdi 120 Shatkhira 140 143 Comilla 200 204 Khulna 120 121 Nasirabad 260 263 Sherpur 100 104 Cox's Bazar 80 80 Kishoreganj 160 143 Natore 60 65 Sirajgonj 80 82 Dhaka 60 60 Kurigram 80 83 Nawabganj 40 40 Sun Amgonj 180 185 Dinajpur 100 110 Kustia 60 63 Netrakona 120 143 Sylhet 200 211 Faridpur 180 187 Lakshmipur 80 80 Nilphamari 60 63 Tangail 180 187 Feni 60 61 Lalmonirhat 40 46 Noakhali 100 Thakurgaon 40 43
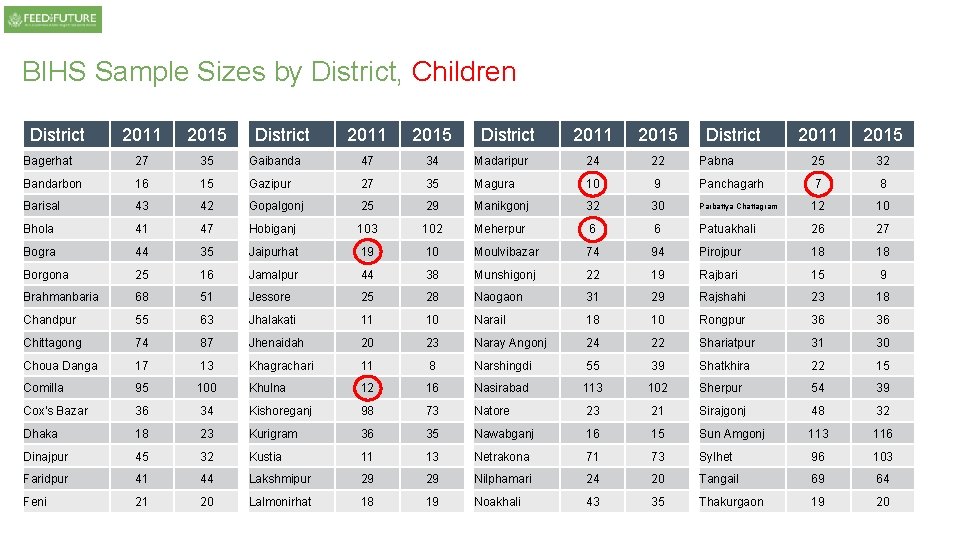
BIHS Sample Sizes by District, Children District 2011 2015 Bagerhat 27 35 Bandarbon 16 Barisal District 2011 2015 Gaibanda 47 34 15 Gazipur 27 43 42 Gopalgonj Bhola 41 47 Bogra 44 Borgona District 2011 2015 Madaripur 24 22 35 Magura 10 9 25 29 Manikgonj 32 30 Hobiganj 103 102 Meherpur 6 35 Jaipurhat 19 10 Moulvibazar 25 16 Jamalpur 44 38 Brahmanbaria 68 51 Jessore 25 Chandpur 55 63 Jhalakati Chittagong 74 87 Choua Danga 17 Comilla District 2011 2015 Pabna 25 32 Panchagarh 7 8 Parbattya Chattagram 12 10 6 Patuakhali 26 27 74 94 Pirojpur 18 18 Munshigonj 22 19 Rajbari 15 9 28 Naogaon 31 29 Rajshahi 23 18 11 10 Narail 18 10 Rongpur 36 36 Jhenaidah 20 23 Naray Angonj 24 22 Shariatpur 31 30 13 Khagrachari 11 8 Narshingdi 55 39 Shatkhira 22 15 95 100 Khulna 12 16 Nasirabad 113 102 Sherpur 54 39 Cox's Bazar 36 34 Kishoreganj 98 73 Natore 23 21 Sirajgonj 48 32 Dhaka 18 23 Kurigram 36 35 Nawabganj 16 15 Sun Amgonj 113 116 Dinajpur 45 32 Kustia 11 13 Netrakona 71 73 Sylhet 96 103 Faridpur 41 44 Lakshmipur 29 29 Nilphamari 24 20 Tangail 69 64 Feni 21 20 Lalmonirhat 18 19 Noakhali 43 35 Thakurgaon 19 20
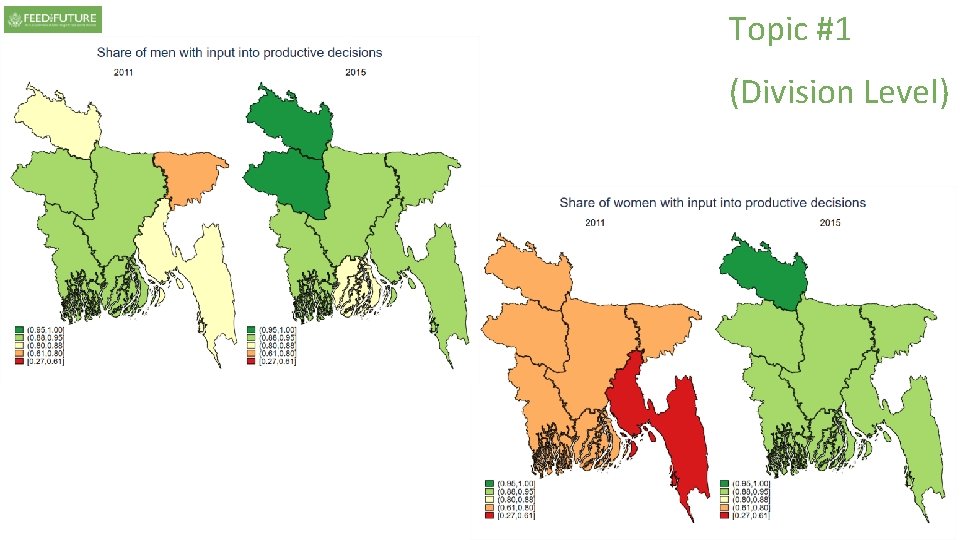
Topic #1 (Division Level)
Topic #1 (Division Level)
Topic #2 (Division Level)
Topic #3 (Division Level)
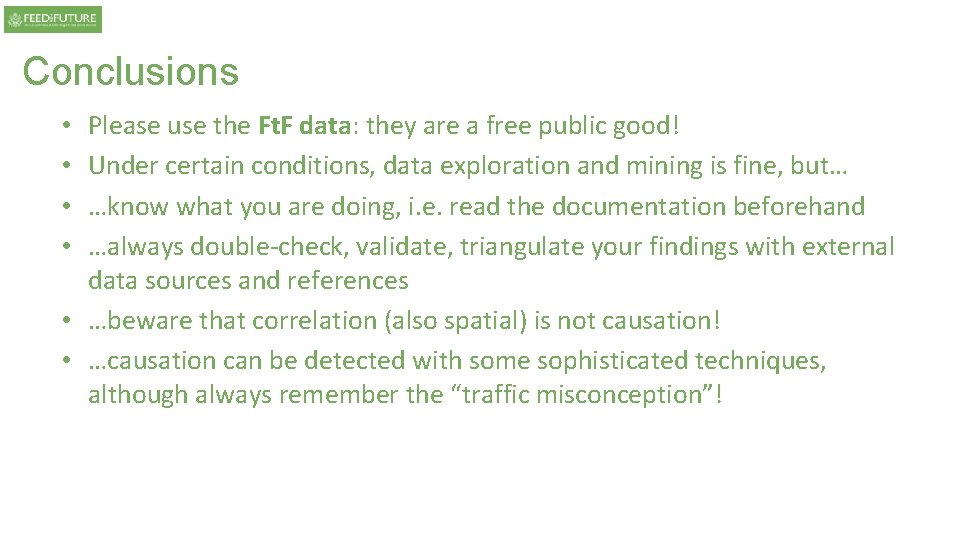
Conclusions Please use the Ft. F data: they are a free public good! Under certain conditions, data exploration and mining is fine, but… …know what you are doing, i. e. read the documentation beforehand …always double-check, validate, triangulate your findings with external data sources and references • …beware that correlation (also spatial) is not causation! • …causation can be detected with some sophisticated techniques, although always remember the “traffic misconception”! • •
Finally, the end!
Data Sources • Ahmed, Akhter. 2013. Bangladesh Integrated Household Survey (BIHS) 2011 -2012. Washington, DC: International Food Policy Research Institute (IFPRI) [dataset] http: //hdl. handle. net/1902. 1/21266. • Fick, S. E. and R. J. Hijmans, 2017. Worldclim 2: New 1 -km spatial resolution climate surfaces for global land area. International Journal of climatology • Funk, Chris, Peterson, Martin Landsfeld, Diego Pedreros, James Verdin, Shraddhanand Shukla, Gregory Husak, James Rowland, Laura Harrison, Andrew Hoell & Joel Michaelsen. Monthly rainfall data for 2011 and 2015 • Global Agro-ecological Assessment for Agriculture in the 21 st Century (GAEZ v 2. 0), FAO/IIASA, 2002 • Guo, Zhe; Cox, Cindy M. 2014. Market access. In Atlas of African agriculture research and development: Revealing agriculture's place in Africa. Sebastian, Kate, Ed. Pp. 66 -67. Washington, D. C. : International Food Policy Research Institute (IFPRI). http: //ebrary. ifpri. org/cdm/ref/collection/p 15738 coll 2/128748 http: //dx. doi. org/10. 2499/9780896298460_28 • International Food Policy Research Institute (IFPRI). 2016. Bangladesh Integrated Household Survey (BIHS) 2015. Washington, DC: International Food Policy Research Institute (IFPRI) [dataset] http: //dx. doi. org/10. 7910/DVN/BXSYEL • ISRIC - World Soil Information • K. Didan. (2015). MOD 13 C 2/MYD 13 C 2 MODIS/Terra Vegetation Indices Monthly L 3 Global 0. 05 Deg CMG V 006. NASA EOSDIS Land Processes DAAC. https: //doi. org/10. 5067/modis/mod 13 c 2. 006 https: //doi. org/10. 5067/modis/myd 13 c 2. 006 • You, L. , U. Wood-Sichra, S. Fritz, Z. Guo, L. See, and J. Koo. 2014. Spatial Production Allocation Model (SPAM) 2005 v 2. 0, accessed online • Z. Wan, S. H. (2015). MOD 11 C 3 MODIS/Terra Land Surface Temperature/Emissivity Monthly L 3 Global 0. 05 Deg CMG V 006. NASA EOSDIS Land Processes DAAC. https: //doi. org/10. 5067/modis/mod 11 c 3. 006