Database to Report 3 Real time report 4

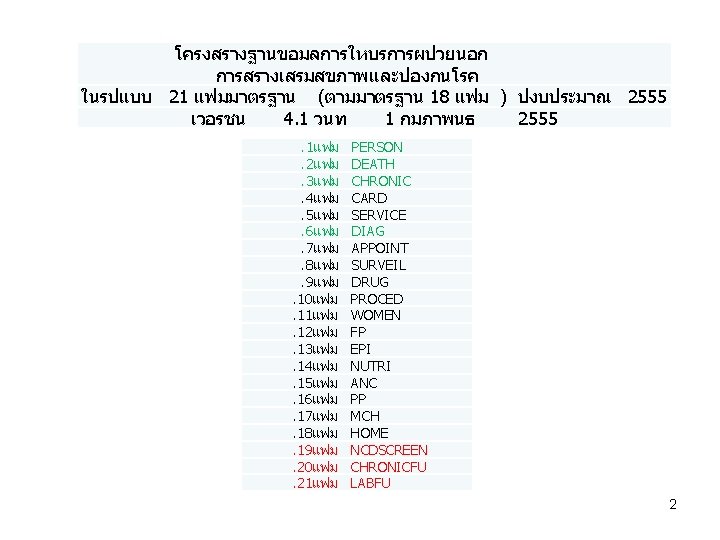

Database to Report 3

Real time report 4
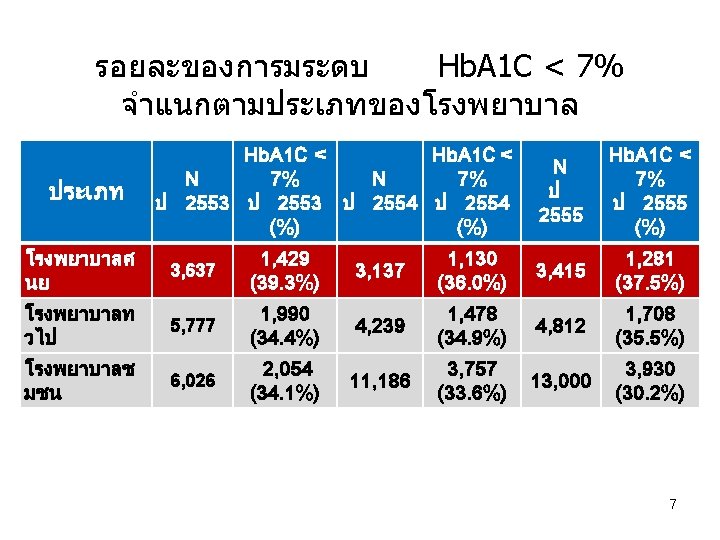

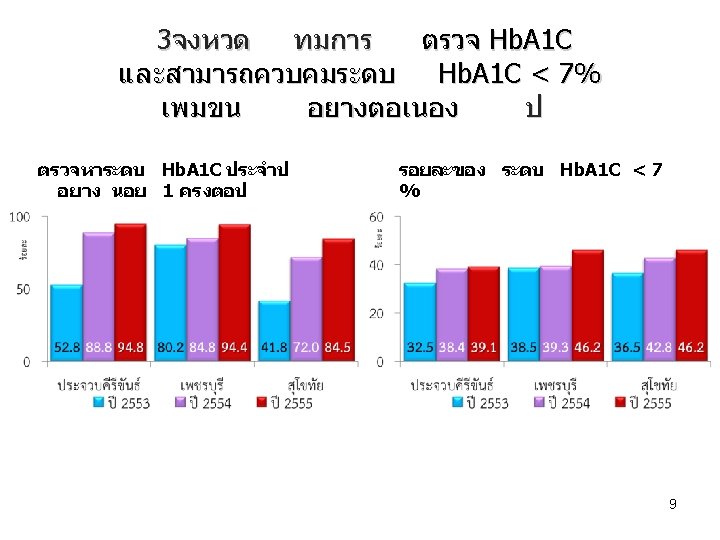
รอยละของการมระดบ Hb. A 1 C < 7% จำแนกตามอาย Hb. A 1 C < N 7% ป 2553 ป 2554 (%) N ป 2555 Hb. A 1 C < 7% ป 2555 (%) < 50 ป 2, 688 668 (24. 9%) 3, 258 816 (25. 0%) 3, 750 959 (25. 6%) 50 - 54 ป 2, 265 648 (28. 6%) 2, 731 811 (29. 7%) 3, 135 821 (26. 2%) 55 – 59 ป 2, 748 910 (33. 1%) 3, 565 1, 149 (32. 2%) 3, 985 1, 190 (29. 9%) ≥ 60 ป 7, 955 3, 346 (42. 1%) 9, 889 3, 947 (39. 9%) 11, 746 4, 578 (39. 0%) 8

Long term trend 10

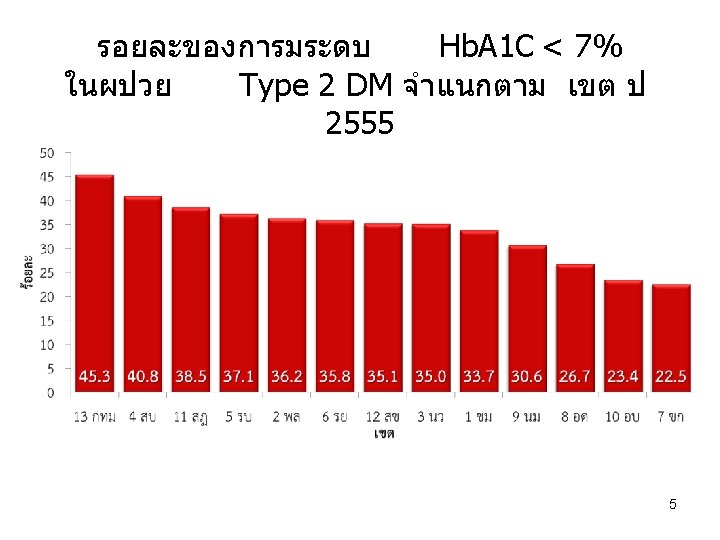
Rate by disease 11

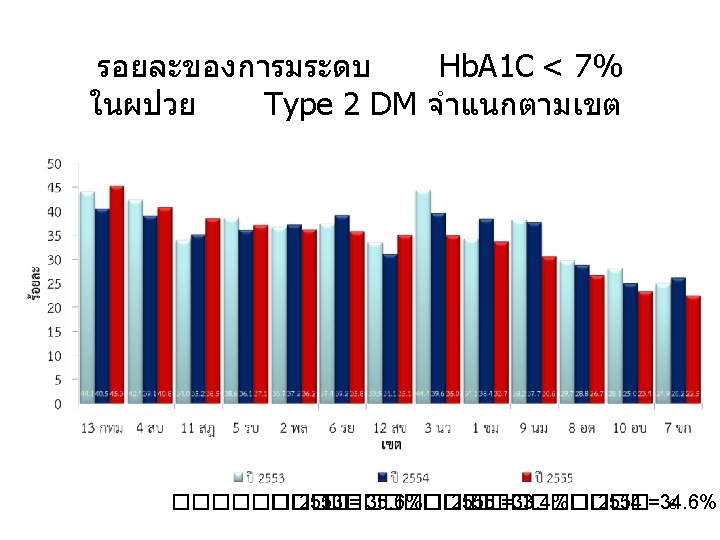
Trend by place 12

Trend of groups of diseases 13

Distribution by time 14

Long term trend 15

Time of the day 16

Time: months of years 17

Epidemic Curve 18

Epidemic Curve 19

Progression Flow diagram 20

Time Series Analysis 21

Path analysis 22

Dynamic path analysis 23

Cluster analysis: Dendrogram 24

CART Classification regression tree 25

Survival analysis 26

Survival analysis 27

Markov model Transitional probability 28

Prediction 29

Prediction 30

Spatial Analysis: Space only John Snow 31

Spatial Temporal Analysis: Space and time 32

Median age at first ? ? ? 33


www. damus. in. th


Data Archival for Maximum Utilization System ��������� �� ��������� www. damus. in. th

Q&A Thank you
- Slides: 40