Database Searches Peptide mass fingerprinting digest Spectrum processing

Database Searches
 Mass spectrum")
Peptide mass fingerprinting digest Spectrum processing MS Protein (gel band or spot) Mass spectrum peptides Protein X theoretical digest 1554. 25 2055. 39 1942. 44 1755. 67 987. 55 855. 34 677. 68 Peak list Search Protein Y theoretical digest Report HIT Protein X Protein Y Protein Z SCORE 1000 50 5 Protein Z theoretical digest

Data processing …before searching • Baseline correct • Noise reduction • Peak deisotope for monoisotopic peaks …what is a monoisotopic peak • Copy to Excel and sort for peak intensity • Search with the top 75 peak ions (peptides)

Generate mass list of all peptides • Computer program used to convert graph data (from mass spectrum) to table data (list of peptide masses) 972. 5954 1007. 467 973. 4202 1023. 462 973. 4202 1036. 481 975. 6104 1066. 493 977. 4627 1082. 488 982. 4603 1105. 601 983. 4991 1153. 524 998. 4552 1172. 581
 1200")
Intensity Simple Mass Spectrum 681. 7 200 400 600 800 1000 Mass (Da) 1200 1400 1600

320. 3 361. 4 607. 7 681. 7 771. 9 992. 1 1165. 2 List of masses Database search using computer algorithm e. g. MASCOT EAT EGR ISPYK EMETR EMANYK PLEASEMAK EATSTHEYAR Sequence matches PLEASEMAKEMANYKRISPYKREMETREATSTHEYAREGREAT

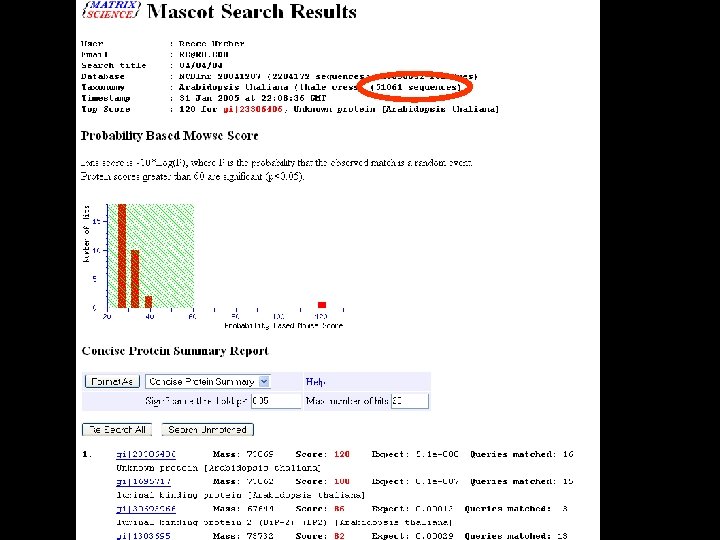
Mass list of all peptides in the mass spectrum copied into here www. matrixscience. com

Coverage = 26% We found peptides that make up only ¼ of the entire protein – but this is enough for a confidentification!

QUESTIONS
- Slides: 10