
Database for Premier Elder Care Team 2 Adrian

Database for Premier Elder Care Team 2 Adrian Quiroz, Gerardo Pacheco Montalvo, Sida Ye, Jonathan Lee, Yu. Hao Jiang, Beril Burcak, Yee Tung Man, Tian Zou, Zak Koltun
Agenda Introduction Simplified EER Diagram Rational Schema Relational Design (Access implementation) Normalization Query and SQL implementation

Introduction Premier Elder Care strives to provide high quality, reliable and affordable care to seniors, persons recovering from surgery, or those who are physically challenged in the comfort of their own homes with the highest possible level of independent living. Introduction EER Diagram Schema Tables Normalization Query & SQL
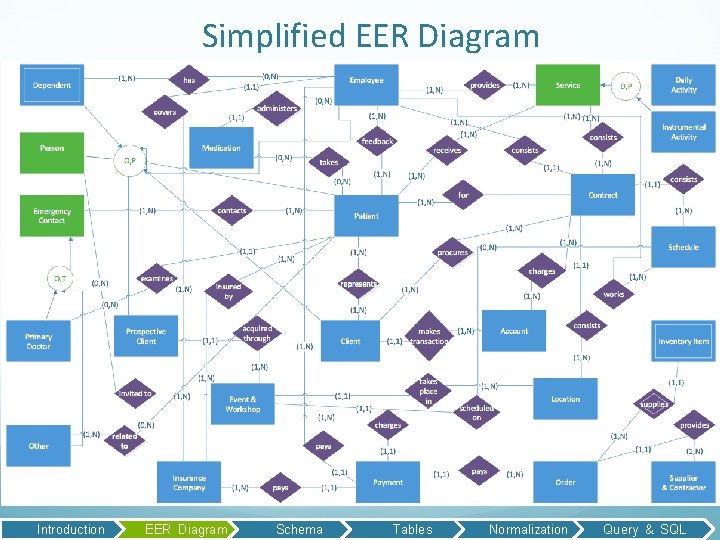
Simplified EER Diagram Introduction EER Diagram Schema Tables Normalization Query & SQL
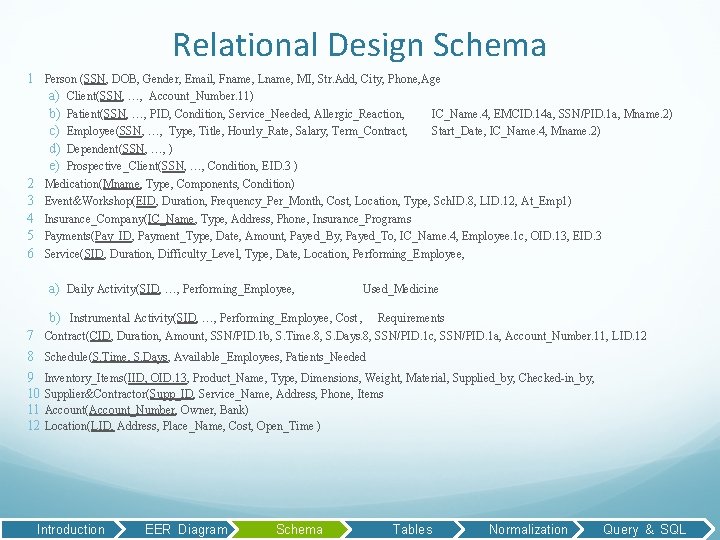
Relational Design Schema 1 Person (SSN, DOB, Gender, Email, Fname, Lname, MI, Str. Add, City, Phone, Age a) Client(SSN, …, Account_Number. 11) b) Patient(SSN, …, PID, Condition, Service_Needed, Allergic_Reaction, IC_Name. 4, EMCID. 14 a, SSN/PID. 1 a, Mname. 2) c) Employee(SSN, …, Type, Title, Hourly_Rate, Salary, Term_Contract, Start_Date, IC_Name. 4, Mname. 2) d) Dependent(SSN, …, ) e) Prospective_Client(SSN, …, Condition, EID. 3 ) 2 Medication(Mname, Type, Components, Condition) 3 Event&Workshop(EID, Duration, Frequency_Per_Month, Cost, Location, Type, Sch. ID. 8, LID. 12, At_Emp 1) 4 Insurance_Company(IC_Name, Type, Address, Phone, Insurance_Programs 5 Payments(Pay_ID, Payment_Type, Date, Amount, Payed_By, Payed_To, IC_Name. 4, Employee. 1 c, OID. 13, EID. 3 6 Service(SID, Duration, Difficulty_Level, Type, Date, Location, Performing_Employee, a) Daily Activity(SID, …, Performing_Employee, Used_Medicine b) Instrumental Activity(SID, …, Performing_Employee, Cost , Requirements 7 Contract(CID, Duration, Amount, SSN/PID. 1 b, S. Time. 8, S. Days. 8, SSN/PID. 1 c, SSN/PID. 1 a, Account_Number. 11, LID. 12 8 Schedule(S. Time, S. Days, Available_Employees, Patients_Needed 9 10 11 12 Inventory_Items(IID, OID. 13, Product_Name, Type, Dimensions, Weight, Material, Supplied_by, Checked-in_by, Supplier&Contractor(Supp_ID, Service_Name, Address, Phone, Items Account(Account_Number, Owner, Bank) Location(LID, Address, Place_Name, Cost, Open_Time ) Introduction EER Diagram Schema Tables Normalization Query & SQL
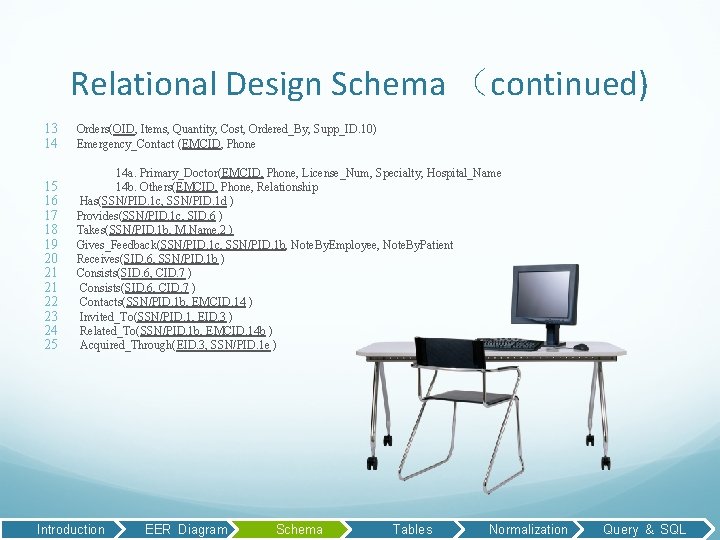
Relational Design Schema (continued) 13 14 Orders(OID, Items, Quantity, Cost, Ordered_By, Supp_ID. 10) Emergency_Contact (EMCID, Phone 15 16 17 18 19 20 21 21 22 23 24 25 14 a. Primary_Doctor(EMCID, Phone, License_Num, Specialty, Hospital_Name 14 b. Others(EMCID, Phone, Relationship Has(SSN/PID. 1 c, SSN/PID. 1 d ) Provides(SSN/PID. 1 c, SID. 6 ) Takes(SSN/PID. 1 b, M. Name. 2 ) Gives_Feedback(SSN/PID. 1 c, SSN/PID. 1 b, Note. By. Employee, Note. By. Patient Receives(SID. 6, SSN/PID. 1 b ) Consists(SID. 6, CID. 7 ) Contacts(SSN/PID. 1 b, EMCID. 14 ) Invited_To(SSN/PID. 1, EID. 3 ) Related_To(SSN/PID. 1 b, EMCID. 14 b ) Acquired_Through(EID. 3, SSN/PID. 1 e ) Introduction EER Diagram Schema Tables Normalization Query & SQL

Access implementation of relational design Introduction EER Diagram Schema Tables Normalization Query & SQL
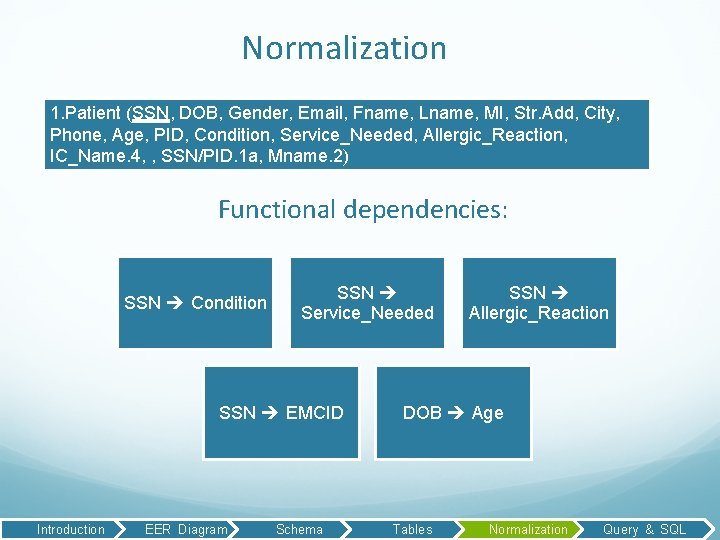
Normalization 1. Patient (SSN, DOB, Gender, Email, Fname, Lname, MI, Str. Add, City, Phone, Age, PID, Condition, Service_Needed, Allergic_Reaction, IC_Name. 4, , SSN/PID. 1 a, Mname. 2) Functional dependencies: SSN Condition SSN Service_Needed SSN EMCID Introduction EER Diagram Schema SSN Allergic_Reaction DOB Age Tables Normalization Query & SQL
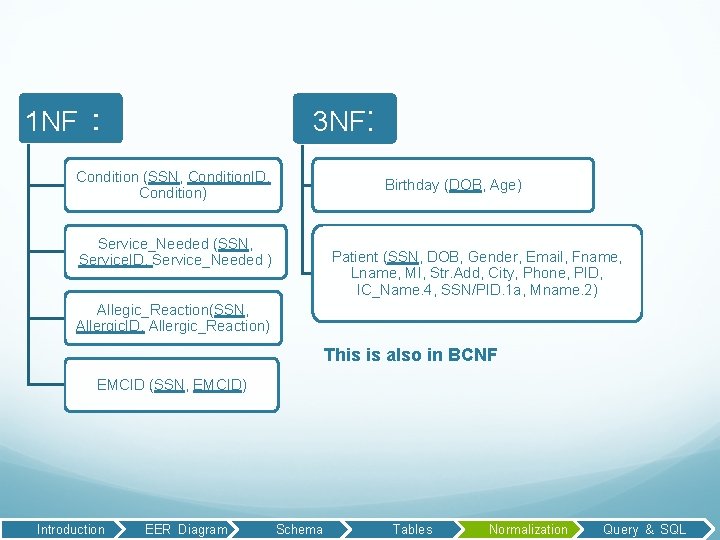
3 NF: 1 NF: Condition (SSN, Condition. ID, Condition) Birthday (DOB, Age) Service_Needed (SSN, Service. ID, Service_Needed ) Patient (SSN, DOB, Gender, Email, Fname, Lname, MI, Str. Add, City, Phone, PID, IC_Name. 4, SSN/PID. 1 a, Mname. 2) Allegic_Reaction(SSN, Allergic. ID, Allergic_Reaction) This is also in BCNF EMCID (SSN, EMCID) Introduction EER Diagram Schema Tables Normalization Query & SQL
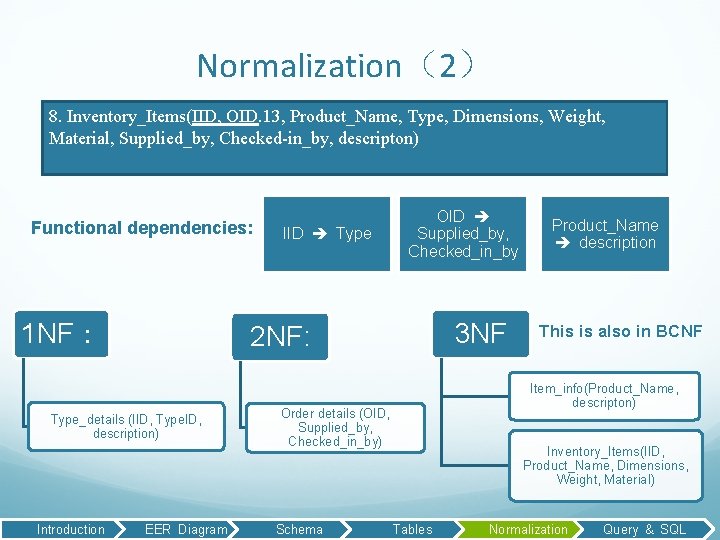
Normalization(2) 8. Inventory_Items(IID, OID. 13, Product_Name, Type, Dimensions, Weight, Material, Supplied_by, Checked-in_by, descripton) Functional dependencies: 1 NF: IID Type 3 NF 2 NF: Type_details (IID, Type. ID, description) Introduction OID Supplied_by, Checked_in_by EER Diagram Order details (OID, Supplied_by, Checked_in_by) Schema Tables Product_Name description This is also in BCNF Item_info(Product_Name, descripton) Inventory_Items(IID, Product_Name, Dimensions, Weight, Material) Normalization Query & SQL
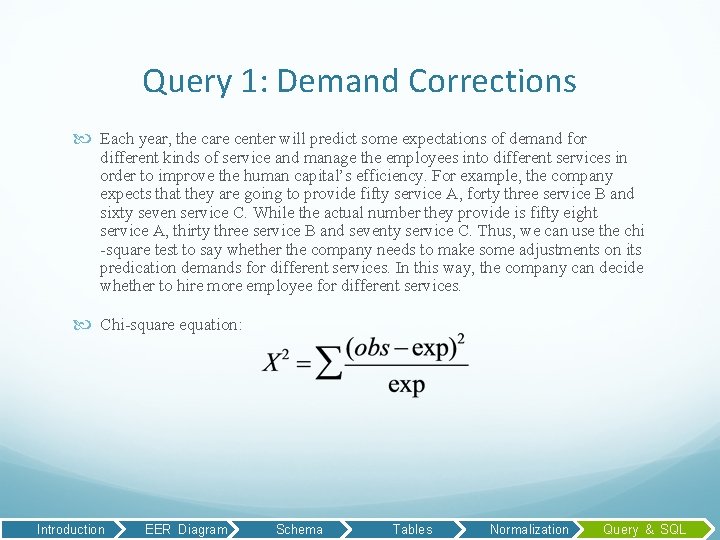
Query 1: Demand Corrections Each year, the care center will predict some expectations of demand for different kinds of service and manage the employees into different services in order to improve the human capital’s efficiency. For example, the company expects that they are going to provide fifty service A, forty three service B and sixty seven service C. While the actual number they provide is fifty eight service A, thirty three service B and seventy service C. Thus, we can use the chi -square test to say whether the company needs to make some adjustments on its predication demands for different services. In this way, the company can decide whether to hire more employee for different services. Chi-square equation: Introduction EER Diagram Schema Tables Normalization Query & SQL
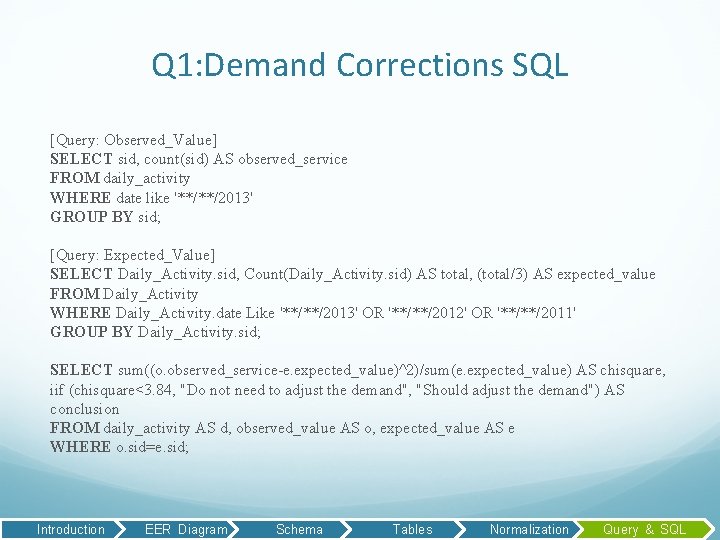
Q 1: Demand Corrections SQL [Query: Observed_Value] SELECT sid, count(sid) AS observed_service FROM daily_activity WHERE date like '**/**/2013' GROUP BY sid; [Query: Expected_Value] SELECT Daily_Activity. sid, Count(Daily_Activity. sid) AS total, (total/3) AS expected_value FROM Daily_Activity WHERE Daily_Activity. date Like '**/**/2013' OR '**/**/2012' OR '**/**/2011' GROUP BY Daily_Activity. sid; SELECT sum((o. observed_service-e. expected_value)^2)/sum(e. expected_value) AS chisquare, iif (chisquare<3. 84, "Do not need to adjust the demand", "Should adjust the demand") AS conclusion FROM daily_activity AS d, observed_value AS o, expected_value AS e WHERE o. sid=e. sid; Introduction EER Diagram Schema Tables Normalization Query & SQL
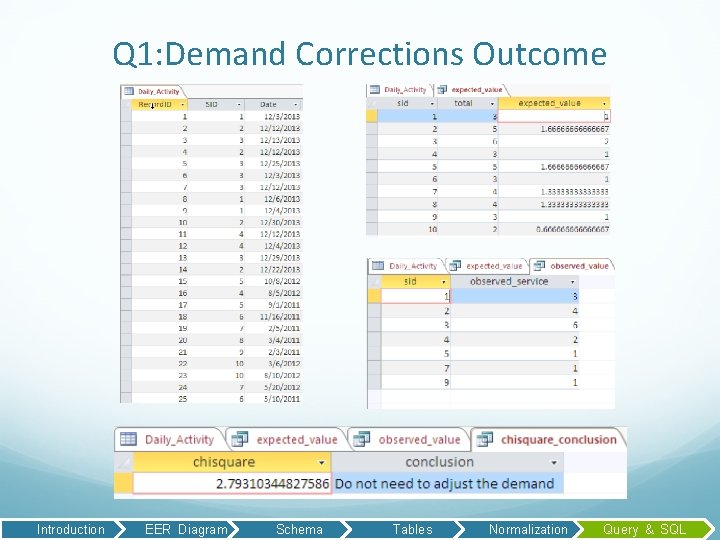
Q 1: Demand Corrections Outcome Introduction EER Diagram Schema Tables Normalization Query & SQL
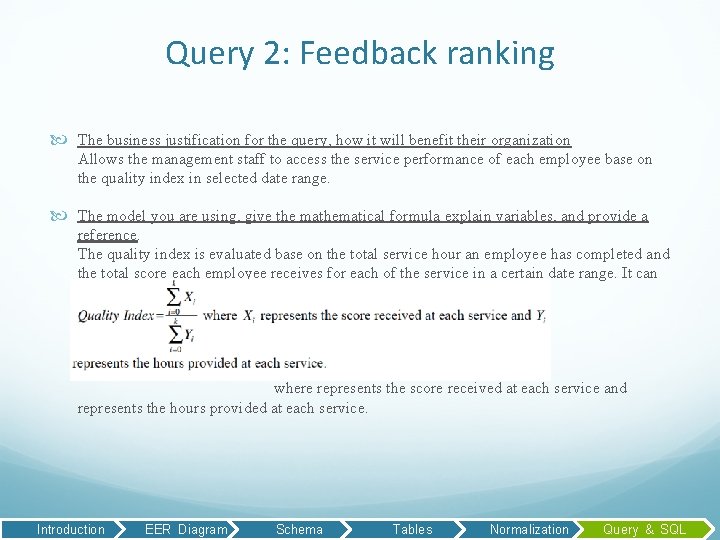
Query 2: Feedback ranking The business justification for the query, how it will benefit their organization Allows the management staff to access the service performance of each employee base on the quality index in selected date range. The model you are using, give the mathematical formula explain variables, and provide a reference. The quality index is evaluated base on the total service hour an employee has completed and the total score each employee receives for each of the service in a certain date range. It can be evaluated as where represents the score received at each service and represents the hours provided at each service. Introduction EER Diagram Schema Tables Normalization Query & SQL

Q 2: Feedback ranking SQL & outcome SELECT S. SSN_Employee, ROUND((SUM(G. Rate_Score)/SUM(S. Duration_hrs)), 3) AS quality_index FROM Service AS S, Gives_Feedback AS G WHERE (((S. Date) Between [Start Date] And [End Date])) GROUP BY S. SSN_Employee ORDER BY quality_index DESC; Introduction EER Diagram Schema Tables Normalization Query & SQL
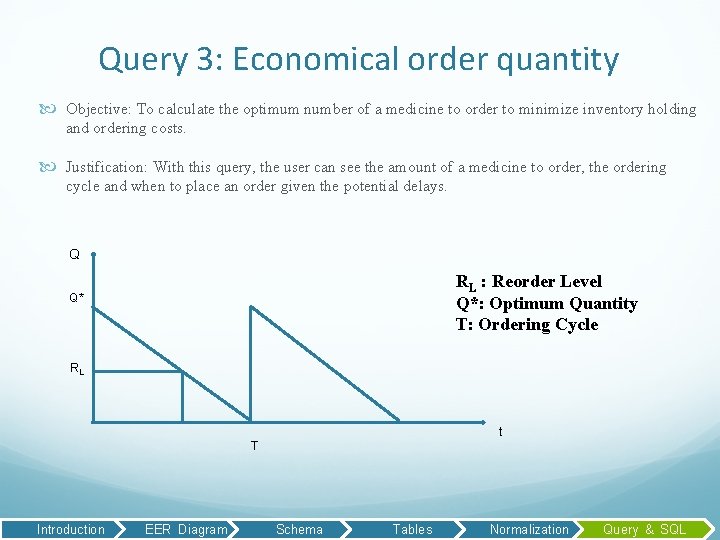
Query 3: Economical order quantity Objective: To calculate the optimum number of a medicine to order to minimize inventory holding and ordering costs. Justification: With this query, the user can see the amount of a medicine to order, the ordering cycle and when to place an order given the potential delays. Q RL : Reorder Level Q*: Optimum Quantity T: Ordering Cycle Q* RL t T Introduction EER Diagram Schema Tables Normalization Query & SQL
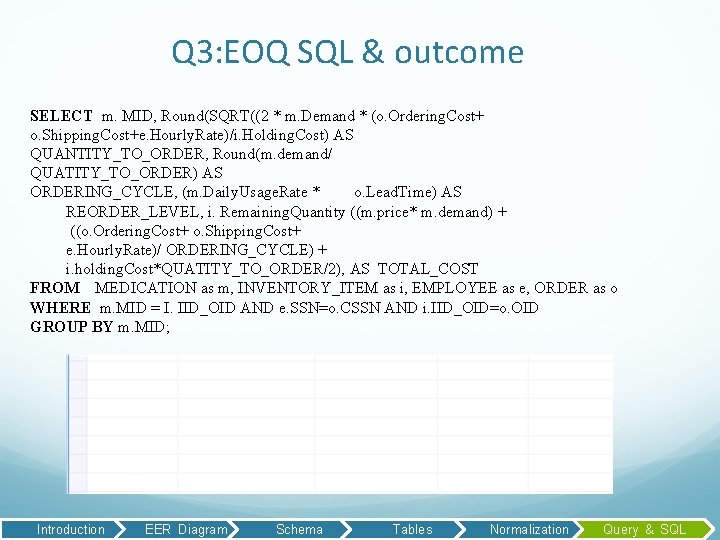
Q 3: EOQ SQL & outcome SELECT m. MID, Round(SQRT((2 * m. Demand * (o. Ordering. Cost+ o. Shipping. Cost+e. Hourly. Rate)/i. Holding. Cost) AS QUANTITY_TO_ORDER, Round(m. demand/ QUATITY_TO_ORDER) AS ORDERING_CYCLE, (m. Daily. Usage. Rate * o. Lead. Time) AS REORDER_LEVEL, i. Remaining. Quantity ((m. price* m. demand) + ((o. Ordering. Cost+ o. Shipping. Cost+ e. Hourly. Rate)/ ORDERING_CYCLE) + i. holding. Cost*QUATITY_TO_ORDER/2), AS TOTAL_COST FROM MEDICATION as m, INVENTORY_ITEM as i, EMPLOYEE as e, ORDER as o WHERE m. MID = I. IID_OID AND e. SSN=o. CSSN AND i. IID_OID=o. OID GROUP BY m. MID; Introduction EER Diagram Schema Tables Normalization Query & SQL
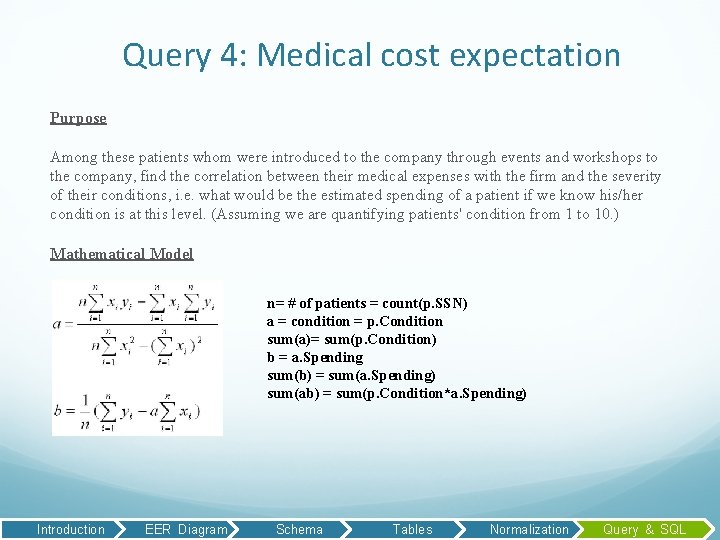
Query 4: Medical cost expectation Purpose Among these patients whom were introduced to the company through events and workshops to the company, find the correlation between their medical expenses with the firm and the severity of their conditions, i. e. what would be the estimated spending of a patient if we know his/her condition is at this level. (Assuming we are quantifying patients' condition from 1 to 10. ) Mathematical Model n= # of patients = count(p. SSN) a = condition = p. Condition sum(a)= sum(p. Condition) b = a. Spending sum(b) = sum(a. Spending) sum(ab) = sum(p. Condition*a. Spending) Introduction EER Diagram Schema Tables Normalization Query & SQL
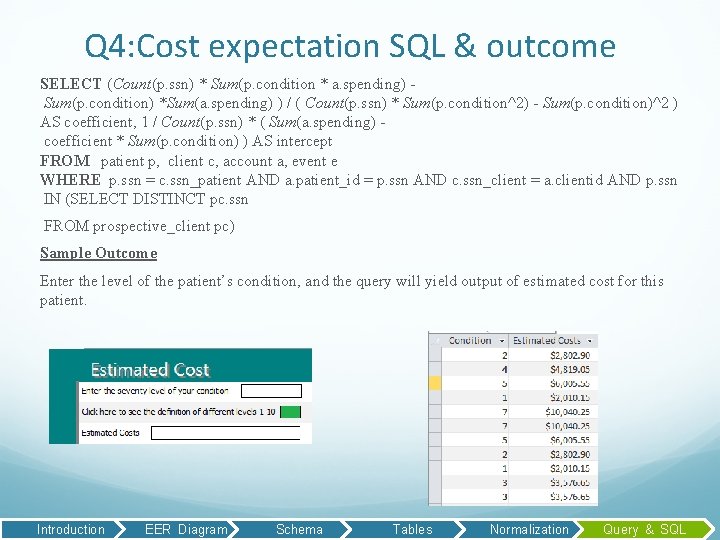
Q 4: Cost expectation SQL & outcome SELECT (Count(p. ssn) * Sum(p. condition * a. spending) Sum(p. condition) *Sum(a. spending) ) / ( Count(p. ssn) * Sum(p. condition^2) - Sum(p. condition)^2 ) AS coefficient, 1 / Count(p. ssn) * ( Sum(a. spending) coefficient * Sum(p. condition) ) AS intercept FROM patient p, client c, account a, event e WHERE p. ssn = c. ssn_patient AND a. patient_id = p. ssn AND c. ssn_client = a. clientid AND p. ssn IN (SELECT DISTINCT pc. ssn FROM prospective_client pc) Sample Outcome Enter the level of the patient’s condition, and the query will yield output of estimated cost for this patient. Introduction EER Diagram Schema Tables Normalization Query & SQL
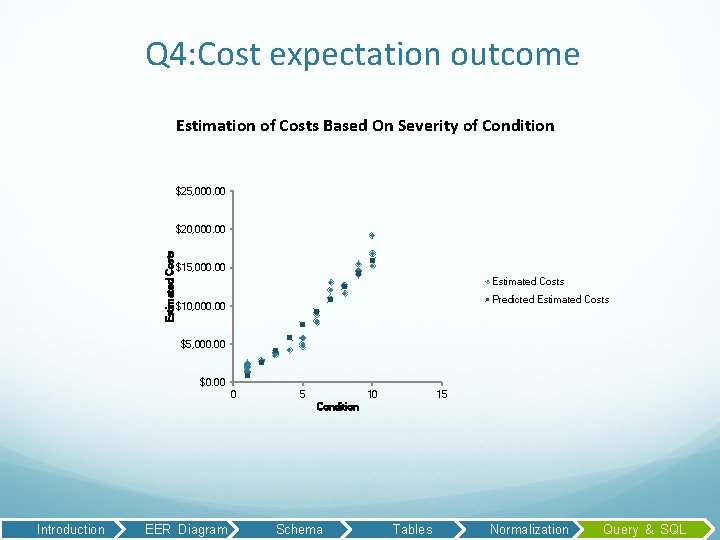
Q 4: Cost expectation outcome Estimation of Costs Based On Severity of Condition $25, 000. 00 Estimated Costs $20, 000. 00 $15, 000. 00 Estimated Costs Predicted Estimated Costs $10, 000. 00 $5, 000. 00 $0. 00 0 5 10 15 Condition Introduction EER Diagram Schema Tables Normalization Query & SQL
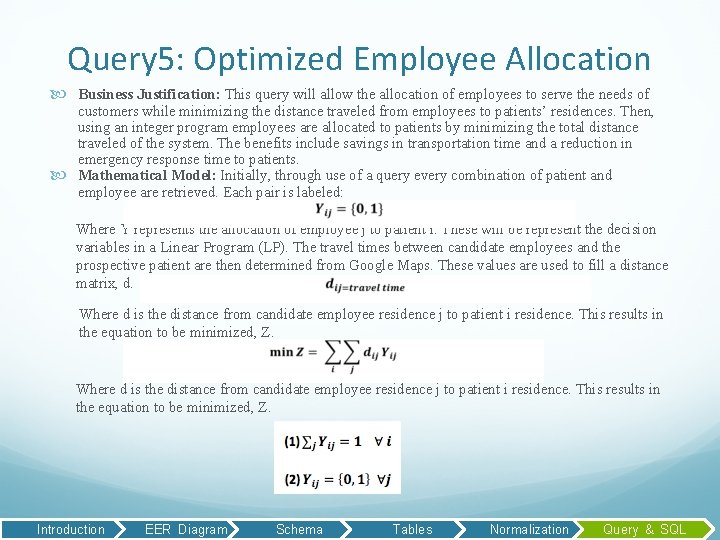
Query 5: Optimized Employee Allocation Business Justification: This query will allow the allocation of employees to serve the needs of customers while minimizing the distance traveled from employees to patients’ residences. Then, using an integer program employees are allocated to patients by minimizing the total distance traveled of the system. The benefits include savings in transportation time and a reduction in emergency response time to patients. Mathematical Model: Initially, through use of a query every combination of patient and employee are retrieved. Each pair is labeled: Where Y represents the allocation of employee j to patient i. These will be represent the decision variables in a Linear Program (LP). The travel times between candidate employees and the prospective patient are then determined from Google Maps. These values are used to fill a distance matrix, d. Where d is the distance from candidate employee residence j to patient i residence. This results in the equation to be minimized, Z. Introduction EER Diagram Schema Tables Normalization Query & SQL
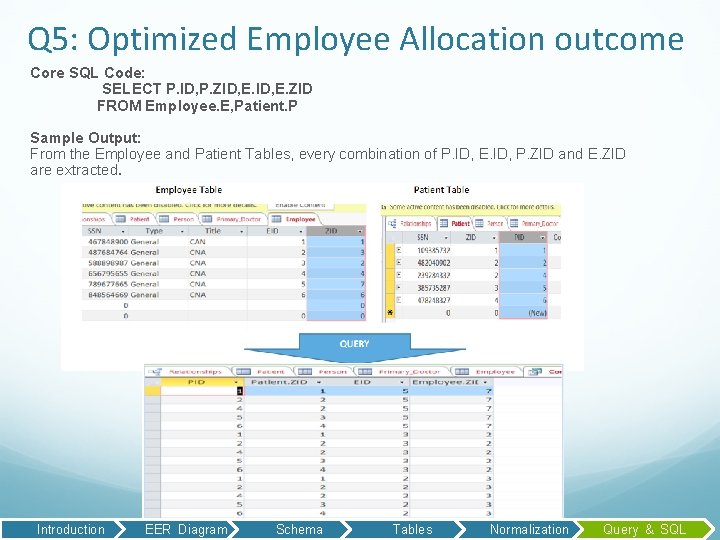
Q 5: Optimized Employee Allocation outcome Core SQL Code: SELECT P. ID, P. ZID, E. ZID FROM Employee. E, Patient. P Sample Output: From the Employee and Patient Tables, every combination of P. ID, E. ID, P. ZID and E. ZID are extracted. Introduction EER Diagram Schema Tables Normalization Query & SQL
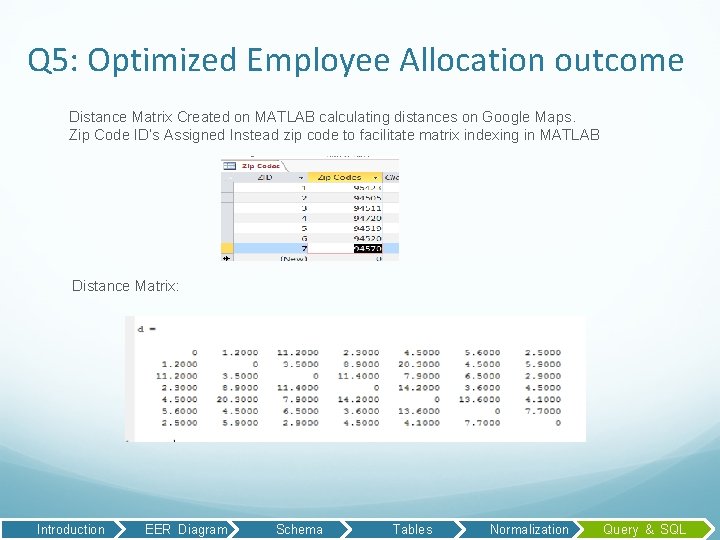
Q 5: Optimized Employee Allocation outcome Distance Matrix Created on MATLAB calculating distances on Google Maps. Zip Code ID’s Assigned Instead zip code to facilitate matrix indexing in MATLAB Distance Matrix: Introduction EER Diagram Schema Tables Normalization Query & SQL
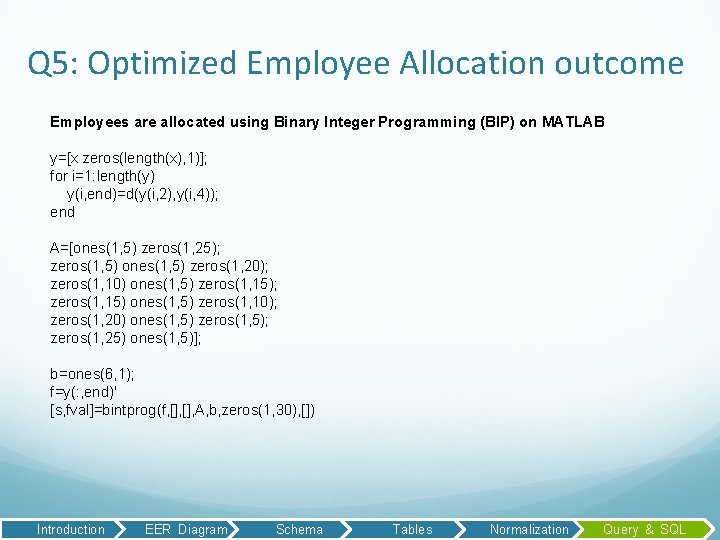
Q 5: Optimized Employee Allocation outcome Employees are allocated using Binary Integer Programming (BIP) on MATLAB y=[x zeros(length(x), 1)]; for i=1: length(y) y(i, end)=d(y(i, 2), y(i, 4)); end A=[ones(1, 5) zeros(1, 25); zeros(1, 5) ones(1, 5) zeros(1, 20); zeros(1, 10) ones(1, 5) zeros(1, 15); zeros(1, 15) ones(1, 5) zeros(1, 10); zeros(1, 20) ones(1, 5) zeros(1, 5); zeros(1, 25) ones(1, 5)]; b=ones(6, 1); f=y(: , end)' [s, fval]=bintprog(f, [], A, b, zeros(1, 30), []) Introduction EER Diagram Schema Tables Normalization Query & SQL

Thank you
- Slides: 25