DATABASE DESIGN DATABASE DESIGN Database design is the

DATABASE DESIGN

DATABASE DESIGN • Database design is the process of producing a detailed data model of a database. • This physical & logical data model contains all the needed logical and physical design • A fully designed data model contains detailed attributes for each entity. • Data base design describe overall database system
 Determine the purpose")
DATABASE DESIGN The design process consists of the following steps: 1) Determine the purpose of database This helps to prepare the remaining steps. 2) Find and organize the information required Gather all types of information to record in the database. • 3) Divide the information into tables • • Divide the information items into major entities or subjects, to form a table.
 Turn information items into columns •")
DATABASE DESIGN • The design process • 4) Turn information items into columns • Decide what information, want to store in each table. • What are the items becomes a field, in the table. • 5) Specify primary keys • Decide each table’s primary key. • The primary key : - used to uniquely identify each row
 Set up the table relationships • Decide how the data")
DATABASE DESIGN • 6) Set up the table relationships • Decide how the data in one table is related to the data in other tables. • Connect tables using reference key • 7) Refine the design • Analyze the design for errors. • Create the tables and add a few sample data.
 • In 1976 proposed")
DATABASE DESIGN AND ER DIAGRAMS • ER Diagram (Entity-Relationship Diagram) • In 1976 proposed by Peter Chen • ER diagram is detailed, logical representation of the data for an organization or business area • Three principal components of ER Diagram • Entity set • Attribute • Relationship

DATABASE DESIGN AND ER DIAGRAMS • ER Diagram symbols • Entity weak entity • Attribute Key attribute • Derived attribute • Relationship • Identifying relationship

DATABASE DESIGN AND ER DIAGRAMS • Entity Set • An Entity can be a person, place, object or concept in the real world • Object with physical existence : person, car, book, etc • Object with conceptual existence: university, course, loan etc • Entity set : collection of entities that shares a common properties or characteristics • Eg • Book : entity collection of book entity set •

DATABASE DESIGN AND ER DIAGRAMS • Attribute • Is the property or characteristics of the entity • Eg: Age Name Sex Employee • Employee is an entity with following attributes • Name, Age, Sex
 Simple")
DATABASE DESIGN AND ER DIAGRAMS • Types of Attributes • • • 1) Simple Attribute 2) Composite Attribute 3) Single valued Attribute 4) Multi valued Attribute 5) Derived Attribute 6) Null Attribute

DATABASE DESIGN AND ER DIAGRAMS • Types of Attributes • Simple Attribute : it cannot be further divided into smaller part & represents the basic meaning • Eg • Here first_name & • Last_name are • Examples of simple attributes, because it cannot be further divided and it having basis meaning

DATABASE DESIGN AND ER DIAGRAMS • Types of Attributes • composite Attribute : it can be further divided into smaller units & each individual unit contains a specific meaning • Eg • Here Name can be • Divided into smaller units, First_name & Last_name and both having specific meaning

DATABASE DESIGN AND ER DIAGRAMS • Types of Attributes • Single valued Attribute : it has a single value for a particular entity • Eg • Here age is the • example for single values attribute

DATABASE DESIGN AND ER DIAGRAMS • Types of Attributes • Multi value Attribute : it has more than one value for a particular entity • Eg • Here Skill attribute is an example, because an employee can have more than one skills

DATABASE DESIGN AND ER DIAGRAMS • Types of Attributes • Derived Attribute : that are not stored directly, but can be derived from the stored attribute • Eg • Here emp_year attribute is an example, because year of service can be calculated from the current date and emp_joined date

DATABASE DESIGN AND ER DIAGRAMS • Types of Attributes • Null Attribute : some case a particular entity may not have a value for an attribute • Eg • Apartment number attribute of an address applies only to address that are in apartments, not to other residential address

DATABASE DESIGN AND ER DIAGRAMS • Key attribute of an entity set • An attribute whose value is unique for each individual entity in the entity set • Eg: Rollno number is Unique for each students in the class

DATABASE DESIGN AND ER DIAGRAMS • • • Strong & weak Entity types Strong Entity It contains a key attribute It is an independent entity set It is used to identify entity uniquely Weak entity it does not contain a key attribute It is an dependent entity set It cannot be used to identify entity uniquely Eg Employee strong entity type, because it contains Emp_no as a key attribute Dependent weak entity type, because it has no key attribute

DATABASE DESIGN AND ER DIAGRAMS • • Entity Relationships It connect two or more entity sets Eg: opts relationship between student & course

DATABASE DESIGN AND ER DIAGRAMS • Degree of relationship • No of participating entity types • Relationship between 2 entities called binary relationship • Relationship between 3 entities called ternary relationship • Relationship between n entities called n-ray relationship
 • No of entity of")
DATABASE DESIGN AND ER DIAGRAMS • Relationship cardinality (Mapping) • No of entity of an entity set participate in a relationship • Based on the cardinality, binary relationship can be classified into • One-to-one • One-to-Many • Many-to-one • Many-to many

DATABASE DESIGN AND ER DIAGRAMS • One-to-One • Each entity in a relationship will have exactly one relationship • Eg: one college can have at most one principal and one principal can assigned to only one college

DATABASE DESIGN AND ER DIAGRAMS • One-to-Many • An entity in A is associated with any number of entities in B & an entity in B is associated with at most one entity in A • Eg: • One department can appoint any number of faculty members but one faculty member is assigned to only one department

DATABASE DESIGN AND ER DIAGRAMS • Many-to-One • An entity in A is associated with at most one entity in B, and an entity in B is associated with any number of entities in A • Example • Course has many students but a student can be opts only one course

DATABASE DESIGN AND ER DIAGRAMS • Many-to-Many • Entities of both sides of the relationship can have many related entities on the other side • Example • One faculty member can be assigned to teach many courses and one course may be taught by many facility members

DATABASE DESIGN AND ER DIAGRAMS Participation Constraints Two types Total participation When all the entities from an entity set participate in a relationship is called total participation • It is represented by double arrow • • • Partial participation • When it is not necessary for all entities in entity set participate in a relationship is called partial participation
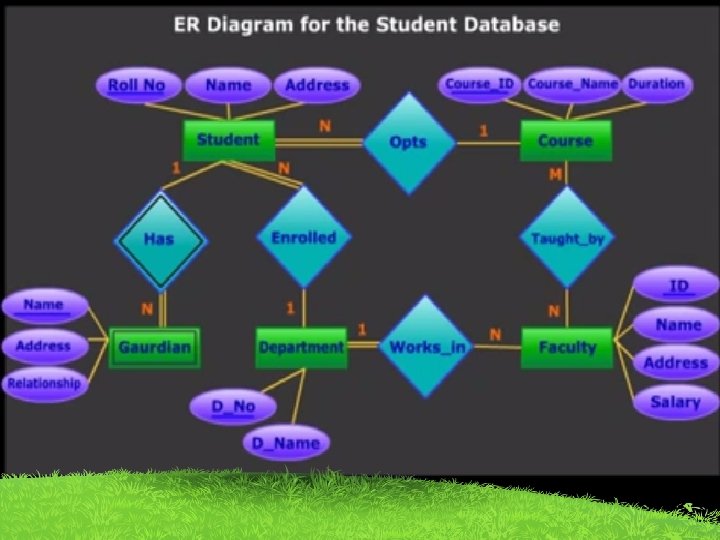

DATABASE DESIGN AND ER DIAGRAMS • ER-Diagram For Student Database • There are 5 entity • Student, course, Guardian, Department, & Faculty • Each entity has its own attributes • Student entity has 3 attributes Roll_No, Name, Address (Roll_No is the key attribute) • Relationships • Students opts Course • Students has guardian etc

Conceptual Design Using the ER Model • • Subclasses, Super classes & Inheritance Sub groupings of entities that are meaningful. Ex: EMPLOYEE may be further grouped into SECRETARY, ENGINEER, MANAGER, TECHNICIAN, and so on. Set of entities in each subgroups is a subset of the EMPLOYEE entity set. Each is called a subclass of EMPLOYEE is the superclass for each of these subclasses Subclass entity inherits all attributes and relationships of superclass

Conceptual Design Using the ER Model • Generalization • Bottom-up approach • 2 lower level entities combined to form a higher level entity • The higher level entity can also combine with other entity to make further higher level entity

Conceptual Design Using the ER Model • Generalization • several entity types which have some common features into a single super class • Process of defining a generalized entity type from the given entity types

Conceptual Design Using the ER Model • • • • G E N E R A L I Z A T I O N

Conceptual Design Using the ER Model • Specialization • Opposite to generalization • Top-down approach • Higher level entity can be broken down into 2 lower level entity • Represented by a triangle Labeled ISA • Eg: Curr-Student is a Student

Unified Modeling Language • Aggregation • The E-R model cannot express relationships among relationships. • Consider a DB with information about employees who work on a particular project and use a number of machines doing that work. • Relationship work and uses could be combined into a single set. • we treat the relationship work and the entity sets employee and project as a higher-level entity set called work.

Conceptual Design Using the ER Model • Aggregation • Process when relation between 2 entity is treated as a single entity. • Eg • Relation between Center & Course is acting as an entity relation with visitor

Conceptual Design Using the ER Model • Developing an ER diagram presents several choices, including the following: – Should a concept be modeled as an entity or an attribute? – Should a concept be modeled as an entity or a relationship? – Identifying relationships: Binary or ternary? Aggregation?

Conceptual Design Using the ER Model • Entity vs. Attribute • Should address be an attribute of Employees or an entity (related to Employees)? • Depends upon how we want to use address information, and the semantics of the data: • If we have several addresses per employee, address must be an entity. • If the structure (city, street, etc. ) is important, address must be modeled as an entity (since attribute values are atomic).

Conceptual Design Using the ER Model • Entity vs. Attribute from name • Works_In 2 does not allow an employee to work in a department for two or more periods. • we want to record several values of the descriptive attributes for each instance of this relationship. ssn to did lot ssn name lot Employees from did Works_In 3 Duration budget Departments Works_In 2 Employees dname budget Departments to

Unified Modeling Language • Consider the relationship set called Manages 2 • Suppose that each department manager is given a budget • If the value of more than one dept is same it will leads to redundant storage of the same information • We can solve these problems by introducing a new entity set called Managers • The attributes since and budget now describe a manager entity • each manager may have a different starting date • In this case budget is an attribute of Managers

Conceptual Design Using the ER Model • Entity vs. Relationship since name ssn budget lot Employees did dname budget Departments Manages 2 name ssn lot dname did Employees budget Departments managers apptnum managed_by Mgr_Appts budget since

Unified Modeling Language • UML stands for Unified Modeling Language used in object oriented software engineering. • Used to model an application structures, behavior and business processes. • There are 14 UML diagram types to help model these behavior. • They can be divided into two main categories • Structure diagrams and • Behavioral diagrams.

Unified Modeling Language • • • • Class Diagram Component Diagram Deployment Diagram Object Diagram Package Diagram Profile Diagram Composite Structure Diagram Use Case Diagram Activity Diagram State Machine Diagram Sequence Diagram Communication Diagram Interaction Overview Diagram Timing Diagram

Unified Modeling Language • Structure diagrams • show the things in a system being modeled. • Show different objects in a system. • Behavioral diagrams • Shows what should happen in a system. • They describe how the objects interact with each other to create a functioning system.

Unified Modeling Language • Class Diagram • Main building block of any object oriented solution. • It shows the classes in a system, attributes and operations of each class and the relationship between each class. • In most modeling tools a class has three parts, – name at the top, – attributes in the middle and – operations or methods at the bottom. • In large systems with many classes are grouped together to create class diagrams. • Different relationships are represented with Arrows.

Unified Modeling Language

Unified Modeling Language • Component Diagram • Displays the structural relationship of components of a software system. • Components communicate with each other using interfaces. • The interfaces are linked using connectors.

Unified Modeling Language

Unified Modeling Language • Deployment Diagram • Shows the hardware and software in the system. • Useful when the software solution is deployed across multiple machines with each having a unique configuration.

Unified Modeling Language

Unified Modeling Language • • Object Diagram Similar to class diagrams. Show the relationship between objects Show a system will look like at a given time.

Unified Modeling Language

Unified Modeling Language • Package Diagram • Shows the dependencies between different packages in a system.

Unified Modeling Language • Profile Diagram • Profile diagram is a new diagram type introduced in UML 2. • This is a diagram type that is very rarely used in any specification.

Unified Modeling Language • Composite Structure Diagram • Show the internal structure of a class.

Unified Modeling Language • Use Case Diagram • Use case diagrams gives a graphic overview of the actors involved in a system, different functions needed by those actors and how these different functions are interacted. • It’s a great starting point for any project discussion because we can easily identify the main actors involved and the main processes of the system.

Unified Modeling Language

Unified Modeling Language • Activity Diagram • Represent workflows in an graphical way. • Used to describe business workflow or the operational workflow of any component in a system.

Unified Modeling Language • State Machine Diagram • Similar to activity diagrams. • Useful to describe the behavior of objects that act different according to the state they are at the moment. • Show the basic states and actions.

Unified Modeling Language

Unified Modeling Language • Sequence Diagram • Shows how object interact with each other and the order those interactions occur. • Show the interactions for a particular scenario. • The processes are represented vertically and interactions are show as arrows.

Unified Modeling Language

Unified Modeling Language • Communication Diagram • Similar to sequence diagrams but the focus is on messages passed between objects.

Unified Modeling Language

Unified Modeling Language • Interaction Overview Diagram • Activity diagrams shows a sequence of processes Interaction overview diagrams shows a sequence of interaction diagrams. • In simple term they can be called a collection of interaction diagrams and the order they happen.

Unified Modeling Language

Unified Modeling Language • Timing Diagram • They represent the behavior of objects in a given time frame. • It shows more then one objects are involved during a time frame

Unified Modeling Language

Unified Modeling Language

Unified Modeling Language

Unified Modeling Language

Unified Modeling Language
- Slides: 71