
Data Visualization My particular ability does not lie
Data Visualization “My particular ability does not lie in mathematical calculation, but rather in visualizing effects, possibilities, and consequences. ” - Albert Einstein
Evolution of Visualization • Visualization is not new. Throughout recorded history, drawings and other visually oriented representations have been an integral part of man’s investigation of the world • What is new on the other hand, is the computational and visual display capabilities of computers • Furthermore, ERP systems among other evolving technologies are increasing the stream of data and their parameters, resulting in multidimensional data with a high dimensionality, where finding valuable information hidden in them, is like searching a pin in a haystack 2
What is Data Visualization • The idea of visualization is to present the data in some visual form (e. g. charts, graphs, maps) allowing the human to get insight into the data, draw conclusions, and come up with hypotheses • Data visualization aims at integrating individuals in the data analysis process, applying their perceptual abilities, flexibility, creativity, and general knowledge to the large data sets available in today’s systems 3
Stages of Data Visualization • The four stages of Data Visualization consist of: – The collection and storage of data – The preprocessing designed to transform the data into something we can understand – The display hardware and the graphics algorithms that produce an image on the screen – The human perceptual and cognitive system 4
The Theory of Cognitive fit • The theory of cognitive fit proposed by Vessey (1991) provides a basis for the outcome of visual or graphical presentation • This theory proposes that a problem may be represented either spatially (Visually) or symbolically (Tabular form), and the task required of the decision-maker may also be described similarly • It suggests that the correspondence between task and information presentation format leads to superior task performance whereby if the type of presentation matches the type of task, decision makers will be both more efficient and more effective in decision making 5
Why Data Visualization? • It is well known that Decision-making is a cognitive process and involves reliance on the nature and content of information being inputted and how the information is being presented • Additionally, presentation format has been used to support decision-making processes and • Numerous studies have also suggested the use of such format to minimize human information processing limitations and improve ways of thinking 6
Why Data Visualization? • Furthermore, the 20 billion plus neurons of the brain that are devoted to analyzing visual information provide a powerful but flexible pattern finder • Coupled with computational power, we can go one step further and recognize that people with machines are much more cognitively powerful than a single person or machine alone • Therefore, what better way to present and analyze data than to apply data visualization techniques 7
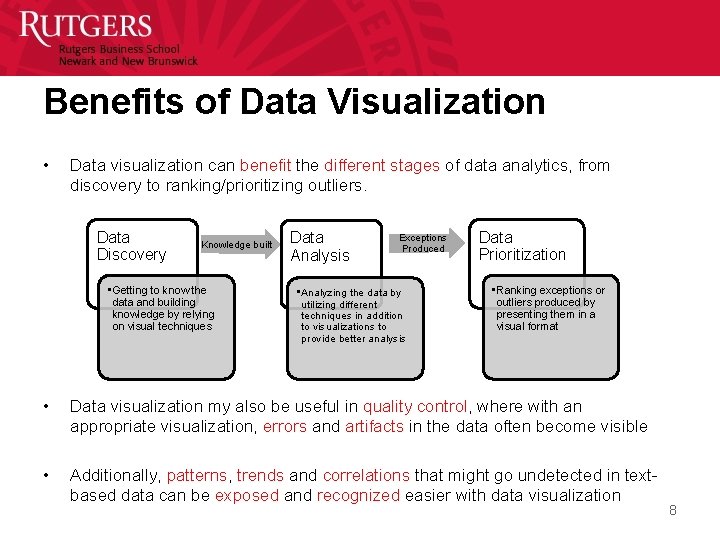
Benefits of Data Visualization • Data visualization can benefit the different stages of data analytics, from discovery to ranking/prioritizing outliers. Data Discovery Knowledge built • Getting to know the data and building knowledge by relying on visual techniques Data Analysis Exceptions Produced • Analyzing the data by utilizing different techniques in addition to visualizations to provide better analysis Data Prioritization • Ranking exceptions or outliers produced by presenting them in a visual format • Data visualization my also be useful in quality control, where with an appropriate visualization, errors and artifacts in the data often become visible • Additionally, patterns, trends and correlations that might go undetected in textbased data can be exposed and recognized easier with data visualization 8
Benefits of Data Visualization • Additional Benefits of Data Visualization: – Data Visualization can easily deal with highly diverse and noisy data – Data Visualizations is intuitive and requires no understanding of complex mathematical or statistical algorithms or parameters – Data Visualizations usually allows for faster data exploration and often provides better results 9
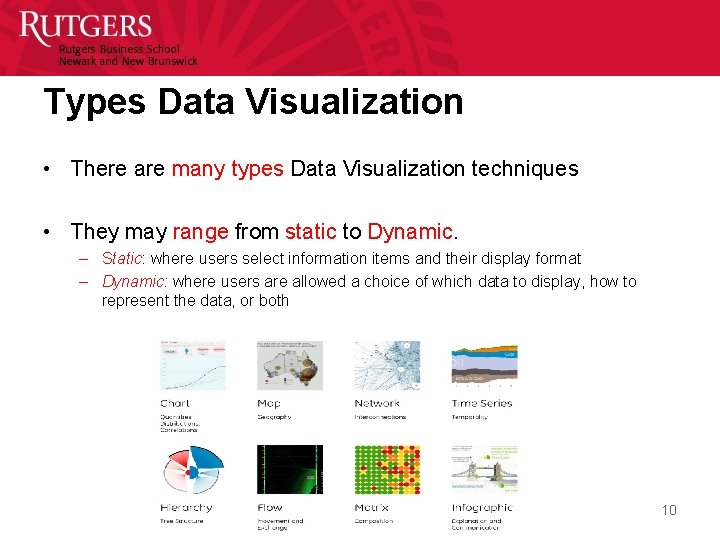
Types Data Visualization • There are many types Data Visualization techniques • They may range from static to Dynamic. – Static: where users select information items and their display format – Dynamic: where users are allowed a choice of which data to display, how to represent the data, or both 10
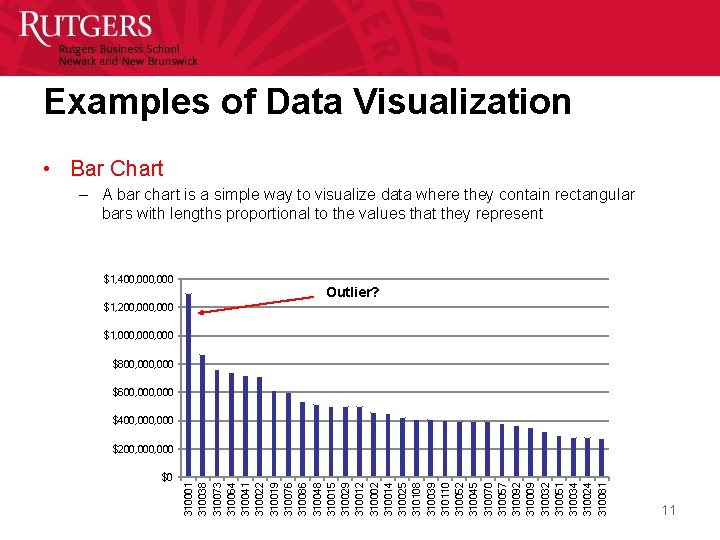
Examples of Data Visualization • Bar Chart – A bar chart is a simple way to visualize data where they contain rectangular bars with lengths proportional to the values that they represent $1, 400, 000 Outlier? $1, 200, 000 $1, 000, 000 $800, 000 $600, 000 $400, 000 $0 310001 310038 310073 310064 310041 310022 310019 310076 310086 310048 310015 310029 310012 310002 310014 310025 310108 310039 310110 310052 310045 310070 310057 310092 310009 310032 310051 310034 310024 310081 $200, 000 11
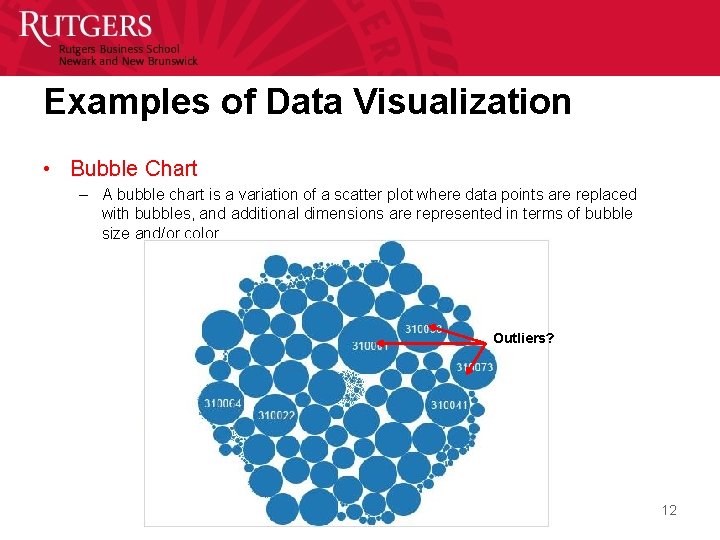
Examples of Data Visualization • Bubble Chart – A bubble chart is a variation of a scatter plot where data points are replaced with bubbles, and additional dimensions are represented in terms of bubble size and/or color Outliers? 12
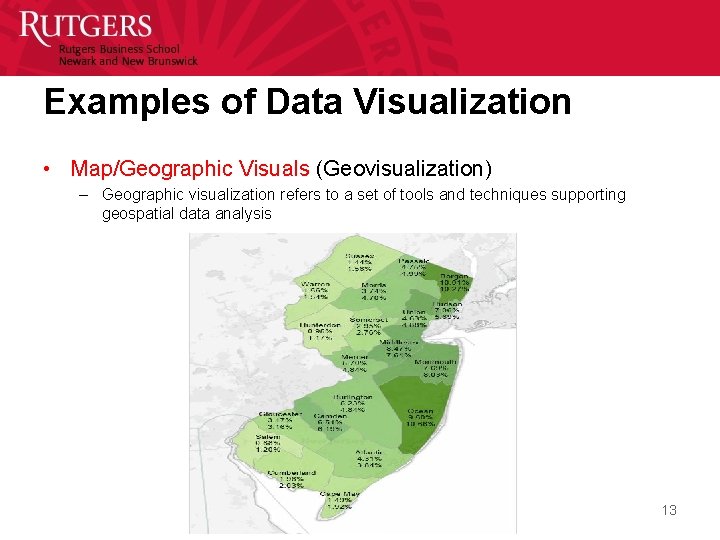
Examples of Data Visualization • Map/Geographic Visuals (Geovisualization) – Geographic visualization refers to a set of tools and techniques supporting geospatial data analysis 13
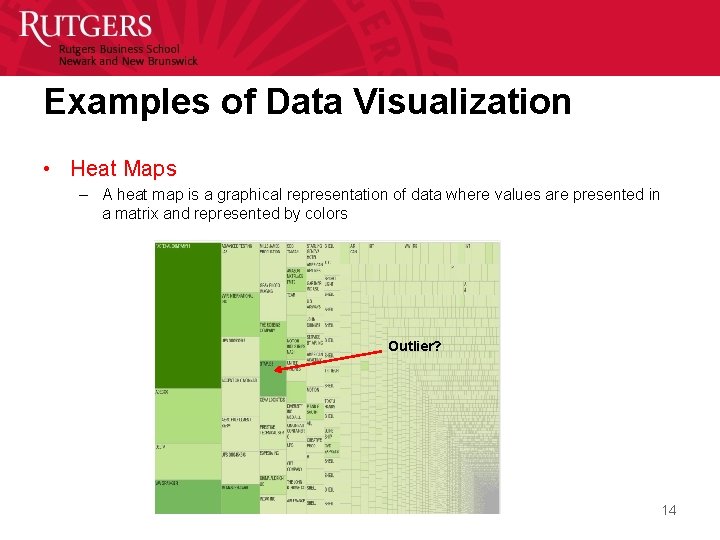
Examples of Data Visualization • Heat Maps – A heat map is a graphical representation of data where values are presented in a matrix and represented by colors Outlier? 14
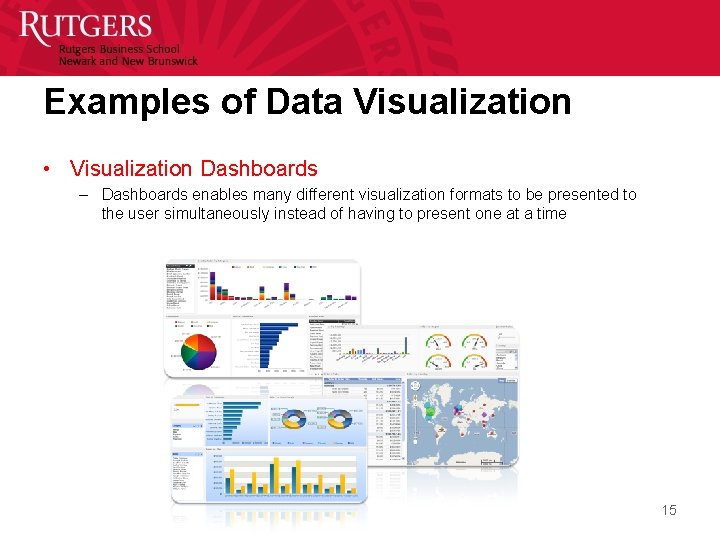
Examples of Data Visualization • Visualization Dashboards – Dashboards enables many different visualization formats to be presented to the user simultaneously instead of having to present one at a time 15

16
- Slides: 16