Data Visualization IS 101 YCMSC 101 Computational Thinking


 John")


")


 LOTS of data")


- Slides: 22
Data Visualization IS 101 Y/CMSC 101 Computational Thinking and Design Thursday, October 10, 2013 Marie des. Jardins University of Maryland, Baltimore County
Midterm Preparation All assigned class material is fair game: Assigned readings from the three textbooks (St. Amant, Processing, MYM) Other assigned readings and videos as listed in the class schedule Lecture slides and in-class discussions The focus is on conceptual understanding rather than memorization of details Be able to define and answer questions about key concepts Not memorizing details of examples mentioned in passing Be able to write and interpret Processing programs Not picky/”trick question” syntax questions Format: About 25 questions Mix of true-false, multiple-choice, matching, and open-ended (short answer or write a program fragment) questions Closed-book but with limited notes: You may bring one page of notes (8. 5”x 11”, front and back, typewritten or handwritten, must be prepared by you but you can talk to other students as much as you want about what to include)
The purpose of computing is insight, not numbers. Richard Hamming
Numbers 218 217 216 215 214 213 212 211 210 209 208 206 205 203 202 201 200 199 198 197 197 197 198 198 199 200 201 202 204 205 206 207 209 210 212 214 215 217 219 221 223 225 227 229 231 233 234 236 238 239 240 241 242 243 243 243 242 241 240 239 238 237 236 235 233 232 231 229 228 226 225 223 222 220 219 217 216 214 213 212 211 210 209 208 207 206 206 206 207 208 209 210 211 212 214 215 217 218 220 222 224 226 228 229 231 233 234 236 238 240 241 243 244 246 247 249 250 251 253 254 255 256 256 255 254 253 252 251 249 248 247 246 245 244 243 243 243 242 242 241 241 240 239 238 238 237 237 236 235 234 233 232 231 230 229 228 227 226 224 223 221 220 218 217 216 214 213 212 211 210 209 208 207 206 205 205 205 206 206 207 208 209 210 211 212 213 214 215 216 217 218 219 220 222 224 225 226 227 228 229 229 230 230 230 231 231 233 233 230 229 228 227 226 225 224 223 221 220 219 218 217 216 215 214 213 212 211 210 209 207 206 205 204 202 201 200 199 198 197 196 196 196 197 198 199 200 202 203 204 205 207 208 210 212 213 215 217 219 221 223 225 227 229 231 233 235 237 239 240 241 242 243 244 244 244 243 242 241 240 239 238 237 236 235 233 232 231 229 228 226 225 223 221 220 218 217 215 214 213 212 211 210 209 208 207 206 206 207 208 209 210 211 213 214 216 217 219 221 223 225 227 229 231 233 235 237 238 240 242 243 245 247 248 250 251 252 254 255 256 256 257 257 257 256 255 254 253 252 251 250 249 248 247 246 245 244 243 243 242 242 241 241 240 240 239 238 238 237 237 236 235 235 234 233 232 231 230 229 228 227 226 224 223 221 220 218 217 215 214 213 212 211 210 209 208 207 206 205 205 204 205 205 206 207 208 209 210 211 212 213 214 215 216 217 218 220 221 222 223 224 225 226 227 228 229 230 230 231 231 233 233 230 229 228 227 226 225 224 223 221 220 219 218 217 216 215 214 213 212 211 210 208 207 206 205 204 202 201 200 199 198 197 197 196 195 196 196 197 198 200 201 202 203 205 206 207 209 211 213 215 217 219 221 224 226 228 230 232 234 236 238 240 241 242 243 244 245 245 244 243 242 241 240 239 238 237 236 235 233 232 231 229 227 226 225 223 221 219 218 217 215 214 213 212 211 210 209 208 207 206 206 205 205 205 206 207 208 209 210 212 213 215 217 218 220 222 225 227 229 231 233 235 237 239 241 243 244 246 248 249 251 252 253 255 256 257 257 256 255 254 253 252 251 250 249 248 247 246 245 244 243 242 242 241 241 240 239 239 238 237 237 237 236 235 234 233 232 231 230 229 227 226 224 223 221 220 218 216 215 214 213 211 210 209 208 207 206 205 204 204 205 206 207 208 209 210 212 213 214 215 216 217 218 220 221 222 223 224 225 226 227 228 229 230 231 231 232 232 232 231 233 233 230 229 228 227 226 225 224 223 221 220 219 218 217
What information consumes is rather obvious: it consumes the attention of its recipients. Hence a wealth of information creates a poverty of attention, and a need to allocate that attention efficiently among the overabundance of information sources that might consume it. Herb Simon
Lots of Numbers Simulations Sensors/scanners Surveys Equations Tracking and data gathering Data integration
A Medical Detective Story London, 1854: Cholera outbreak (500 deaths in 10 days) John Snow was a physician who investigated the outbreak; he suspected transmission through the water supply
Logic of Display and Analysis 1. Place data in appropriate context for assessing cause and effect Map vs list vs time series
Logic of Display and Analysis 2. Make qualitative comparisons (who escaped)
Logic of Display and Analysis 3. Consider alternative explanations and contrary cases
Logic of Display and Analysis 4. Assess possible errors in numbers reported Missing addresses Missing habit information
Aggregation Pitfalls Spatial
Aggregation Pitfalls Temporal
Technologies of Knowledge Discovery Machine learning Data mining Visualization Visual analytics
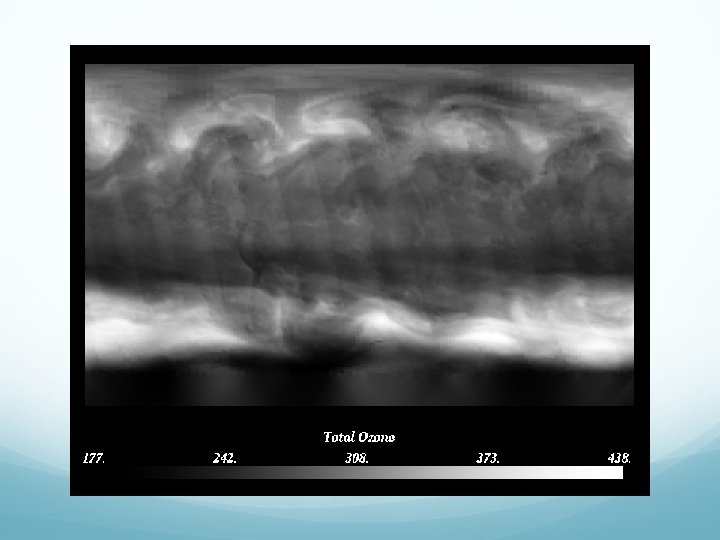
What is Visualization? Definition: visual representation of data Connotations: Computer-generated (mostly) LOTS of data Transforms the abstract and symbolic into the geometric Harnesses the human visual perception and cognitive systems
Text Representation 218 217 216 215 214 213 212 211 210 209 208 206 205 203 202 201 200 199 198 197 197 197 198 198 199 200 201 202 204 205 206 207 209 210 212 214 215 217 219 221 223 225 227 229 231 233 234 236 238 239 240 241 242 243 243 243 242 241 240 239 238 237 236 235 233 232 231 229 228 226 225 223 222 220 219 217 216 214 213 212 211 210 209 208 207 206 206 206 207 208 209 210 211 212 214 215 217 218 220 222 224 226 228 229 231 233 234 236 238 240 241 243 244 246 247 249 250 251 253 254 255 256 256 255 254 253 252 251 249 248 247 246 245 244 243 243 243 242 242 241 241 240 239 238 238 237 237 236 235 234 233 232 231 230 229 228 227 226 224 223 221 220 218 217 216 214 213 212 211 210 209 208 207 206 205 205 205 206 206 207 208 209 210 211 212 213 214 215 216 217 218 219 220 222 224 225 226 227 228 229 229 230 230 230 231 231 233 233 230 229 228 227 226 225 224 223 221 220 219 218 217 216 215 214 213 212 211 210 209 207 206 205 204 202 201 200 199 198 197 196 196 196 197 198 199 200 202 203 204 205 207 208 210 212 213 215 217 219 221 223 225 227 229 231 233 235 237 239 240 241 242 243 244 244 244 243 242 241 240 239 238 237 236 235 233 232 231 229 228 226 225 223 221 220 218 217 215 214 213 212 211 210 209 208 207 206 206 207 208 209 210 211 213 214 216 217 219 221 223 225 227 229 231 233 235 237 238 240 242 243 245 247 248 250 251 252 254 255 256 256 257 257 257 256 255 254 253 252 251 250 249 248 247 246 245 244 243 243 242 242 241 241 240 240 239 238 238 237 237 236 235 235 234 233 232 231 230 229 228 227 226 224 223 221 220 218 217 215 214 213 212 211 210 209 208 207 206 205 205 204 205 205 206 207 208 209 210 211 212 213 214 215 216 217 218 220 221 222 223 224 225 226 227 228 229 230 230 231 231 233 233 230 229 228 227 226 225 224 223 221 220 219 218 217 216 215 214 213 212 211 210 208 207 206 205 204 202 201 200 199 198 197 197 196 195 196 196 197 198 200 201 202 203 205 206 207 209 211 213 215 217 219 221 224 226 228 230 232 234 236 238 240 241 242 243 244 245 245 244 243 242 241 240 239 238 237 236 235 233 232 231 229 227 226 225 223 221 219 218 217 215 214 213 212 211 210 209 208 207 206 206 205 205 205 206 207 208 209 210 212 213 215 217 218 220 222 225 227 229 231 233 235 237 239 241 243 244 246 248 249 251 252 253 255 256 257 257 256 255 254 253 252 251 250 249 248 247 246 245 244 243 242 242 241 241 240 239 239 238 237 237 237 236 235 234 233 232 231 230 229 227 226 224 223 221 220 218 216 215 214 213 211 210 209 208 207 206 205 204 204 205 206 207 208 209 210 212 213 214 215 216 217 218 220 221 222 223 224 225 226 227 228 229 230 231 231 232 232 232 231 233 233 230 229 228 227 226 225 224 223 221 220 219 218 217
Visualization Tasks See values Extrema Anomalies Boundaries/thresholds Distribution/structure/pattern See multiple variables Relationships See flow/change Understand process
Student Retention
Student Retention cont.
Data Exploration: Gap. Minder Where’s the US? Point out some other countries Outliers: • Richest country? • Poorest? • Longest-lived? • Shortest-lived? Show time-varying visualization on www. gapminder. org