Data Visualization AKA Art Data TED TALK https


- Slides: 15
Data Visualization AKA: Art Data
TED TALK • https: //www. ted. com/talks/david_mccandless_the_beauty_of_data_ visualization
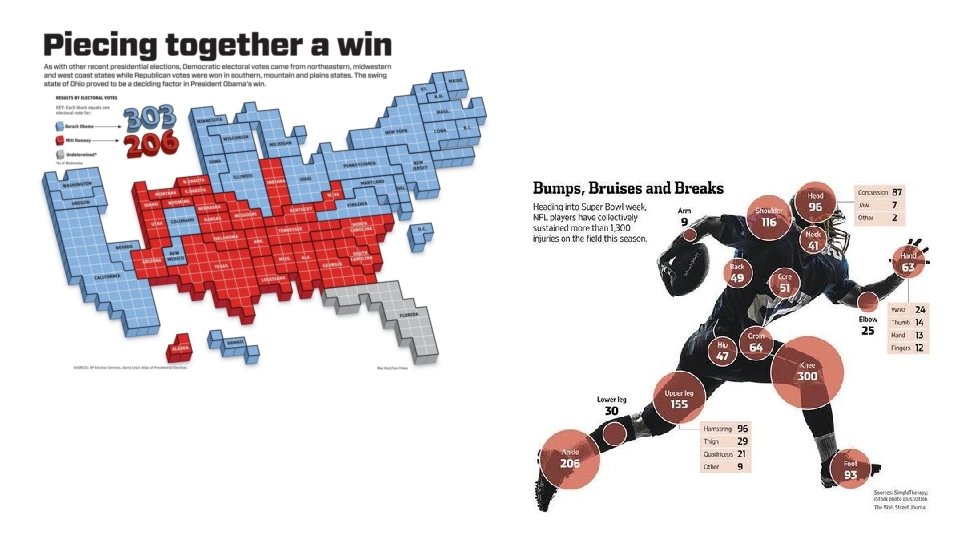
Why do we need to visualize data? -to REDUCE: simplify for understanding -to REVEAL: show things we have never seen before -Create the “OOH, AHH”! -Data Artist, Jer Thorp, Office for Creative Research
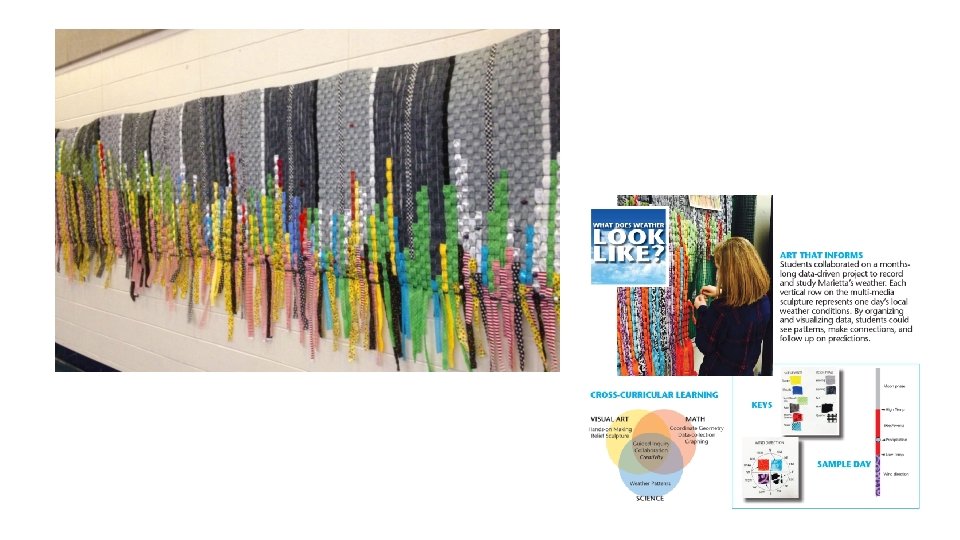
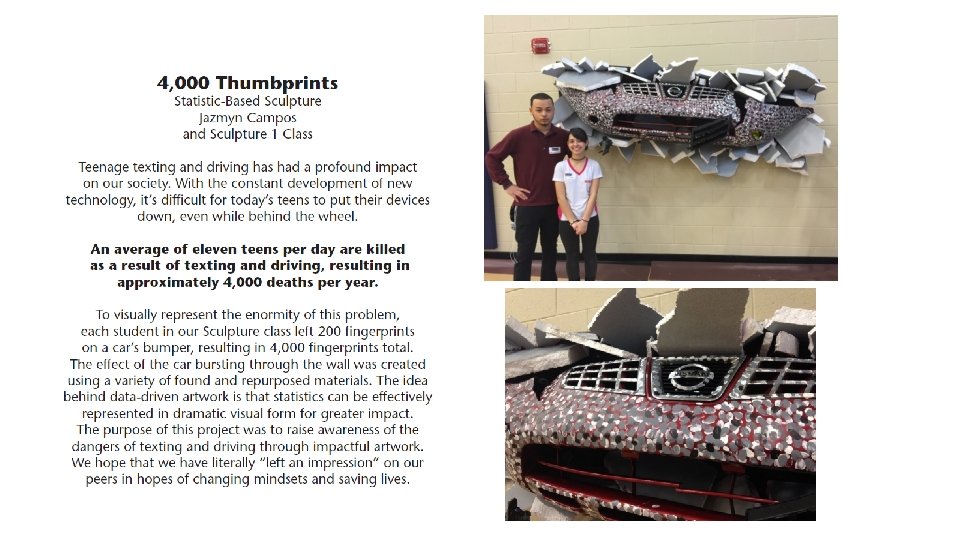
How can we get data to change human action? Use the arts to start the conversation, promote thinking and drive change.
l
Ken Goldberg Seismic Activity
Luke Jerram, Glass Microbiology
Stef Lewandowski, “Data Necklace”
Samuel Granados, “Lego Cartography”
Dear Data • Dear Data is a yearlong, analog data drawing project by Giorgia Lupi and Stefanie Posavec, two award-winning information designers living on different sides of the Atlantic. • By collecting and hand drawing their personal data and sending it to each other in the form of postcards, they became friends.
Why do we need to visualize data? -to REDUCE: simplify for understanding -to REVEAL: show things we have never seen before -Create the “OOH, AHH”! -TO CHANGE HUMAN ACTION/BEHAVIOR -Data Artist, Jer Thorp, Office for Creative Research
Now it is your turn… Use your data set to create “data art”! Goals: • REDUCE data to simplify understanding • Create a balance of the “OOH” and the “AHH”.