DATA TRANSFORMATION AND DISCRETIZATION GUIDED BY PROF D

DATA TRANSFORMATION AND DISCRETIZATION GUIDED BY: PROF. D. P. PAWAR

DATA TRANSFORMATION Function that maps the entire set of values of given attribute to a new set of replacement values such that each old value can be identified with one of the new values. data are transformed or consolidated so that the resulting mining process may be more efficient, and the patterns found may be easier to understand.

Data Transformation Strategies 1. Smoothing : which works to remove noise from the data. Techniques include binning , regression, and clustering. 2. Attribute construction (feature construction): where new attributes are constructed and added from the given set of attributes to help the mining process. 3. Aggregation: where summary or aggregation operations are applied to the data. This step is typically used in constructing a data cube for data analysis at multiple abstraction levels.

4. Normalization: where the attribute data are scaled so as to fall within a smaller range, i) min-max normalization ii) z-score normalization iii) normalization by decimal scaling Ø Min-max normalization performs a linear transformation on the original data. Suppose that min. A and max. A are the minimum and maximum values of an attribute. V’i = {vi –min. A /max A – min. A }(new_max. A –new_min. A)+ new_min. A

Ex. Let income range $12, 000 to $98, 000. normalized to [0. 0, 1. 0]. Then $73, 000 is mapped to [ frac{73, 600 -12, 000}{98, 000 -12, 000}(1. 0 - 0)+0 = 0. 716 ] Min-max normalization preserves the relationships among the original data values. Z-score normalization (μ: mean, σ: standard deviation): the values for an attribute A, are normalized based on the mean (i. e. , average) and standard deviation of A. A value, vi , of A is normalized to v’i by computing.

Suppose that the mean and standard deviation of the values for the attribute income are $54, 000 and $16, 000, respectively. With z-score normalization, a value of $73, 600 for income is transformed to 73, 600 54, 000/16, 000 = 1. 225.

z-score normalization using the mean absolute deviation is The mean absolute deviation, SA, is more robust to outliers than the standard deviation.

Normalization by decimal scaling It normalizes by moving the decimal point of values of attribute A. The number of decimal points moved depends on the maximum absolute value of A.

Suppose that the recorded values of A range from -986 to 917. The maximum absolute value of A is 986. To normalize by decimal scaling, we therefore divide each value by 1000 (i. e. , j =3) so that -986 normalizes to 0. 986 and 917 normalizes to 0. 917. Note that normalization can change the original data quite a bit, especially when using z-score normalization. It is also necessary to save the normalization parameters (e. g. , the mean and standard deviation if using z-score normalization) so that future data can be normalized in a uniform manner.

Discretization Divide the range of a continuous attribute into intervals. Data discretization transforms numeric data by mapping values to interval or concept labels. Such methods can be used to automatically generate concept hierarchies for the data, which allows for mining at multiple levels of granularity. Ø Reduce data size by discretization. Ø Discretization can be performed recursively on an attribute.

EXAMPLE
")
Data Discretization Methods Ø Binning Top-down split, unsupervised ØHistogram analysis unsupervised ØClustering analysis (unsupervised) ØDecision-tree analysis (supervised, top-down split) ØCorrelation (e. g. , X^2) analysis (unsupervised, bottom-up merge)

DISCRETIZATION BY HISTOGRAM ANALYSIS UNSUPERVISED
")
DISCRETIZATION WITHOUT CLASS LABELS (BINNING VS CLUSTERING)
")
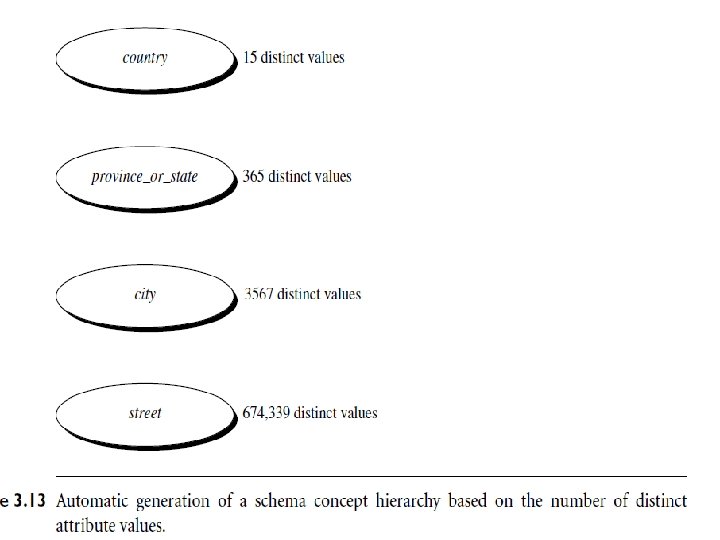
Hierarchy Generation for nominal data Ø Nominal attributes have a finite (but possibly large) number of distinct values, with no ordering among the values. 1. Specification of a partial ordering of attributes explicitly at the schema level by users or experts: A hierarchy can be defined by specifying the total ordering among these attributes at the schema level such as street < city <province or state < country.

2. Specification of a portion of a hierarchy by explicit data grouping. In a large database, it is unrealistic to define an entire concept hierarchy by explicit value enumeration. we can easily specify explicit groupings for a small portion of intermediate-level data. “f. British Columbia, prairies Canadag Western Canada. ” 3. Specification of a set of attributes, but not of their partial ordering: time dimension in a database may contain 20 distinct years, 12 distinct months, and 7 distinct days of the week. However, this does not suggest that the time hierarchy should be “year <month <days of the week, ” with days of the week at the top of the hierarchy.

THANK YOU…!!
- Slides: 18