Data Stuff Steve Colwell British Antarctic Survey Overview

Data Stuff Steve Colwell British Antarctic Survey
 https: //legacy.")
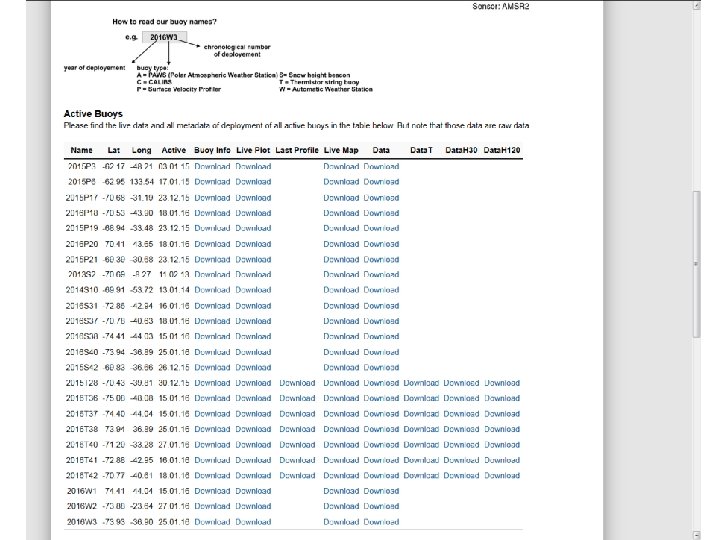
Overview • An update on READER (Reference Antarctic Data for Environmental Research) https: //legacy. bas. ac. uk/met/READER/ • Demonstration of the new meteorological data interface http: //basmet. nercbas. ac. uk/sos/ • A project to put weather stations on drifting buoys http: //www. meereisportal. de/en. html

https: //legacy. bas. ac. uk/met/READER/

Updates to the end of 2015 • Stations where surface data from the national operator has been obtained up to the end of 2015 are: – UK, USA, Germany, Argentina, Australia, China. • Stations where updates have been promised from: – Chile, Russia, Japan, South Korea, France.

Mc. Murdo data Mc. Murdo Station Daily Observation Worksheet Time Zulu 12 -15 Z 15 -18 Z 18 -21 Z 21 -24 Z 00 -03 Z 03 -06 Z 06 -09 Z 09 -12 Z Winds Dir 60 6 hr Temp Spd Temp Dew PT Max Min Visibility (hrs) Wx and Duration (Note 2) <1600 <4800 <9999 sn/sg/ic hrs fg/br hrs bs Max Wind (Note 3) hrs Pcpn Amt 21 -18. 6 -24. 4 -17. 3 -18. 7 1. 5 SN 0. 9 BR 1. 5 T 70 14 -16. 2 -21. 2 -16. 0 -18. 6 12 hr Max/Min -16. 0 -18. 7 5. 5 SN 5. 5 BR 5. 5 T 80 -28. 4 -14. 3 -16. 6 -14. 3 -16. 8 Visibility (hrs) Min Wind Chill WX and Duration Max Min Avg Pcpn Temp Time <1600 <4800 <9999 C F Total sn/sg/ic fg/br bs -14. 3 -18. 7 -15. 800 -06 L 0. 0 1. 5 -33. 0 -27. 4 6. 4 7. 0 0. 0 T 06 -12 L 0. 0 5. 5 12 -18 L 0. 0 18 -24 L 0. 0 Note 1: Color coding. Green headings indicate blocks the Weather Observer must complete. The remainder are calculated/ completed by MS Excel. Spd Dir 23 70 23 60 22 70 18 60 18 17 17 19 8 -16. 3 -24. 0 -14. 7 -16. 8 70 16 -14. 3 12 hr Max/Min Avg Wind Max Dir Spd Temp 68 15 -14. 3 Date: 01 60 60 Ceiling (hrs) Alt Ceiling in Hrs=or< Center Station Press Tend (mb) (in) Low. Sky est Time Spd Dir Time Cover CIG <500 <1000 <3000 1455 1730 31 80 1356 8 45 29. 45 1916 2132 26 70 1933 8 25 3. 0 29. 45 101 315 820 930 Max Wind Dir Spd Time 70 23 1455 Altimeter Max Min Avg 29. 45 29. 29 29. 40 Note 2: Duration should be fractions of an hour. Max Gust (Note 3) SLP (mb) 993. 6 3002 998. 1 993. 2 6001 997. 7 23 50 59 6 25 0. 3 29. 39 991. 5 6007 996. 0 24 70 1008 6 30 29. 29 988. 2 6015 992. 5 Max Gust Ceiling (hrs) Avg Low. Dir Spd Time Sky <500 <1000 <3000 est Time 80 31 1356 Cover CIG 00 -06 L 0. 0 7 2506 -12 L 0. 0 3. 0 Daily Total 12 -18 L 0. 0 0. 3 Obs Daily Temp 18 -24 L 0. 0 Taken Pres Diff 4 0. 16 4. 4 Note 3: To facilitate MS Excel, the order of entry for Max Wind and Max Gust is changed from conventional. The order is: Spd, Dir, and Time. 24 -Hour Pressure 2. 9 5. 6

Mc. Murdo pressure data

Mc. Murdo pressure data with date corrected

Palmer data

Palmer data

Faraday/Vernadsky verses Palmer annual temperature

Difference in Palmer data from the old PALMOS system and synops

Difference in Palmer data from the old PALMOS system and synops

Palmer summary • Since October 2015 data for the synoptic messages are coming from the new PAWS system. • The station height has not yet been updated in the WMO flatfile list where it is still listed as 8 m. • Palmer pressure data are getting rejected by AMPS. • The synoptic messages being sent out have the same pressure for station and sea level. AAXX 16001 89061 17566 80000 11003 21005 30127 40127 56020 69904 70066 333 21026 59060 555 91600= NNNN

Palmer summary • Since October 2015 data for the synoptic messages are coming from the new PAWS system. • The station height has not yet been updated in the WMO flatfile list where it is still listed as 8 m. • Palmer pressure data are getting rejected by AMPS. • The synoptic messages begin sent out have the same pressure for station and sea level. Station pressure 1012. 7 AAXX 16001 89061 17566 80000 11003 21005 30127 40127 56020 69904 70066 333 21026 59060 555 91600= Sea level pressure 1012. 7 NNNN

New meteorological data interface.

New meteorological data interface.

New meteorological data interface.

New meteorological data interface.

New meteorological data interface.

New meteorological data interface.

New meteorological data interface.

New meteorological data interface.

New meteorological data interface.

Weather station under construction in Cambridge

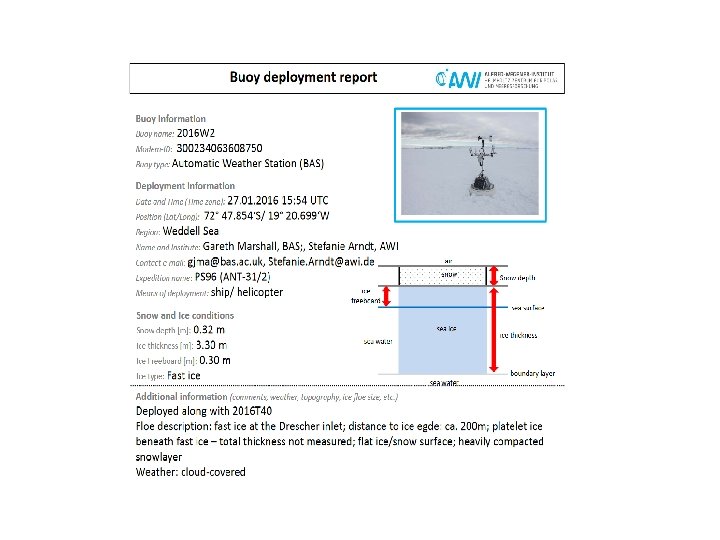
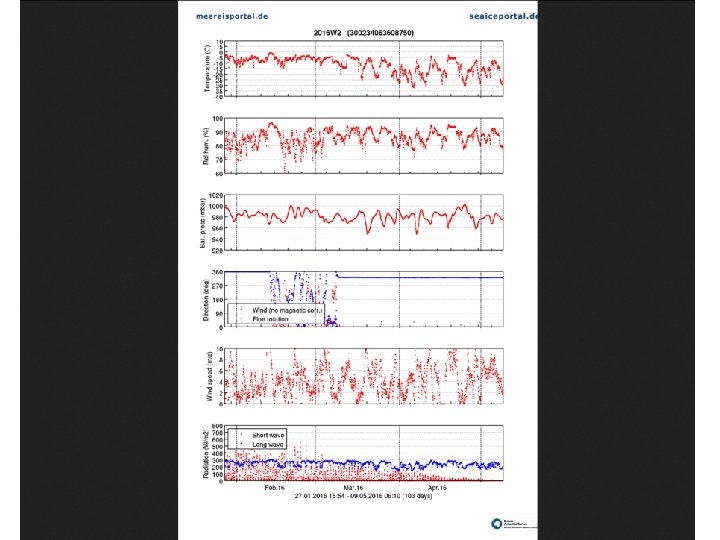
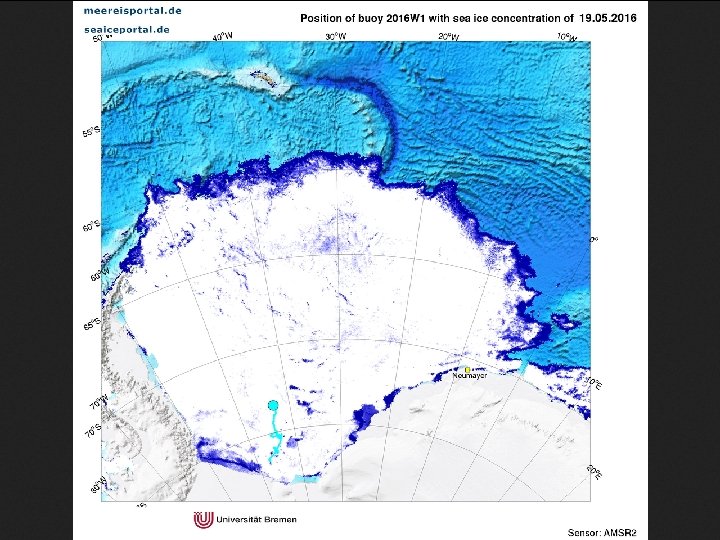
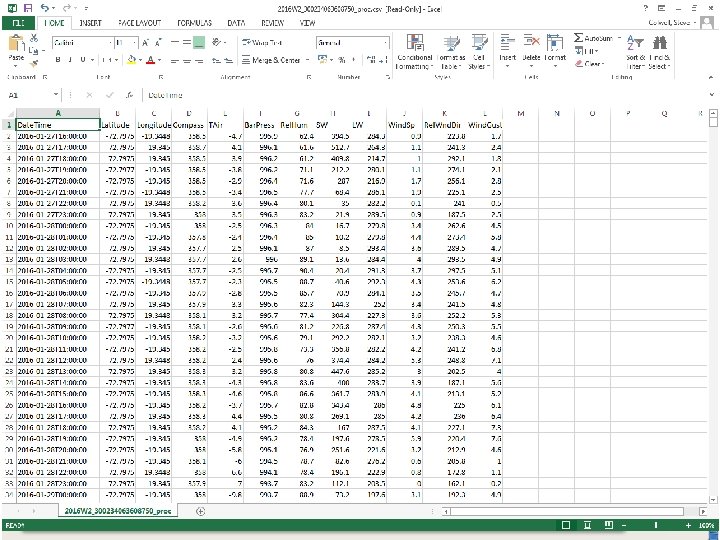
Technical specifications • Installed on a drifting buoy • CR 1000 logger • Measurements – Pressure, temperature, humidity, wind speed and direction, incoming short and long wave radiation. – GPS for position and a digital compass for wind direction correction. • Communication via 9602 SBD modem once an hour.

Deployed in the Weddell Sea
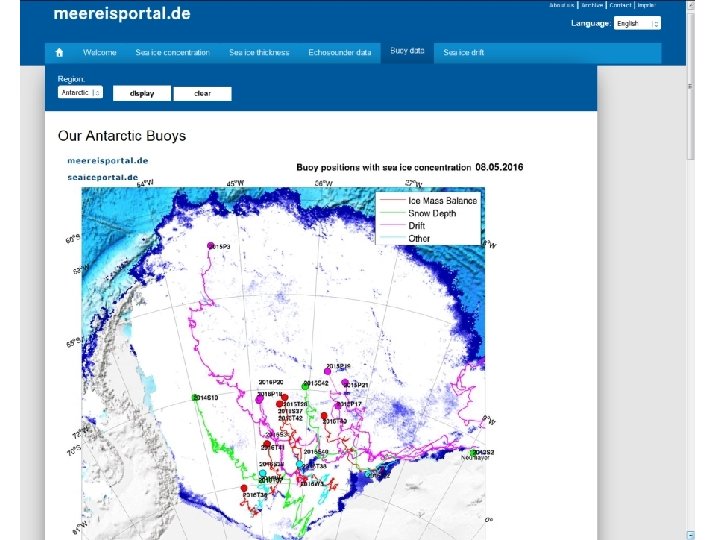

Questions • src@bas. ac. uk • https: //legacy. bas. ac. uk/met/READER/ • http: //basmet. nerc-bas. ac. uk/sos/ • http: //www. meereisportal. de/en. html
- Slides: 33