Data quality for polio eradication Accuracy reliability 5

Data quality for polio eradication: Accuracy & reliability 5 th Annual Disease Modelling Symposium, Seattle, 18 -20 April 2017 Research, Policy and Containment, Polio Eradication Department, World Health Organization, Geneva, Switzerland

Overview • Polio eradication status • Definition of accuracy & reliability • Main data collection systems (focus on AFP) – Indicators – Examples of use – Issues • Re-phrase questions • Summary

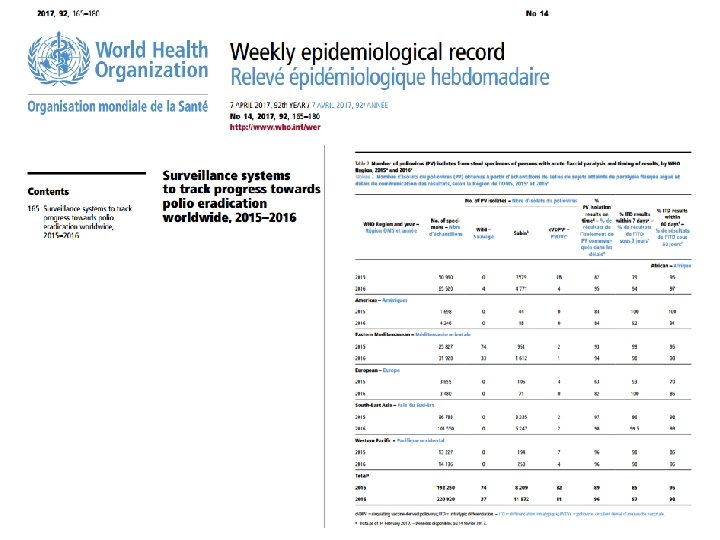
Wild Poliovirus & c. VDPV Cases 1, Past 12 months 2 Wild poliovirus type 1 c. VDPV type 22 Endemic country 1 Excludes viruses detected from environmental surveillance 2 Nigeria, 1 c. VDPV 2 healthy child contact of WPV 1 case (Borno, spec collection 26 Aug) 3 Onset of paralysis 05 April 2016 – 04 April 2017 3 Data in WHO HQ as of 10 April 2017

Definitions • Accuracy: – the fact of being correct and without any mistakes – accuracy is also the agreement of particular measurement with an accepted standard. • Reliability: – the quality or state of being reliable – the extent to which an experiment, test, or measuring procedure yields the same results on repeated trials
 – AFP (Acute Flaccid Paralysis) case data,")
Data sources • POLIS (Polio Information System) – AFP (Acute Flaccid Paralysis) case data, including demographic, epidemiological, vaccination & virological data – ES (Environmental surveillance) – Supplemental immunization activity data (SIAs) (dates, geographic extent, and vaccine used) • Lot Quality Assurance Sampling (LQAS) – Quality (coverage) of supplemental immunization activities (SIAs) • Routine immunization data (maintained by IVB) – Down to 1 st level subnational division levels • Additional program evaluation – Seroprevalence surveys

Pakistan: Environmental Surveillance Persistent and recurrent positives in Quetta and Peshawar major concern Lahore Multan Rawalpindi Karachi Peshawar Quetta Block 6

AFP Surveillance • Case-based information – Immediate reporting of suspected cases from reporting site (CLINIC) – Detailed investigation & sample collection (case report form) (POLIO SURVEILLANCE STAFF) – Stool samples sent for virology to respective laboratories (NETWORK LABORATORY) – 60 -day follow-up investigation for presence / absence of paralysis (POLIO SURVEILLANCE STAFF) • Network of surveillance sites (POLIO SURVEILLANCE STAFF) – Down to district hospitals, community informants – Immediate reporting, monthly negative reporting, active weekly visits • National Polio Expert Committee (NPEC) – Classification of reported cases
 • The primary objective of the Polio Information System")
Pol. IS (Polio Information System) • The primary objective of the Polio Information System (Pol. IS) is to harmonize and consolidate data from various sources – Most of the data managed come to us through existing “systems” which report data in varying degrees of quality, therefore: • We have very little control of the input • Pol. IS must process the file to ensure quality

Pol. IS data quality – Reference data • Statistics and examples of the reference data

AFP Surveillance Quality Indicators • Non-polio AFP rate: – >2 cases per 100, 000 population <15 years of age – [indicator valid even in absence of paralysis caused by poliovirus] • Stool adequacy rate: – >80% of AFP cases with two adequate stool samples (within 14 days of onset of paralysis, >24 hours apart, etc). – [indicator provides information of quality of whole system]

Non-polio AFP Rate, Worldwide, by Country February 2015 – January 2016 February 2016 – January 2017 < 0. 5 - 0. 99 >1 No AFP Surveillance/data Data in WHO HQ as of 14 March 2017 The boundaries and names shown and the designations used on this map do not imply the expression of any opinion whatsoever on the part of the World Health Organization concerning the legal status of any country, territory, city or area or of its authorities, or concerning the delimitation of its frontiers or boundaries. Dotted lines on maps represent approximate border lines for which there may not yet be full agreement. © WHO 2017. All rights reserved
 February 2016 – January 2017 (Rolling 12")
Surveillance Indicators, Endemic Regions (AFRO and EMRO) February 2016 – January 2017 (Rolling 12 months) Non-polio AFP rate <1 1 – 1. 99 >= 2 Non-polio AFP rate is >2/100, 000 Adequate stool collection percentage < 50% 50 – 79. 99% >= 80% Data in WHO HQ as of 14 March 2017 The boundaries and names shown and the designations used on this map do not imply the expression of any opinion whatsoever on the part of the World Health Organization concerning the legal status of any country, territory, city or area or of its authorities, or concerning the delimitation of its frontiers or boundaries. Dotted lines on maps represent approximate border lines for which there may not yet be full agreement. © WHO 2017. All rights reserved

Issues with Data Quality • General: – – Case reporting forms are not completely standardized No two country surveillance systems are identical Case reporting form completion quality variable 60 -day follow-up not implemented everywhere • Specifically (one example): – Immunization histories most problematic • Often no routine immunization records • Always no SIAs dose records (due to program instructions) • Affected by further biases, including parents with paralyzed child often not willing to admit that they did not vaccinate child • Indicators: – Not able to distinguish well- from less well performing countries
 in Africa")
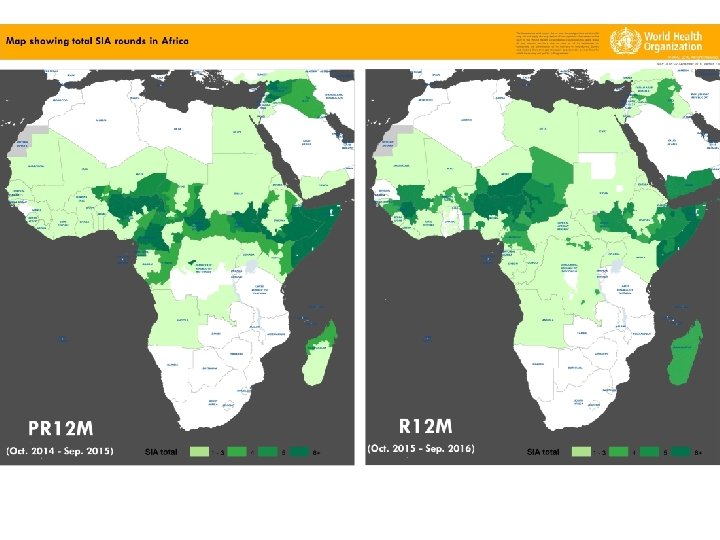
Map showing immunization status of NPAFP cases (6 -59 months) in Africa

Re-phrase question I • Is the AFP system quality good enough for public health purposes? – Documented the disappearance of wild poliovirus transmission in all but 3 countries. – Formed the backbone for Regional Certification in 4 WHO Regions (AMR, WPR, EUR, SEAR) – Undoubtedly, it will form the base for global certification (supplemented environmental & other forms of surveillance) • Does it needs to be improved? – Without question, silent areas need to be addressed, and the variability between countries and Regions needs to be decreased.

Re-phrase question II • Is the system good enough for modelling purposes? – Qualified yes. The key for any modelling exercise is identify key drivers and to include sensitivity analysis. – "All models are wrong, but some are useful". Let's maximize the usefulness of modelling.
; large number of")
AFP Data Summary • System is unique (global case-based surveillance system); large number of variables • 165 countries provide AFP data to WHO • Complemented by laboratory system (146 laboratories processing >220, 000 samples -annual accreditation) • The systems quality, including data quality, depends on the diligence and professionalism of each person involved • Continuous improvements are a must (total quality management should be considered)

Thank You!

Population immunity: progress and gaps Sero-survey among children 6 -11 months, Nov 16 - Feb 17 (preliminary results) • Seroprevalence high for Types 1 and 3. (Except Pishin, driven by pockets of seronegative children). • Type 2 low- many of the study children born after the t. OPV to b. OPV switch and routine immunization is sub-optimal. 21
- Slides: 21