Data Primary and Secondary Data Primary data is


 age b) height")
 or numerical variables. a age b weight")


- Slides: 37
Data
Primary and Secondary Data Primary data is data that you collect; while Secondary data is data collected from external sources such as the internet, television, radio, newspapers, magazines, journals, research papers, reviews or by hearsay. It is usually in the form of a ready-made product, so averages, conclusions, etc. are already calculated and stated. Why would secondary data be used in preference to primary data?
Collecting Data A sample collects data from a representative group of the population. It is important for the sample to be unbiased (that is, not leaning towards one side of the issue). A census collects data from the entire target population. Random selection ensures all subjects have an equal chance of inclusion in the sample. Random samples can be obtained by: 1. using a computer program which selects randomly 2. using a table of random numbers (after assigning each person a number) 3. drawing a name out of a hat 4. using an alphabetical listing, selecting names at regular intervals
Census or Sample? State whether a census or sample survey be used to investigate each: a the number of goals scored each week by a netball team b the heights of the members of a football team c the most popular radio station d the number of children in an Australian family e the number of loaves of bread bought each week by a family f the types of pets owned by a class of students g the star ratings of different brands of washing machines h the numbers of leaves on the stems of plants i the amount of sunshine each day j the number of people who die from cancer each year k the amount of rainfall each month l the time spent doing homework each night m the countries of origin of immigrants n the most popular colours of cars o the numbers of pets owned by students in a class p the genders of school principals q the number of cars passing through an intersection r the sports played by students in high schools s the stopping distances of cars
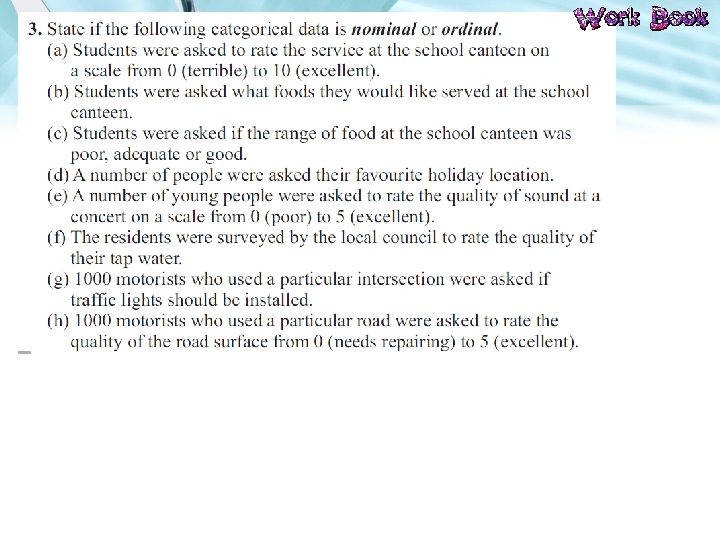
Categorical Data This kind of data involves things that go into categories and not numbers. It is also referred to as nominal data. Some examples are hair colour (brown, black, red, blonde etc), car brand (holden, ford, mazda, toyota etc) and favourite sport (cricket, rugby league, soccer etc). Ratings scales (like 1=love, 2=neutral, 3=dislike) are also examples of categorical data.
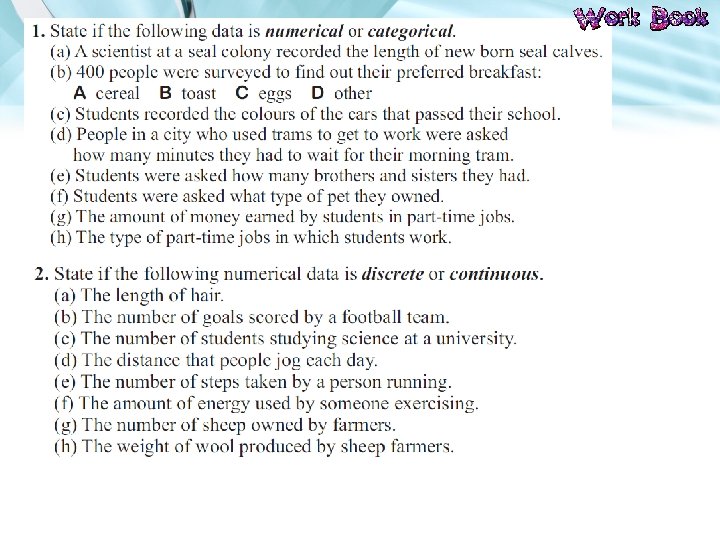
Numerical Data This is data which takes numerical values. It can be discrete (whole numbers only) or continuous (can take any values). Examples might be shoe sizes (discrete ) or height of seedlings (continuous).
Decide whether the following numerical values are discrete or continuous. a) age b) height c) number of people in your family d) speed of a car e) number of words in a book f) amount of money in your wallet g) length of your hair
Decide whether the following are nominal (categorical) or numerical variables. a age b weight c the method of travel to school d eye colour e the time spent talking on the telephone f the number of people in your family g the speed of a car h hair colour i favourite TV show j type of pet k the temperature during the day l the number of aces served by a tennis player m the number of goals scored by a soccer team n the mass of grapes in a bunch o the number of grapes in a bunch p the length of a line
Bias occurs when a sample is more likely to give one answer than another – like asking football fans at a match what their favourite football team is. Suggest the possible bias in each of the following samples. a people surveyed by phone during the day b people surveyed at a train station c people selected from year 7 in a school if you want to know about the WHOLE school d ten people tested with a new drug
Explain and discuss any possible bias in the following samples. a people surveyed by phone on a Saturday night b people at a bus stop c people in a supermarket carpark d people at the beach e people in your street f businesses selected from the Yellow Pages phone directory g people selected from the electoral roll h Year 7 students are interviewed about school uniform changes. i Motorists stopped in peak hour are interviewed about traffic problems. j Real estate agents are interviewed about house prices. k Politicians are interviewed about the state of the country’s economy. l People are asked to phone in to register their vote on an issue. m An opinion poll is conducted by posting a questionnaire to people. n A manufacturing company tests a sample of its products every Monday morning.
Describe the sample you would choose if you wanted to gather support to: a stop smoking in public areas b improve the local bus service c increase the number of books in the public library d improve the facilities in the school’s senior common room e stop logging in national parks f increase unemployment benefits g reduce tariff s on farm products h reduce bank fees 6 What would be a suitable sample to survey if you wanted to: a investigate the suitability of bus timetables on a certain route? b collect information about the effects of road tax on company profits? c gather data about the effects on a town of closing its only bank? d investigate the success of a new treatment for ticks and fleas on dogs? e find the most popular brand of dishwasher? f investigate the reasons for bank charges?
These questions have been suggested for use in a survey about school uniforms. Comment on their appropriateness and possible responses. Reword if necessary. a Do you like the present uniform? b Do you want to wear a uniform? c What is your favourite colour? d How old are you? e Have you attended a school that doesn’t have a uniform? f Is your uniform comfortable? These questions have been suggested for use in a survey of what people watch on TV. Comment on their appropriateness and possible responses. Reword if necessary. a Do you own a TV? b Do you watch TV? c How many TVs are there in your house? d What is your favourite program? e Do you like sport? f Which is your favourite channel? g Do you lie down while watching TV?
f Draw a frequency histogram and polygon of the data g Draw a frequency histogram and polygon of the data
j 4 Draw a frequency histogram and polygon of the data
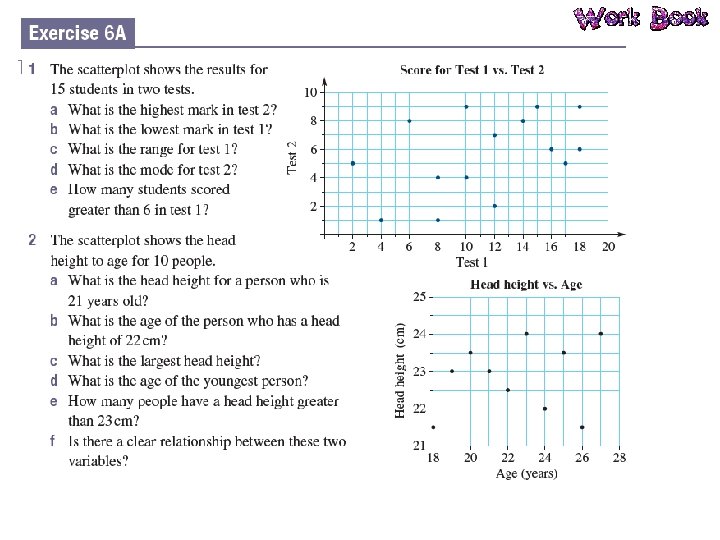
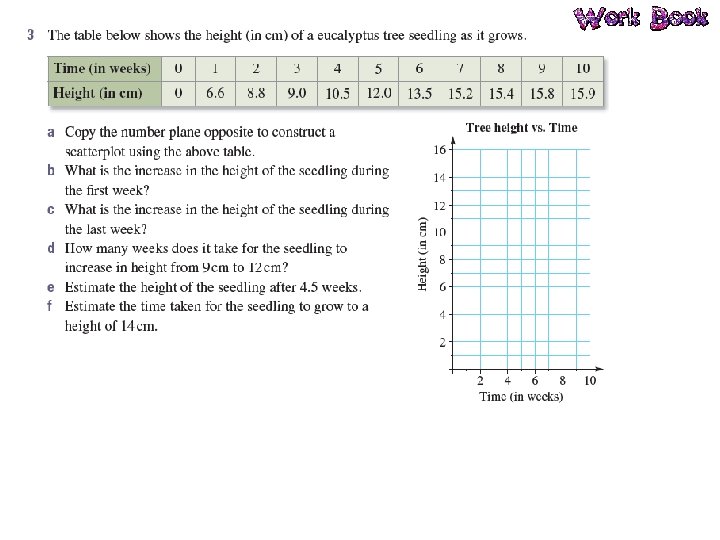
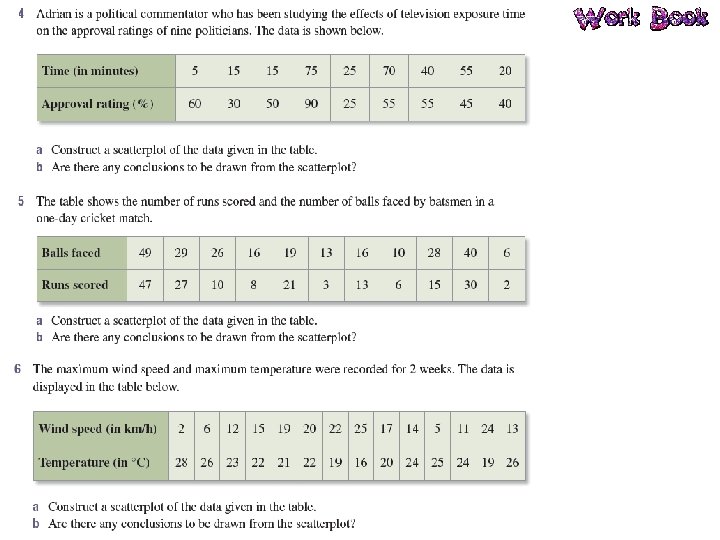
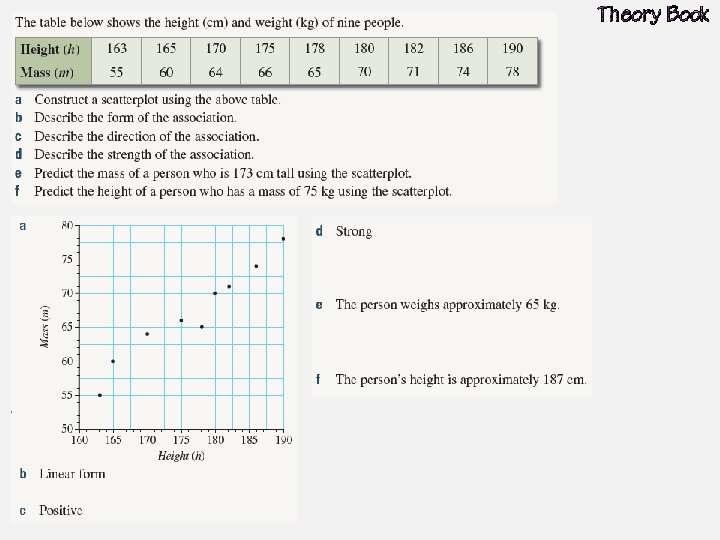
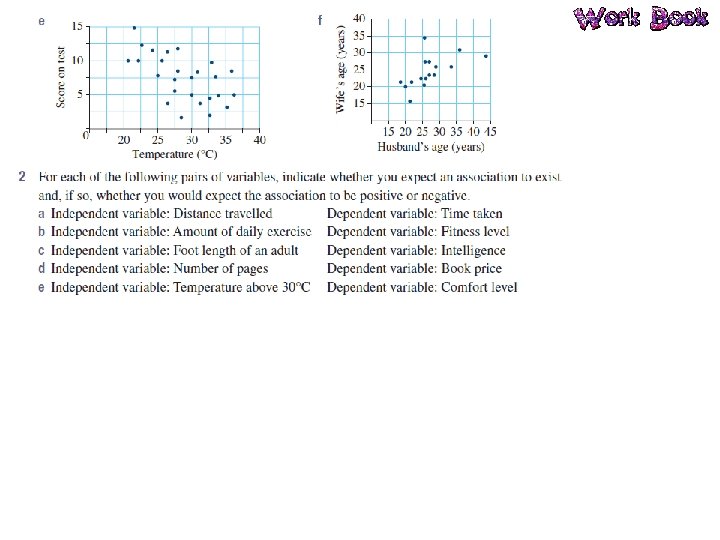
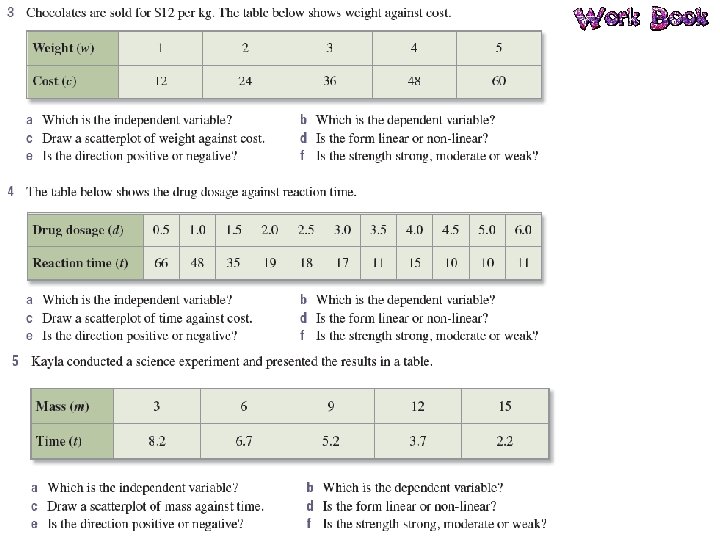
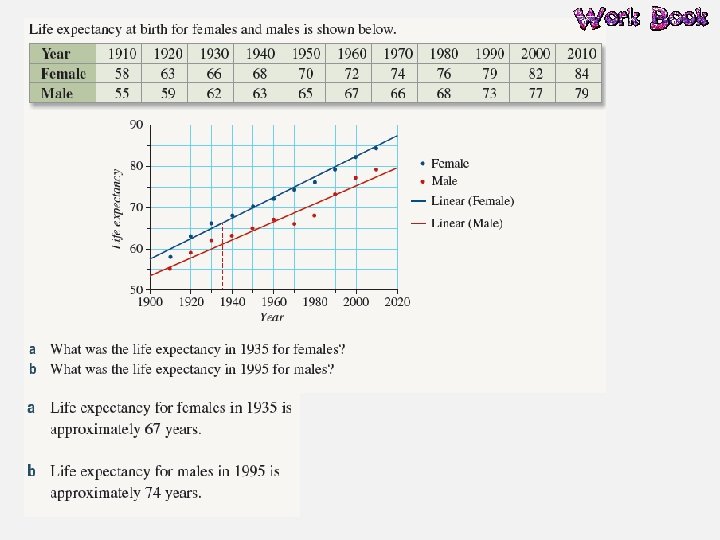
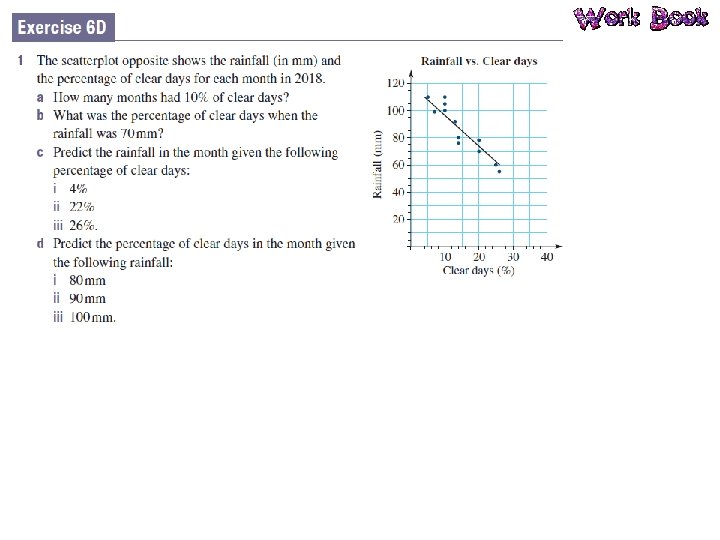
Bivariate Data Bivariate data is data that has two variables. A scatterplot is used to determine if there is a relationship between two numerical variables. Data is collected on the two variables and often displayed in a table of ordered pairs. A scatterplot is a graph of the ordered pairs of numbers. Each ordered pair is a dot on the graph. The first variable is called the INDEPENDENT variable (goes on the horizontal axis), the second is the DEPENDENT variable (goes on the vertical axis).
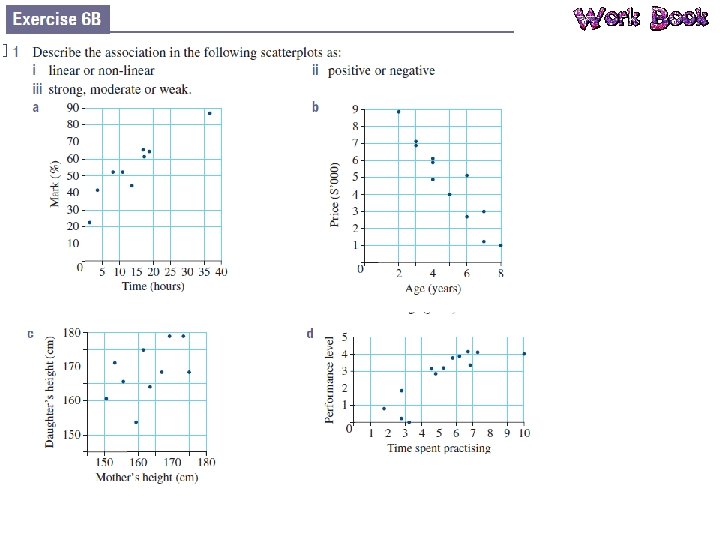
Relationships in the Data What patterns can you see in the data? Positive Negative Non-linear We also identify the strength of the relationship: Strong Moderate Weak
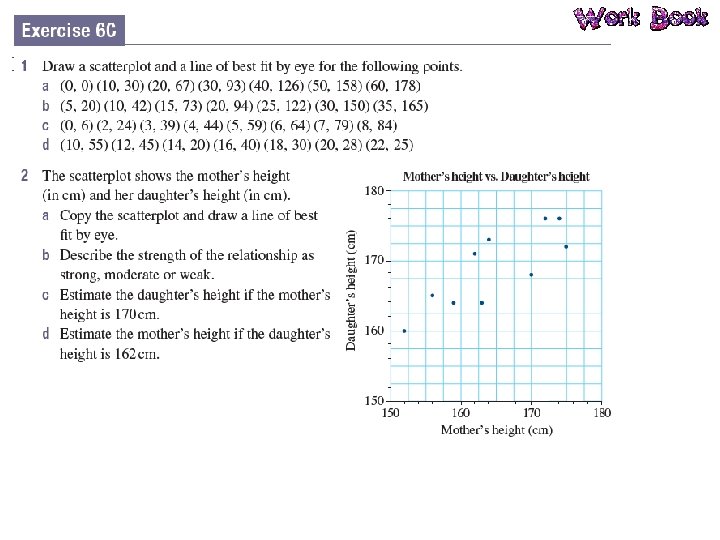
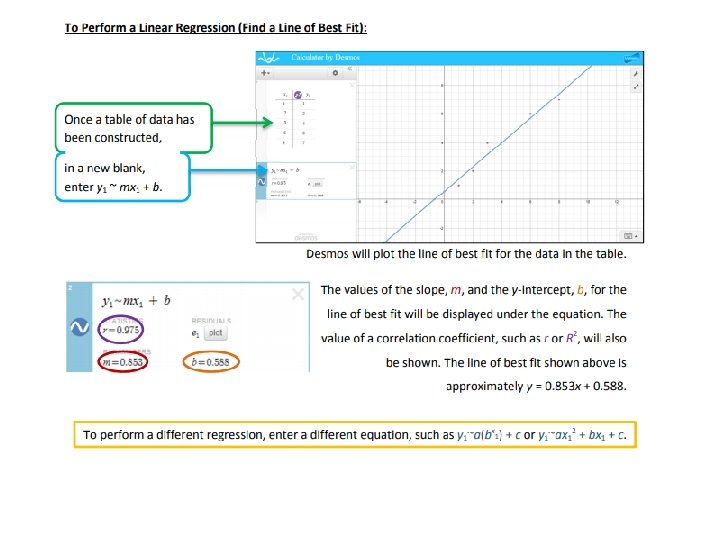
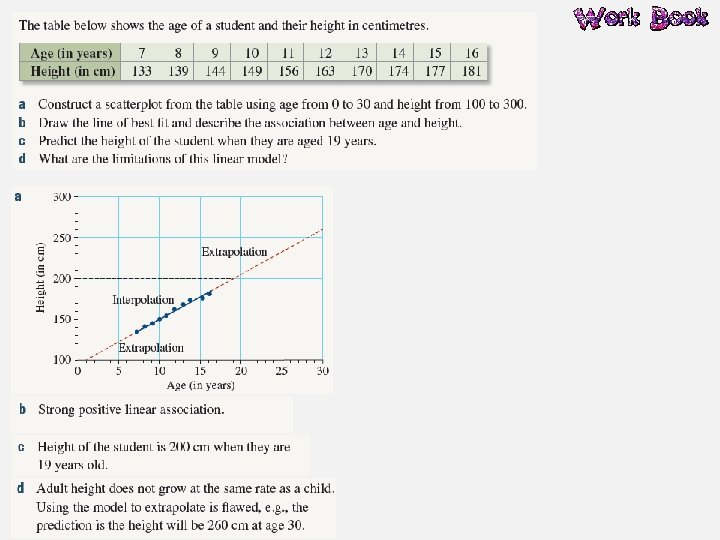
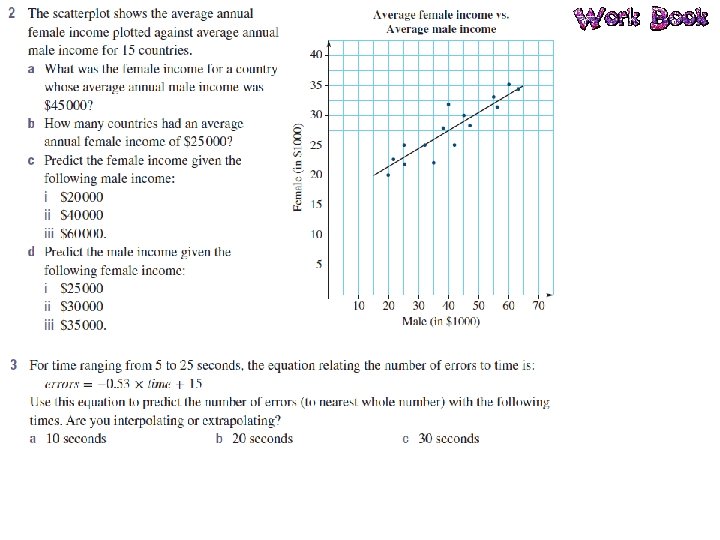
Line of Best Fit A line of best fit is a straight line that approximates a linear association between points. The equation of the line of best fit is found using the gradient– intercept formula: y = mx + c. The line of best fit is used to make a prediction about one of the variables.
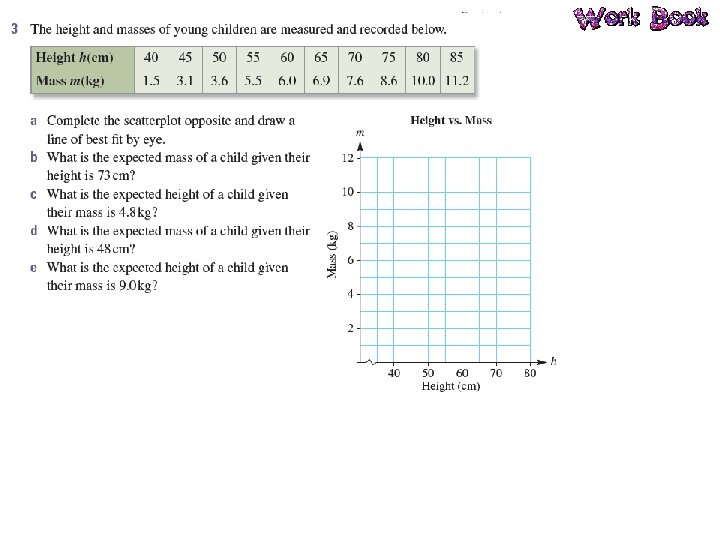
Interpolation and Extrapolation Interpolation is the use of the linear regression line to predict values within the range of the dataset. If the data has a strong linear association then we can be confident our predictions are accurate. However, if the data has a weak linear association, we are less confident with our predictions. Extrapolation is the use of the linear regression line to predict values outside the range of the dataset. Predicted values are either smaller or larger than the dataset. The accuracy of predictions using extrapolation depends on the strength of the linear association of the data.