Data Prefetching Mechanism by Exploiting Global and Local
Data Prefetching Mechanism by Exploiting Global and Local Access Patterns Ahmad Sharif Hsien-Hsin S. Lee The 1 st JILP Data Prefetching Championship (DPC-1) Qualcomm Georgia Tech

Can OOO Tolerate the Entire Memory Latency? • OOO can hide certain latency but not all • Memory latency disparity has grown up to 200 to 400 cycles • Solutions – – Larger and larger caches (or put memory on die) Deepened ROB: reduced probability of right path instructions Multi-threading Timely data prefetching D-cache miss ROB Load miss ROB full Untolerated Miss latency Independent instructions filled No productivity ROB entries De-allocated Date returned Machine Stalled Revised from “A 1 st-order superscalar processor model in ISCA-31 2
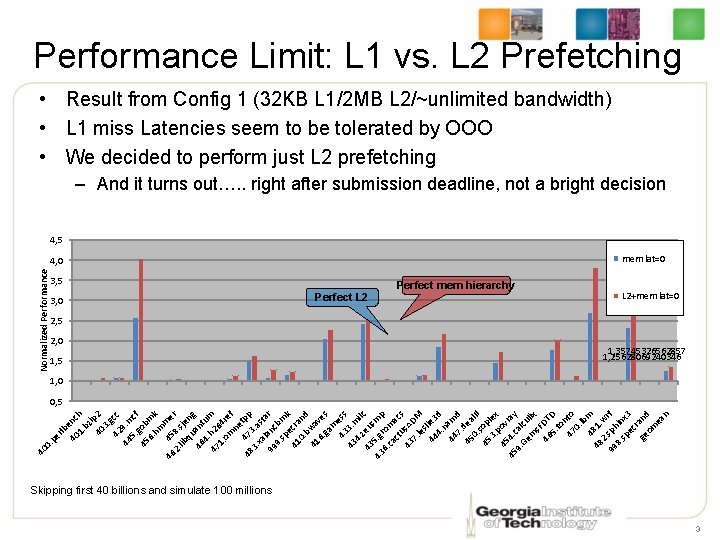
Performance Limit: L 1 vs. L 2 Prefetching • Result from Config 1 (32 KB L 1/2 MB L 2/~unlimited bandwidth) • L 1 miss Latencies seem to be tolerated by OOO • We decided to perform just L 2 prefetching – And it turns out…. . right after submission deadline, not a bright decision 4, 5 mem lat=0 Normalized Performance 4, 0 3, 5 3, 0 Perfect L 2 Perfect mem hierarchy L 2+mem lat=0 2, 5 2, 0 1, 5 1, 35745326562857 1, 25628069240346 1, 0 40 0 . p er lb 40 enc 1. h bz i 40 p 2 3. g 42 cc 9 44. m 5. cf g 45 ob 6. mk hm 46 45 me 2. 8. s r lib je qu ng 46 ant u 4 47. h 26 m 1. 4 r om e ne f 48 473 tpp 3. . a xa st 99 lanc ar 9. bm sp k 41 ecra 0. nd b 41 wa 6. ve ga s m 43 ess 43 3. m 4. il 43 zeu c s 5 43. g mp 6. rom ca ct acs u 43 s. A 7. DM le s 44 lie 3 4. d n 44 am 7. d 45 dea 0. l. II s 45 op 3. lex p 4 ov 45 54. c ray 9. al Ge cu m lix s. F 46 DT 5. D to n 47 to 0. lb 48 m 48 1. 2 w 99. sph rf 8. in sp x 3 ec r ge and om ea n 0, 5 Skipping first 40 billions and simulate 100 millions 3
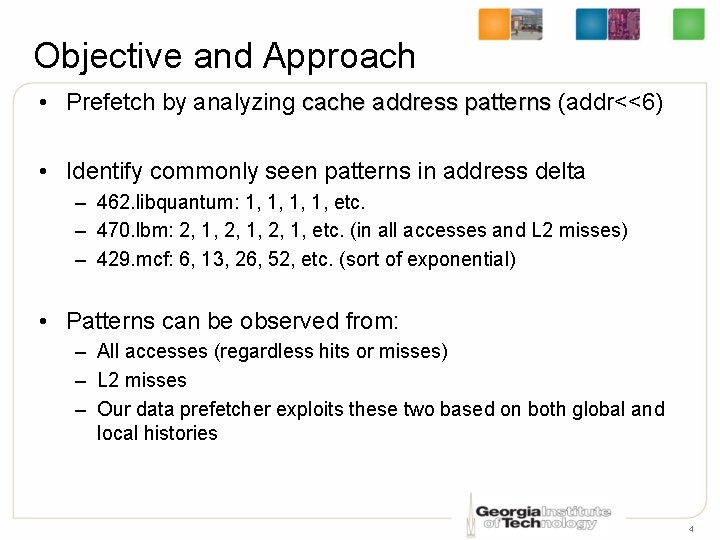
Objective and Approach • Prefetch by analyzing cache address patterns (addr<<6) • Identify commonly seen patterns in address delta – 462. libquantum: 1, 1, etc. – 470. lbm: 2, 1, etc. (in all accesses and L 2 misses) – 429. mcf: 6, 13, 26, 52, etc. (sort of exponential) • Patterns can be observed from: – All accesses (regardless hits or misses) – L 2 misses – Our data prefetcher exploits these two based on both global and local histories 4
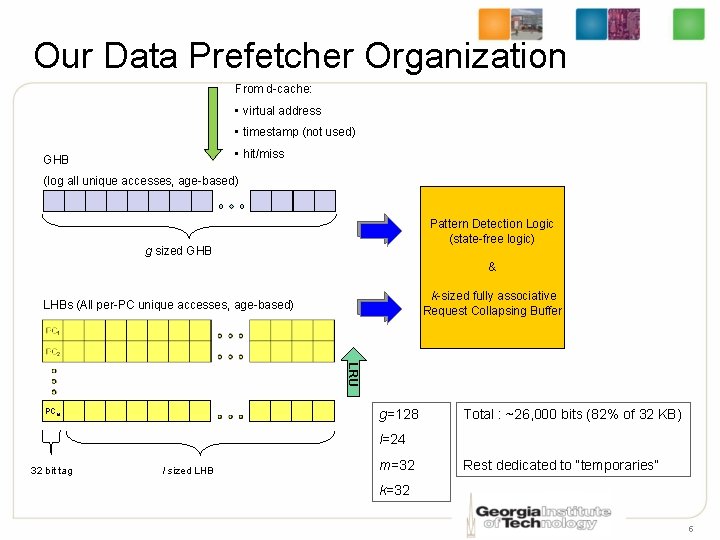
Our Data Prefetcher Organization From d-cache: • virtual address • timestamp (not used) • hit/miss GHB (log all unique accesses, age-based) Pattern Detection Logic (state-free logic) g sized GHB & k-sized fully associative Request Collapsing Buffer LHBs (All per-PC unique accesses, age-based) LRU g=128 PCm Total : ~26, 000 bits (82% of 32 KB) l=24 32 bit tag l sized LHB m=32 Rest dedicated to “temporaries” k=32 5
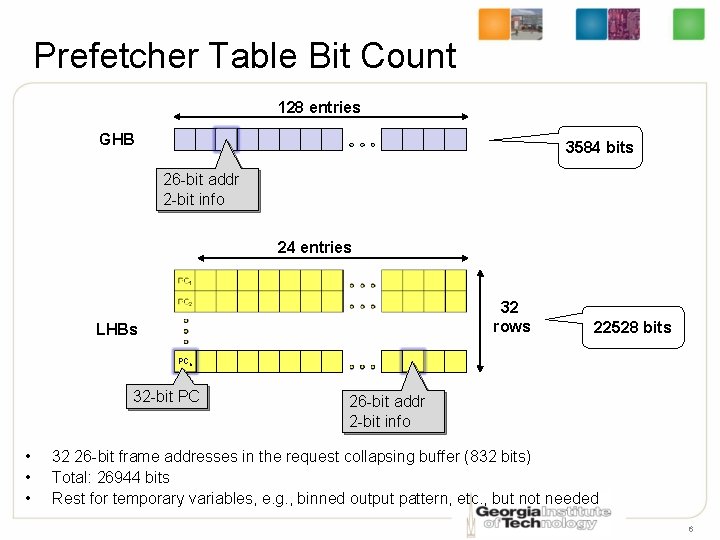
Prefetcher Table Bit Count 128 entries GHB 3584 bits 26 -bit addr 2 -bit info 24 entries 32 rows LHBs 22528 bits PCn 32 -bit PC • • • 26 -bit addr 2 -bit info 32 26 -bit frame addresses in the request collapsing buffer (832 bits) Total: 26944 bits Rest for temporary variables, e. g. , binned output pattern, etc. , but not needed 6
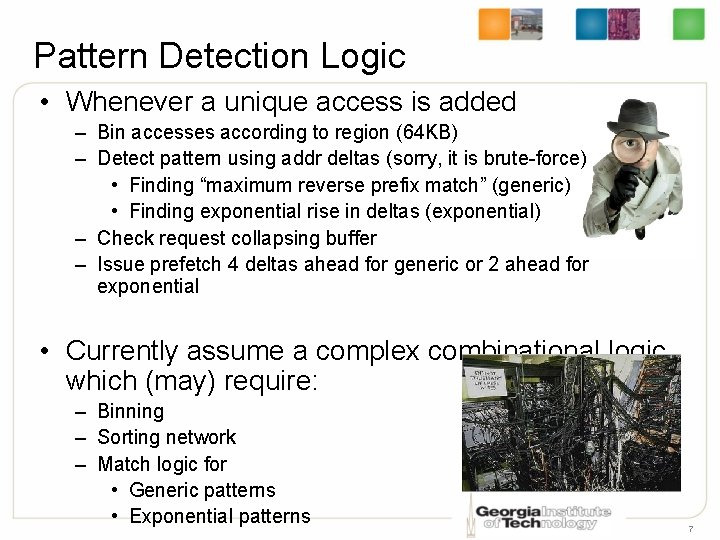
Pattern Detection Logic • Whenever a unique access is added – Bin accesses according to region (64 KB) – Detect pattern using addr deltas (sorry, it is brute-force) • Finding “maximum reverse prefix match” (generic) • Finding exponential rise in deltas (exponential) – Check request collapsing buffer – Issue prefetch 4 deltas ahead for generic or 2 ahead for exponential • Currently assume a complex combinational logic which (may) require: – Binning – Sorting network – Match logic for • Generic patterns • Exponential patterns 7
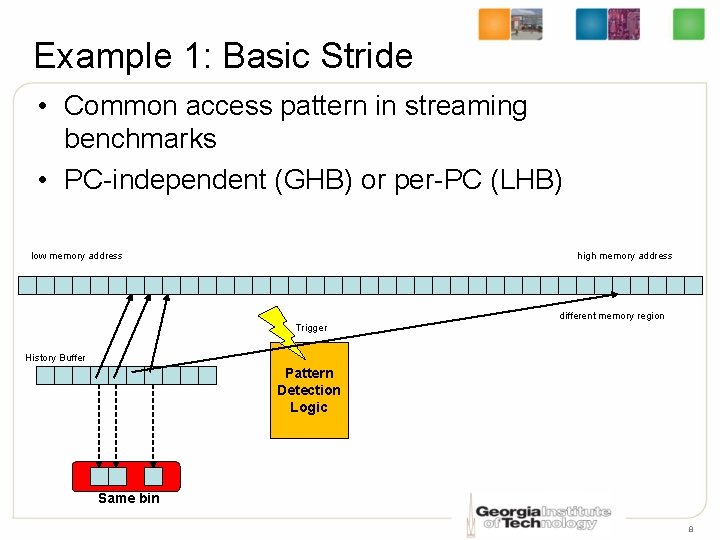
Example 1: Basic Stride • Common access pattern in streaming benchmarks • PC-independent (GHB) or per-PC (LHB) low memory address high memory address different memory region Trigger History Buffer Pattern Detection Logic Same bin 8
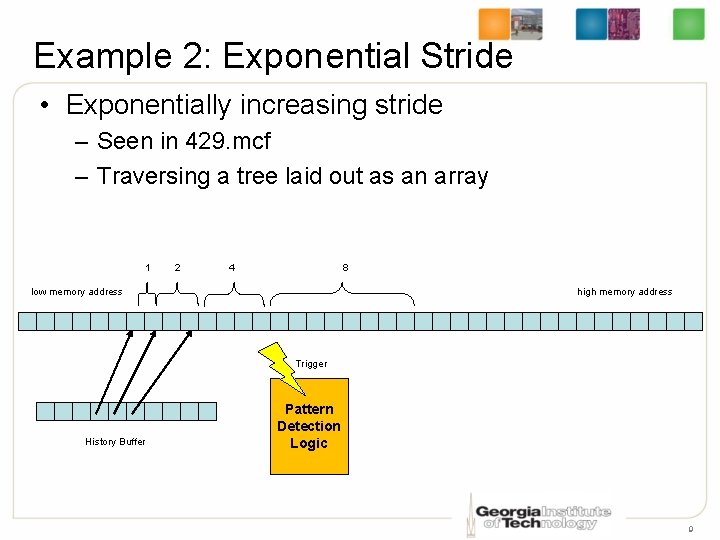
Example 2: Exponential Stride • Exponentially increasing stride – Seen in 429. mcf – Traversing a tree laid out as an array 1 2 4 8 low memory address high memory address Trigger History Buffer Pattern Detection Logic 9
Example 3: Pattern in L 2 misses • Stride in L 2 misses – with deltas (1, 2, 3, 4, …) – Issue prefetches for 1, 2, 3, 4 – Observed in 403. gcc • Accessing members of an Ao. S – Cold start – Members are separate out in terms of cache lines – Footprint is too large to accommodate the Ao. S members in cache 10
Example 4: Out of Order Patterns • Accesses that appear out-of-order – (0, 1, 3, 2, 6, 5, 4) with deltas (1, 2, -1, 4, -1) – Ordered (0, 1, 2, 3, 4, 5, 6) issue prefetches for stride 1 – See the processor issue memory instructions out-oforder – No need to deal with if prefetcher sees memory address resolution in program order • Can be found in with any program as this is an artifact due to OOO 11
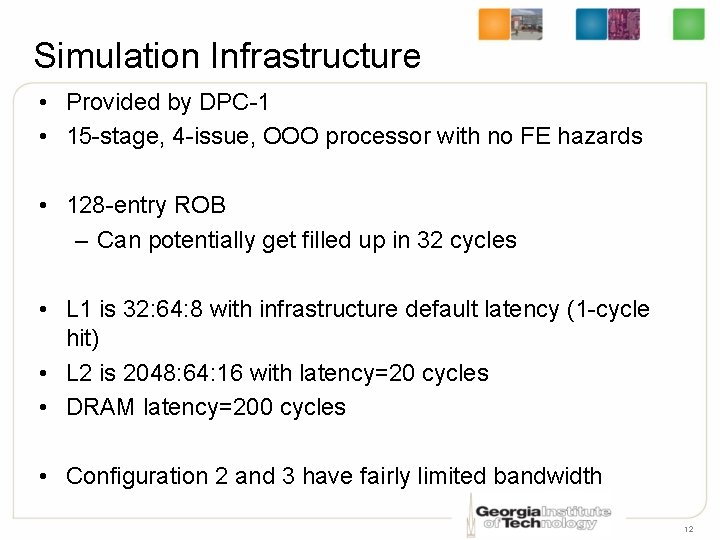
Simulation Infrastructure • Provided by DPC-1 • 15 -stage, 4 -issue, OOO processor with no FE hazards • 128 -entry ROB – Can potentially get filled up in 32 cycles • L 1 is 32: 64: 8 with infrastructure default latency (1 -cycle hit) • L 2 is 2048: 64: 16 with latency=20 cycles • DRAM latency=200 cycles • Configuration 2 and 3 have fairly limited bandwidth 12
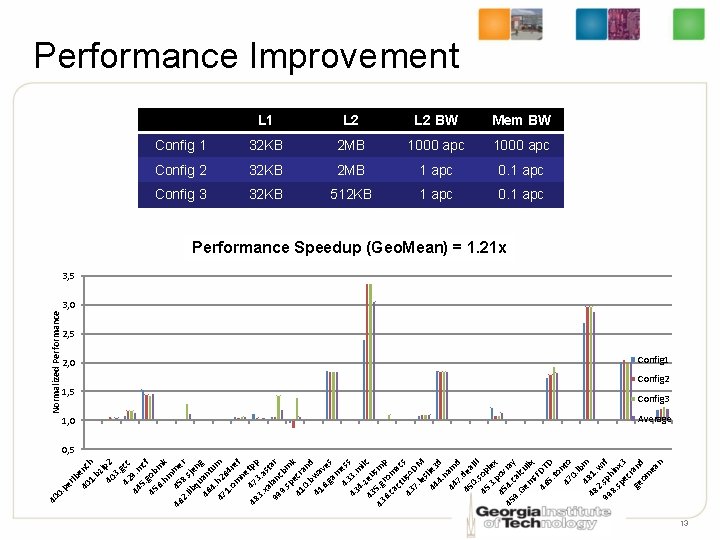
lb 40 enc 1. h bz i 40 p 2 3. 42 gcc 44 9. m 5. cf 45 gob 6. mk hm 46 45 me 2. 8. r lib sje qu n 46 an g 4 tu 47. h 2 m 1. 64 om re ne f 4 48 7 tpp 3. 3. a xa st 99 lanc ar 9. bm sp k 41 ecra 0. nd b 41 wa 6. ve ga s m 43 ess 43 3. m 4. i 43 zeu lc s 43 5. g mp 6. rom ca ct ac s 43 us. A 7. DM le s 44 lie 3 4. d n 44 am 7. d 45 dea 0. l. II 45 sop 3. lex 45 pov 45 4. c ray 9. al Ge cu m lix s. F 46 DT 5. D to 47 nto 0. lb 48 m 48 1. 2 w 99. sph rf 8. in sp x 3 ec ge rand om ea n er . p 40 0 Normalized Performance Improvement 2, 0 1, 5 1, 0 L 1 L 2 BW Mem BW Config 1 32 KB 2 MB 1000 apc Config 2 32 KB 2 MB 1 apc 0. 1 apc Config 3 32 KB 512 KB 1 apc 0. 1 apc Performance Speedup (Geo. Mean) = 1. 21 x 3, 5 3, 0 2, 5 Config 1 Config 2 Config 3 Average 0, 5 13
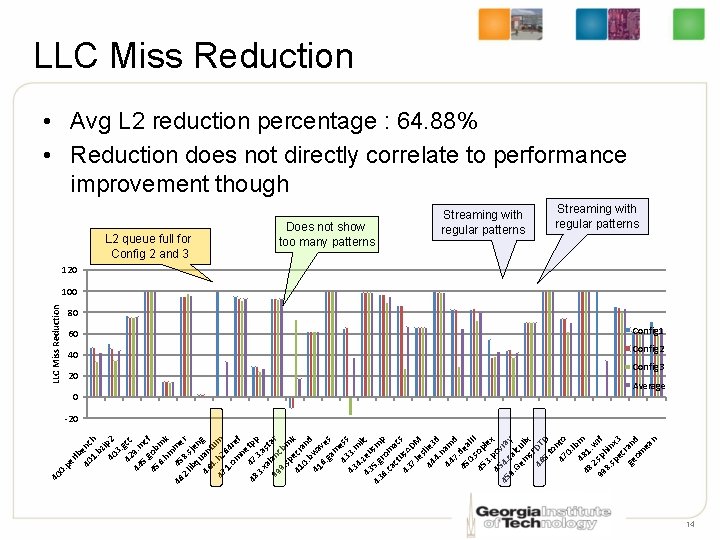
lb 40 enc 1. h bz i 40 p 2 3. 42 gcc 44 9. m 5. c 45 gob f 6. m hm k 46 45 me 2. 8. r lib sje qu n 46 an g 4 tu 47. h 2 m 1. 64 om re ne f 4 48 7 tpp 3. 3. a xa st 99 lan ar 9. cbm sp k 41 ecr 0. an b d 41 wa 6. ve ga s m 43 ess 43 3. m 4. i 43 zeu lc s 5 43. g m 6. ro p ca m ct ac 43 us. A s 7. DM le s 44 lie 3 4. d n 44 am 7. d 45 dea 0. l. II 45 sop 3. lex 45 pov 45 4. ray 9. cal Ge cu m lix s. F 46 DT 5. D to 47 nto 0. lb 48 m 48 1 2. w 99. sph rf 8. in sp x 3 ec ge rand om ea n er . p 40 0 LLC Miss Reduction • Avg L 2 reduction percentage : 64. 88% • Reduction does not directly correlate to performance improvement though L 2 queue full for Config 2 and 3 60 40 20 0 Does not show too many patterns Streaming with regular patterns 120 100 80 Config 1 Config 2 Config 3 Average -20 14
Wish List for a Journal Version • To make it more hardware-friendly (logic freak or more tables needed? ) • Prefetch promotion into L 1 cache (our ouch) • Better algorithm for more LHB utilization • Improve Scoring System for Accuracy • Feedback using closed loop 15
Conclusion • GHB with LHBs shows – A “big picture” of program’s memory access behavior – Program history repeats itself – Address sequence of Data access is not random • Delta Patterns are often analyzable • We achieve 1. 21 x geomean speedup • LLC miss reduction doesn’t directly translate into performance – Need to prefetch a lot in advance 16

THAT’S ALL, FOLKS! ENJOY HPCA-15 Georgia Tech ECE MARS Labs http: //arch. ece. gatech. edu 17
- Slides: 17