Data Pipeline Selection and Optimization DOLAP 2019 Alexandre


: 1. 2. 3. 4. 5. A configuration space")


: decrease")

 removing the")


- Slides: 21
Data Pipeline Selection and Optimization DOLAP 2019 Alexandre Quemy IBM Politechnika Poznańska
The hard life of data scientists Question: If we know data are so important, why we treat them less seriously than algorithms?
Data Pipeline Optimization Dealing with missing value: Discarding? Row? Column? Imputation? What imputation? Mean? Median? Model-based? What model? Imbalanced datasets: Downsampling? Oversampling? Nothing? What bias it implies? Data too large: Dimensional reductions: what algorithm? PCA? normalization or not? Subsampling: what technique? what bias? Outliers detection and curation: What threshold? What deviation measure? Trimming? Truncating? Censoring? Winsorizing? Encoding for method domain requirements: Discretization? Grid? What step? Cluster? What method? What hyperparameter? Categorial encoder? Binary? Hot-One? Helmert? Backward Difference? NLP: How many tokens? Size of m-grams?
Hyperparameter tuning Sequential Model-Based Optimization (SMBO): 1. 2. 3. 4. 5. A configuration space over which to search A metric to optimize (e. g. model accuracy, ROC AUC, etc. ) The surrogate model of the objective function A criteria to select the next promising configuration A history (score, configuration) Also called SMAC (Sequential Model-based Algorithms Configuration): Warmstarting of Model-Based Algorithm Configuration, Marius Lindauer, Frank Hutter, Conference on Artificial Intelligence (AAAI-18)
The usual workflow Data collection Raw data Data pipeline Operation 1 Operation 2 Model selection Operation 3 algorithm model 1 model 2 p metric model 3 metaoptimizer best model
Updated workflow Data collection Raw data Data pipeline O 22 O 11 O 21 O 12 O 23 p metaoptimizer metric? Model selection Best pipeline algorithm model 1 model 2 p metric model 3 metaoptimizer best model
Updated workflow Data collection Raw data Data pipeline O 22 O 11 O 21 O 12 O 23 metric Model selection Best pipeline algorithm model 1 model 2 p p metric model 3 metaoptimizer Feedback best model
Data Pipeline Optimization
Pipeline prototype ebalance: 4 operators ormalize: 5 operators eatures: 4 operators onfiguration space: 4750 configurations Baseline: (Id, Id)
Protocole • Datasets: Breast, Iris, Wine. • Methods: SVM, Random Forest, Neural Network, Decision Tree. • Dataset split: 60% for training set, 40% for test set. • Pipeline configuration space size: 4750 configurations. • Metaoptimizer: Tree Parzen Estimator (hyperopt) • Performance metric: Cross-validation accuracy • Budget: 100 configurations (~2% of the space) No algorithm hyperparameter tuning! Þ We want to quantify the influence of data pipeline Exhaustive search to compare between baseline and max score.
Results
1. 2. In average, with 20 iterations (0. 42% of the search space): decrease of error by 58% compared to the baseline 98. 92% in the normalized score space)
How close to the best pipeline, the good pipelines are?
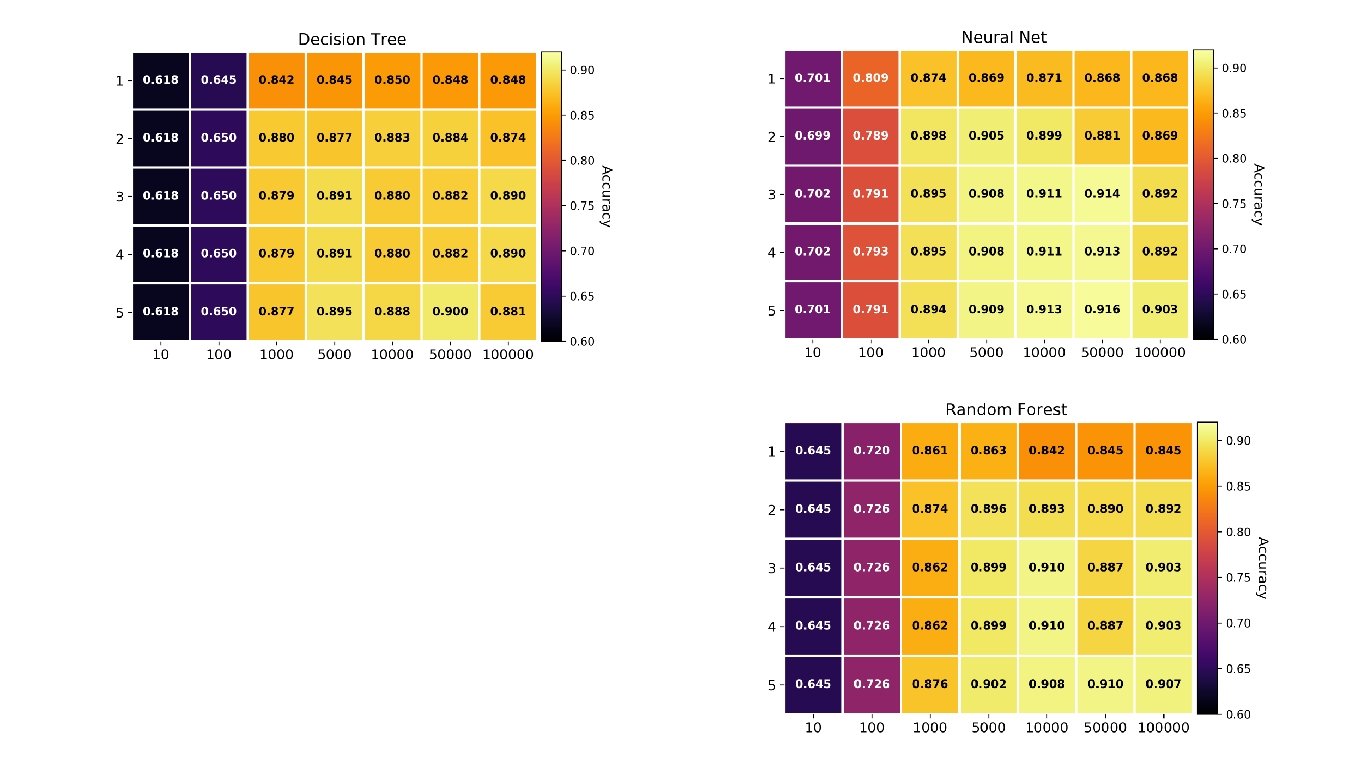
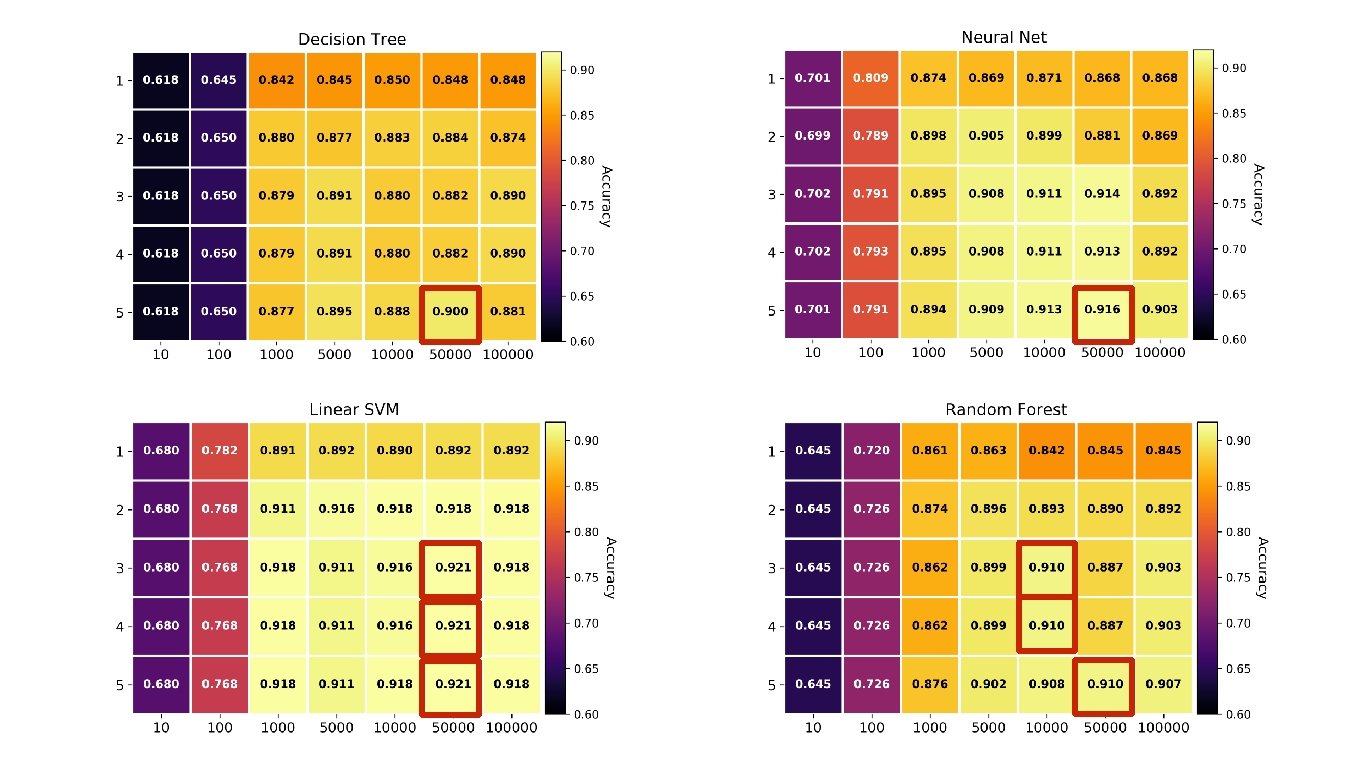
Data Pipeline Optimization Raw data: 1000 judgements from HUDOC (prev. 0. 5) removing the conclusion section Pipeline: Tokenization Stopword removal P-o-S tagging Lemmatization N-gram generation Bo. W projection Configuration space: Algorithms: Decision Tree, Neural Network, Random Forest and Linear SVM
Data Pipeline Optimization
Data Pipeline Optimization N: number of algorithms K: dimension of the configuration space r: a reference point p*: sample of optimal configurations For each optimal configuration r: 1. Build the sample w. r. t. to the algorithms: For each algorithm, select the optimal point that is the closest from the reference point. 2. Express the sample in normalized conf. space 3. Calculate the NMAD on the sample
D
Future work Work in progress: Tests on larger configuration spaces. Online / offline architecture. Metric between pipelines
Thank you Optimized Idea-generator Pipeline