DATA OVERVIEW Smitha Middle School Cobb County School

DATA OVERVIEW Smitha Middle School Cobb County School District 2008 -2013 LAUREN KINSELLA DR. WRIGHT ITEC 7305

PURPOSE The purpose of this presentation is to provide an overview of data for Smitha Middle School over a 5 year period. This will be done using demographic information and state assessment results. Data will be compared to district and state data. By the end of this presentation, educators will be able to use this information as a basis for classroom instruction.

DEMOGRAPHICS Smitha Middle School % of student population 250% 200% 150% 100% 50% 0% 2008 -2009 -2010 -2011 -2012 -2013 Black 49% 48% 44% 42% White 8% 9% 10% 8% 8% Hispanic 39% 41% 39% 40% 43% Asian 2% 3% 3% 4% 3% American Indian 0% 0% 0% Multi-racial 2% 0% 2% 3% 3%

OTHER DEMOGRAPHICS 2010 -2011 2009 -2010 2008 -2009

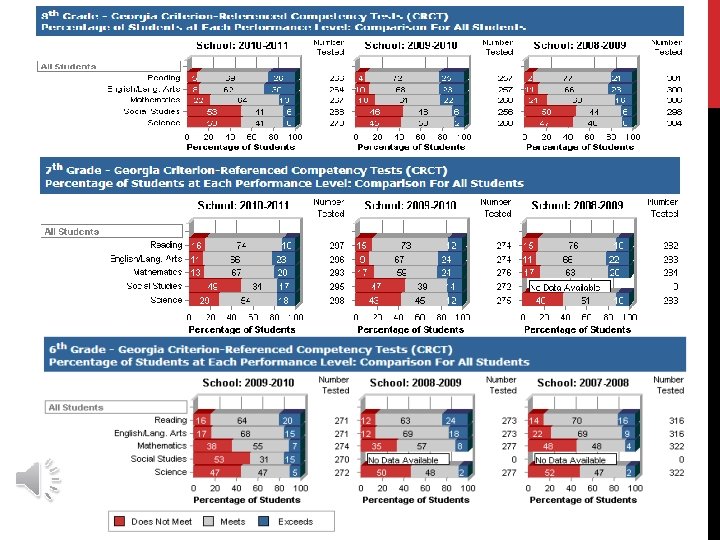
2008 -2009 Student Achievement 80, 00% Passing Percentage of Students 70, 00% 60, 00% 50, 00% 40, 00% 30, 00% 20, 00% 10, 00% School District State 6 th grade 37, 96% 62, 80% 55, 38% 7 th grade 45, 65% 74, 20% 65, 74% 8 th grade 44, 62% 66, 78% 57, 55% SMS number of enrolled students = 877

2009 -2010 Student Acheivement 90, 00% 80, 00% Passing Percentage of students 70, 00% 60, 00% 50, 00% 40, 00% 30, 00% 20, 00% 10, 00% School District State 6 th grade 44, 40% 69, 70% 61, 40% 7 th grade 56, 30% 78, 50% 70, 20% 8 th grade 40, 90% 61, 90% 52, 60% SMS number of enrolled students = 820

2010 -2011 Student Acheivement 80, 00% Passing Percentage of Students 70, 00% 60, 00% 50, 00% 40, 00% 30, 00% 20, 00% 10, 00% School District State 6 th grade 40, 60% 66, 88% 59, 58% 7 th grade 47, 32% 74, 80% 69, 71% 8 th grade 35, 53% 68, 12% 60, 04% SMS number of enrolled students = 910

8 th Grade Writing Test 2009 -2011 100% 90% 80% Passing Percentage 70% 60% 50% 40% 30% 20% 10% 0% 2008 -2009 -2010 -2011 School 68% 72, 40% 71, 50% District 83% 84, 90% 88, 70% State 75% 78, 80% 82, 70%

Smitha Middle School 2011 -2012 CRCT Scores 100% 90% 23% 16% 21% 25% 80% 70% 53% 60% 50% 43% 60% 67% 70% 40% 30% 20% 10% 32% 31% 10% 18% 5% 0% English Language Arts Mathematics Reading Does Not Meets Science Social Studies Exceeds School Subject Number Does Not Meets Exceeds Year Tested Meet 2011 -12 English Language 925 10% 67% 23% Arts Mathematics 926 18% 60% 21% Reading 926 5% 70% 25% Science 959 31% 53% 16% Social Studies 947 32% 43% 25%

2011 -2012 Smitha Middle School CRCT Scores Students with Disabilities Exceeds Reading Meets Mathematics English Language Arts Does Not Meet Students with Disabilities Subject Does Not Meets Exceeds Meet English 29% 67% 4% Language Arts Mathematics 39% 54% 6% Reading 0% 20% 40% 60% 39% 54% 8% 80% Students without Disabilities Exceeds Reading Meets Mathematics English Language Arts Does Not Meet 0% 20% 40% 60% 80% Students without disabilities Subject Does Not Meets Exceeds Meet English 6% 67% 26% Language Arts Mathematics 15% 61% 23% Reading 4% 69% 28%

2011 -2012 Smitha Middle School CRCT Scores Economically Disadvantaged 80% 70% 60% 50% English Language Arts 40% Mathematics 30% Reading 20% 10% Economically Disadvantaged Subject Does Not Meets Exceeds Meet English 11% 70% 19% Language Arts Mathematics 21% 63% 16% Reading 0% Does Not Meets 6% 74% 20% Exceeds Not Economically Disadvantaged 60% 50% 40% English Language Arts 30% Mathematics 20% Reading 10% 0% Does Not Meets Exceeds Not Economically Disadvantaged Subject Does Not Meets Exceeds Meet English 4% 55% 41% Language Arts Mathematics 9% 43% Reading 1% 54% 45%

2011 -2012 Smitha Middle School CRCT Scores Limited English Proficient Not Limited English Proficient

What’s next? • Strengths: • English/Language Arts and Reading • Weaknesses: • Science and Social Studies • Subgroups • Achievement Gaps? • Are you seeing achievement gaps in your classroom? • Are we doing everything we can for students with disabilities, economically disadvantaged students, and students with limited English proficiency?
- Slides: 14