Data Movement Visualization Yunang Chen Wolong Yuan Outline


- Slides: 17

Data Movement Visualization Yunang Chen, Wolong Yuan

Outline ● ● ● Background Overview Tracking API Visualization Test & Demo

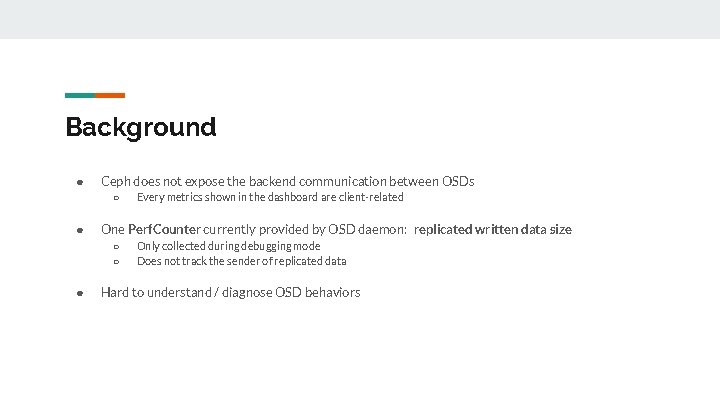
Background ● Ceph does not expose the backend communication between OSDs ○ ● One Perf. Counter currently provided by OSD daemon: replicated written data size ○ ○ ● Every metrics shown in the dashboard are client-related Only collected during debugging mode Does not track the sender of replicated data Hard to understand / diagnose OSD behaviors

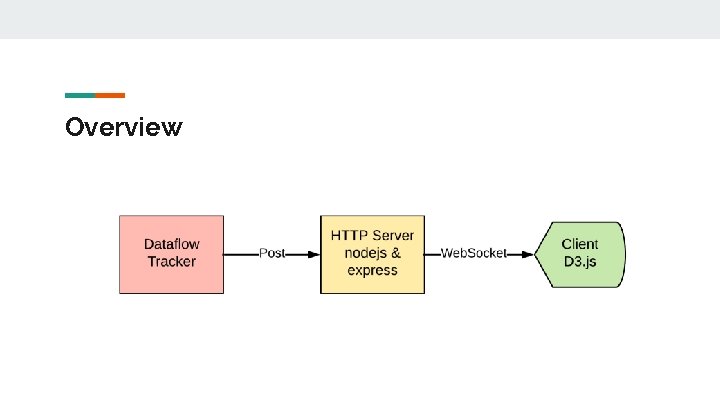
Overview

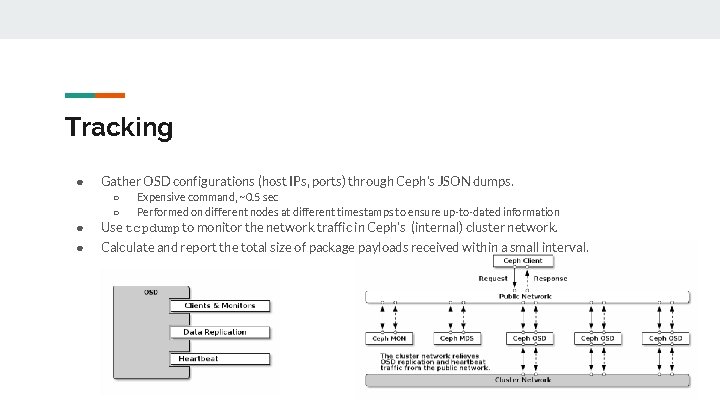
Tracking ● Gather OSD configurations (host IPs, ports) through Ceph’s JSON dumps. ○ ○ Expensive command, ~0. 5 sec Performed on different nodes at different timestamps to ensure up-to-dated information ● Use tcpdump to monitor the network traffic in Ceph’s (internal) cluster network. ● Calculate and report the total size of package payloads received within a small interval.

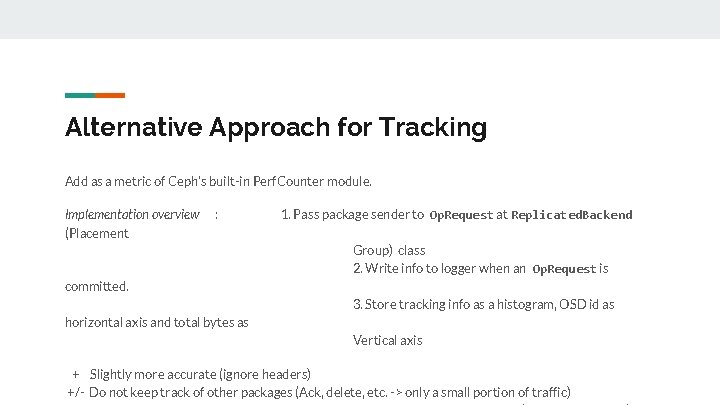
Alternative Approach for Tracking Add as a metric of Ceph’s built-in Perf. Counter module. Implementation overview (Placement : 1. Pass package sender to Op. Request at Replicated. Backend Group) class 2. Write info to logger when an Op. Request is committed. 3. Store tracking info as a histogram, OSD id as horizontal axis and total bytes as Vertical axis + Slightly more accurate (ignore headers) +/- Do not keep track of other packages (Ack, delete, etc. -> only a small portion of traffic)

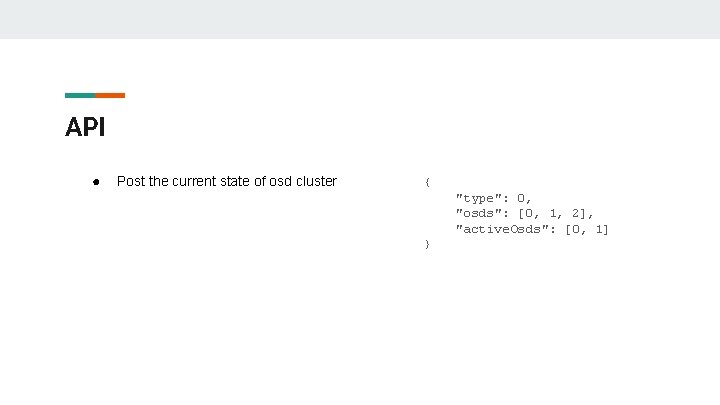
API ● Post the current state of osd cluster { "type": 0, "osds": [0, 1, 2], "active. Osds": [0, 1] }

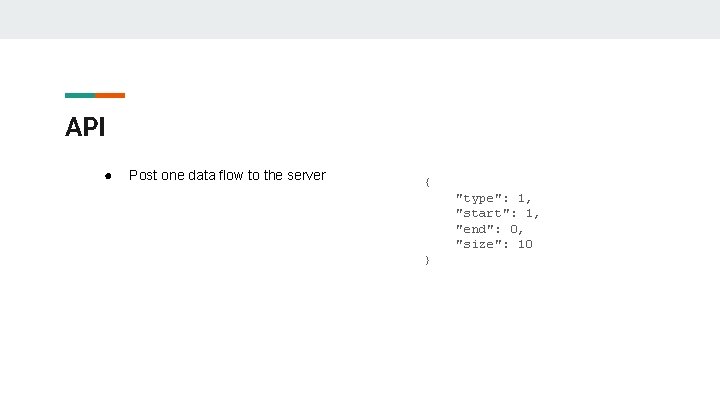
API ● Post one data flow to the server { "type": 1, "start": 1, "end": 0, "size": 10 }

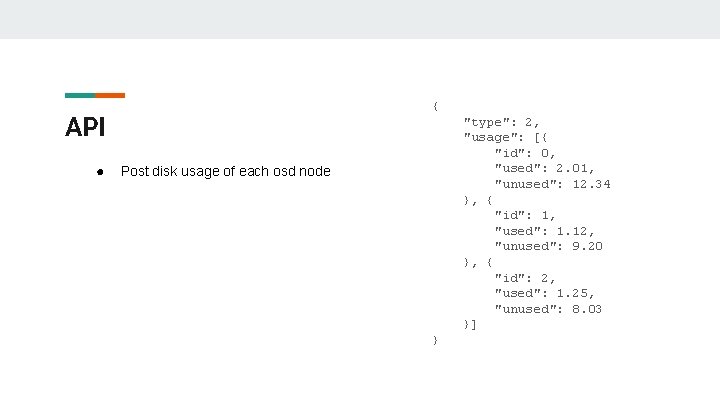
{ API ● "type": 2, "usage": [{ "id": 0, "used": 2. 01, "unused": 12. 34 }, { "id": 1, "used": 1. 12, "unused": 9. 20 }, { "id": 2, "used": 1. 25, "unused": 8. 03 }] Post disk usage of each osd node }

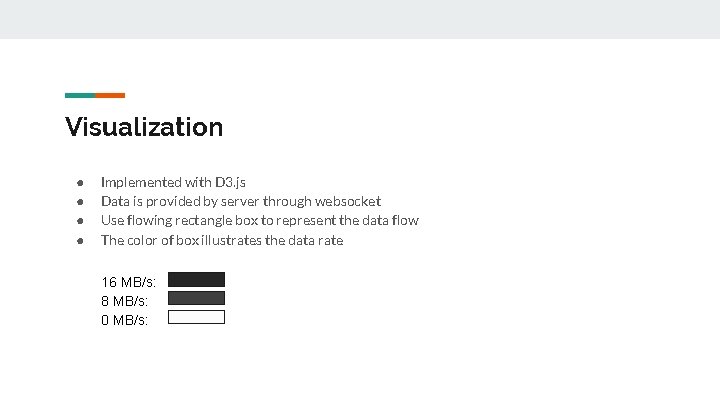
Visualization ● ● Implemented with D 3. js Data is provided by server through websocket Use flowing rectangle box to represent the data flow The color of box illustrates the data rate 16 MB/s: 8 MB/s: 0 MB/s:

Test & Demo ● ● ● General benchmark Add a new OSD node Change primary affinity Change replication OSD out & in

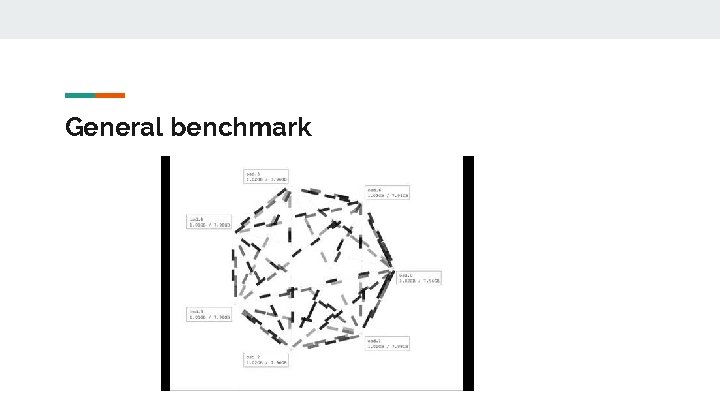
General benchmark

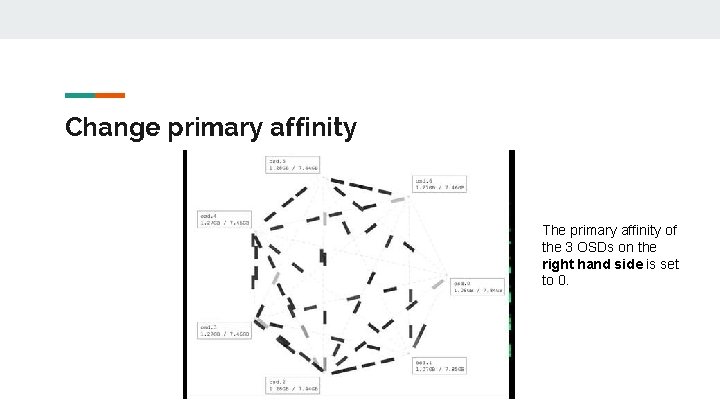
Change primary affinity The primary affinity of the 3 OSDs on the right hand side is set to 0.

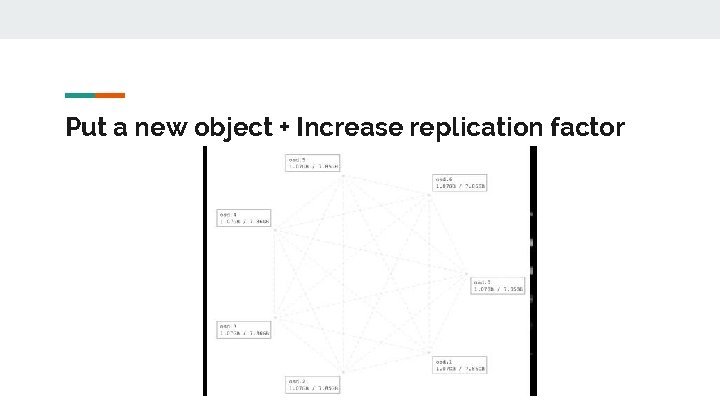
Put a new object + Increase replication factor

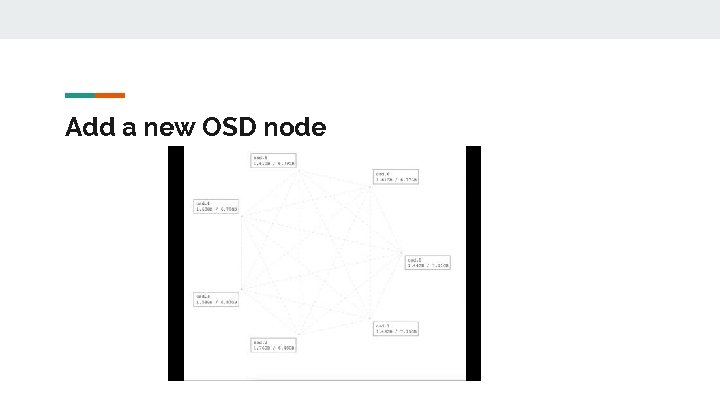
Add a new OSD node

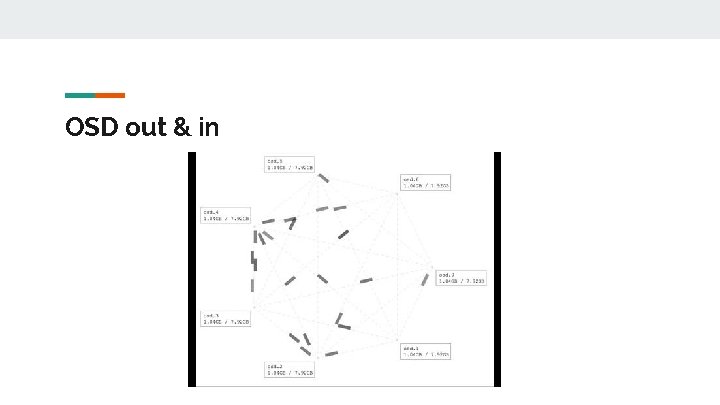
OSD out & in

Q&A