DATA MINING THE EM ALGORITHM Maximum Likelihood Estimation


 •")
 •")
 • Sample Mean Sample Variance")


 Algorithm • Fraction of population in G, C")

- Slides: 21
DATA MINING THE EM ALGORITHM Maximum Likelihood Estimation
MIXTURE MODELS AND THE EM ALGORITHM
Model-based clustering • In order to understand our data, we will assume that there is a generative process (a model) that creates/describes the data, and we will try to find the model that best fits the data. • Models of different complexity can be defined, but we will assume that our model is a distribution from which data points are sampled • Example: the data is the height of all people in Greece • In most cases, a single distribution is not good enough to describe all data points: different parts of the data follow a different distribution • Example: the data is the height of all people in Greece and China • We need a mixture model • Different distributions correspond to different clusters in the data.
Gaussian Distribution •
Gaussian Model •
Fitting the model •
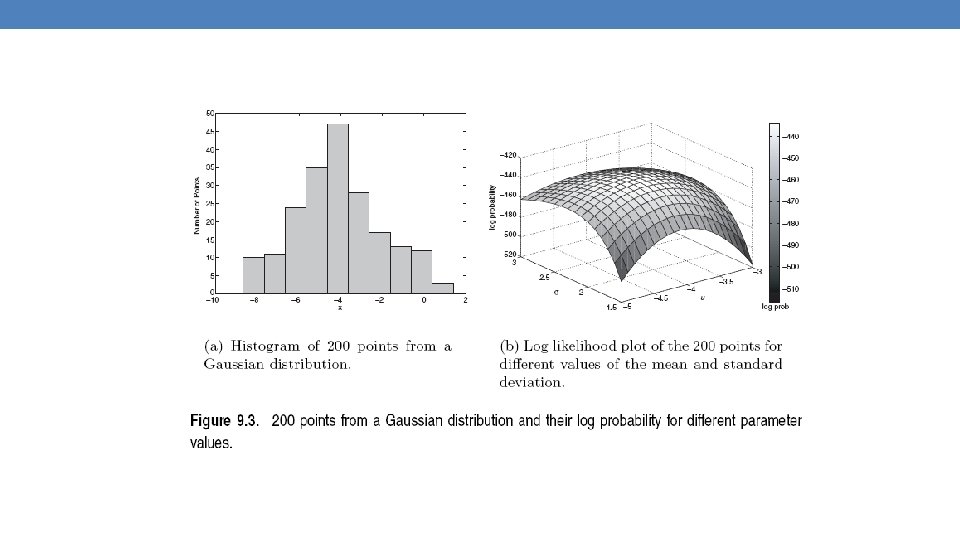
Maximum Likelihood Estimation (MLE) •
Maximum Likelihood Estimation (MLE) •
Maximum Likelihood Estimation (MLE) • Sample Mean Sample Variance
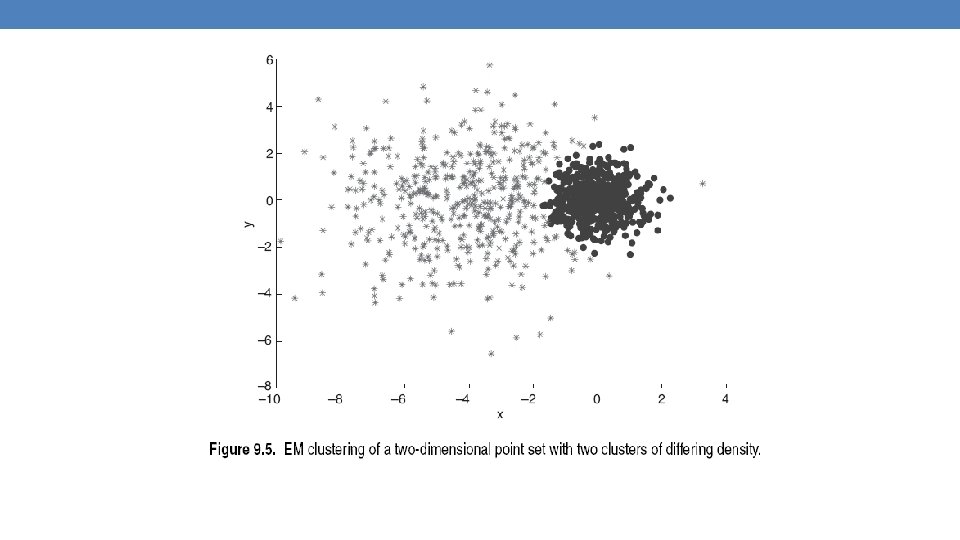
Mixture of Gaussians • Suppose that you have the heights of people from Greece and China and the distribution looks like the figure below (dramatization)
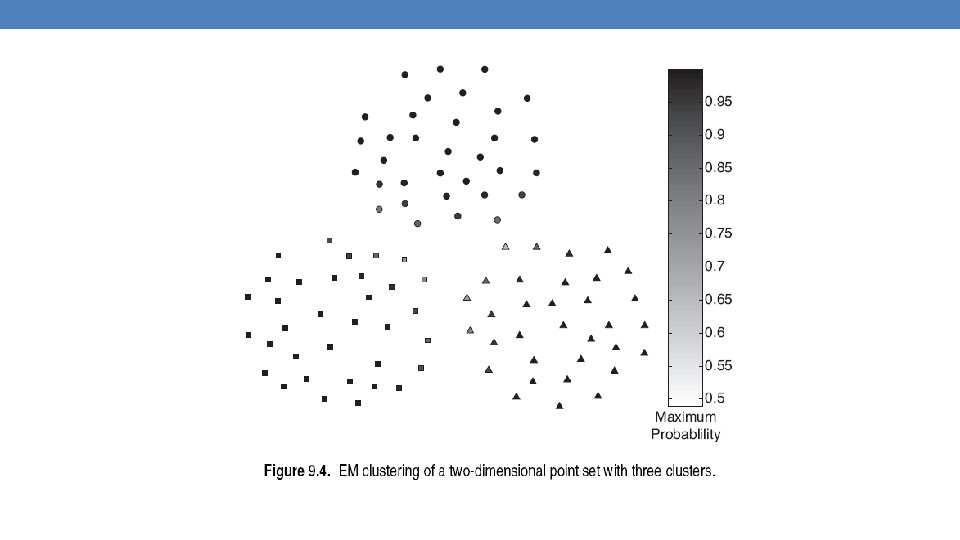
Mixture of Gaussians • In this case the data is the result of the mixture of two Gaussians • One for Greek people, and one for Chinese people • Identifying for each value which Gaussian is most likely to have generated it will give us a clustering.
Mixture model • We can also think of this as a Hidden Variable Z that takes two values: Greece and China
Mixture Model • Mixture probabilities
Mixture Model • Mixture probabilities Distribution Parameters
Mixture Models •
EM (Expectation Maximization) Algorithm • Fraction of population in G, C
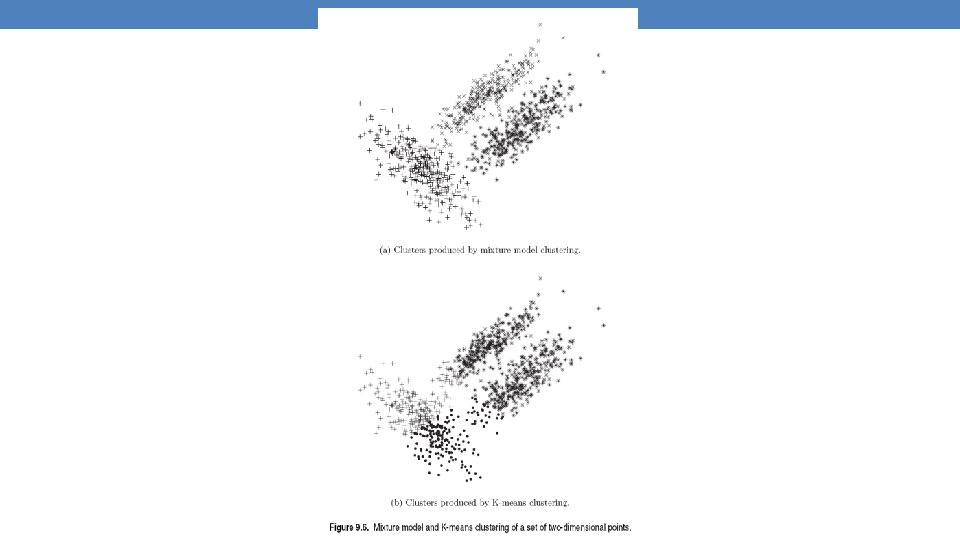
Relationship to K-means • E-Step: Assignment of points to clusters • K-means: hard assignment, EM: soft assignment • M-Step: Computation of centroids • K-means assumes common fixed variance (spherical clusters) • EM: can change the variance for different clusters or different dimensions (ellipsoid clusters) • If the variance is fixed then both minimize the same error function