Data Mining Mining Frequent Patterns Associations and Correlations


ﺍﺯ ﺩﺭﺧﺖ Item ﺭﺧﺪﺍﺩ پﻴﺸﻮﻧﺪﻫﺎ ﺑﺎ ﻣﺮﺍﺟﻌﻪ ﺑﻪ ﺟﺪﻭﻝ Conditional")
 Transaction _ Id List of Item_Ids T 100 I 2,")
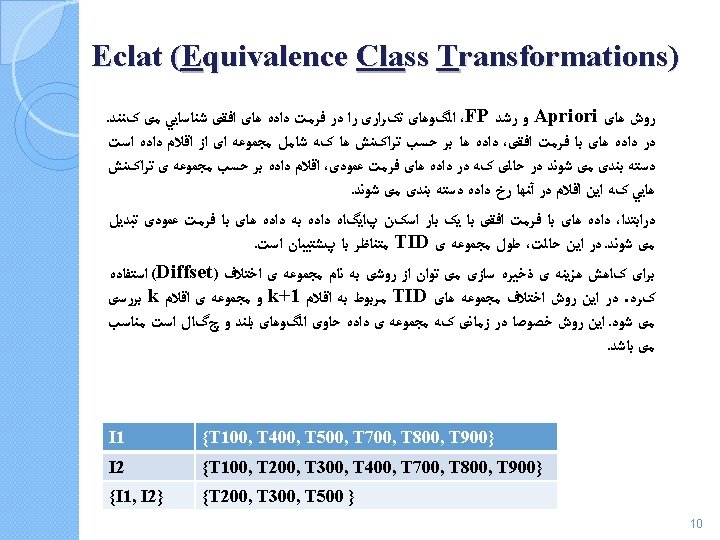
 Itemset TID_Set {I 1, I 2} {T 100, T 400,")


- Slides: 20
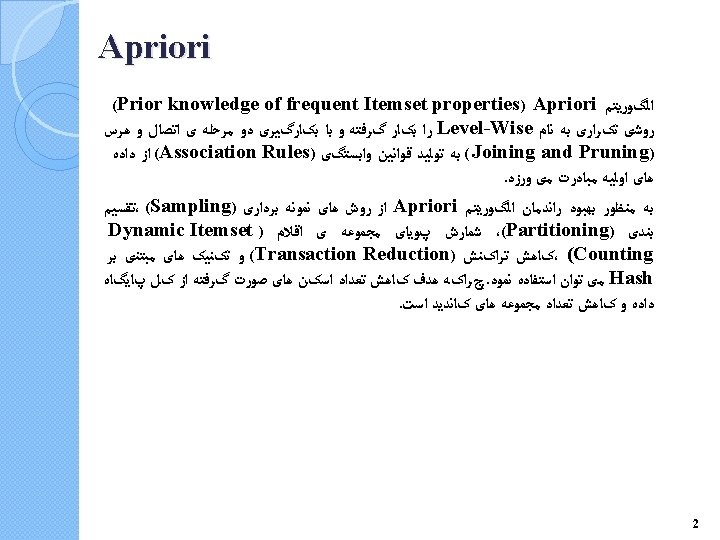
Data Mining, Mining Frequent Patterns, Associations and Correlations ﺩکﺘﺮ ﻓﺎﻃﻤﻪ ﺍﺣﻤﺪی آﺒکﻨﺎﺭی 1
Apriori: Example C 1 List of Item_Ids T 100 I 2, I 1, I 5 T 200 I 2, I 4 T 300 I 2, I 3 T 400 I 2, I 1, I 4 T 500 I 1, I 3 T 600 I 2, I 3 T 700 I 1, I 3 T 800 I 2, I 1, I 3, I 5 T 900 I 2, I 1, I 3 Minimum Support count: 2 Compare with minimum support count Transaction _ Id Itemset Sup. Count {I 1} 6 {I 2} 7 {I 3} 6 {I 4} 2 {I 5} 2 L 1 Itemset Sup. Count {I 1} 6 {I 2} 7 {I 3} 6 {I 4} 2 {I 5} 2 3
Apriori: Example Itemset Sup. Count {I 1, I 2} 4 {I 1, I 3} 4 {I 1, I 5} 2 2 {I 2, I 3} 4 {I 2, I 4} 2 {I 2, I 5} 2 {I 3, I 4} 0 {I 3, I 5} 1 {I 4, I 5} 0 Itemset Sup. Count {I 1, I 2} 4 {I 1, I 3} 4 {I 1, I 4} 1 {I 1, I 5} C 2 Compare with minimum support count L 2 {I 1, I 2, I 3}: {I 1, I 2}, {I 1, I 3}, {I 2, I 3}ε L 2 in C 3 {I 2, I 3, I 5}: {I 2, I 3}, {I 2, I 5}, {I 3, I 5} ε L 2 not in C 3 {I 1, I 2, I 3, I 5}: {I 1, I 2, I 3}, {I 1, I 2, I 5}, {I 2, I 3, I 5} ε L 3 not in C 4 Finish Itemset Sup. Count {I 1, I 2, I 3} 2 {I 1, I 2, I 5} 2 C 3 Compare with minimum support count Itemset Sup. Count {I 1, I 2, I 3} 2 {I 1, I 2, I 5} 2 L 3 4
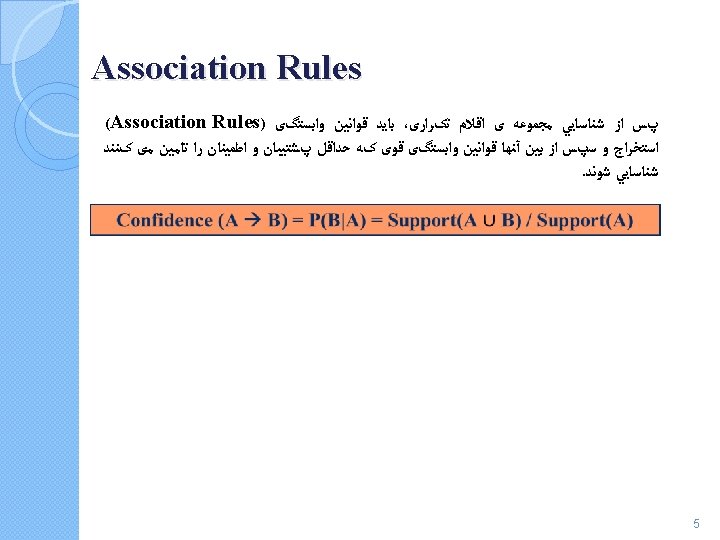
Association Rules 1: 2: 3: 4: 5: 6: {I 1, I 2} {I 5} Confidence: 2/4 = 50% {I 1, I 5} {I 2} Confidence : 2/2 = 100% {I 2, I 5} {I 1} Confidence : 2/2 = 100% {I 1} {I 2, I 5} Confidence : 2/6 = 33% {I 2} {I 1, I 5} Confidence : 2/7 = 29% {I 5} {I 1, I 2} Confidence : 2/2 = 100% Minimum Confidence Threshold: 70% Strong Association Rules 2: {I 1, I 5} {I 2} Confidence : 2/2 = 100% 3: {I 2, I 5} {I 1} Confidence : 2/2 = 100% 6: {I 5} {I 1, I 2} Confidence : 2/2 = 100% Unlike conventional classification rules, Association rules can contain more than one conjunction at the right-hand side of the rule. 6
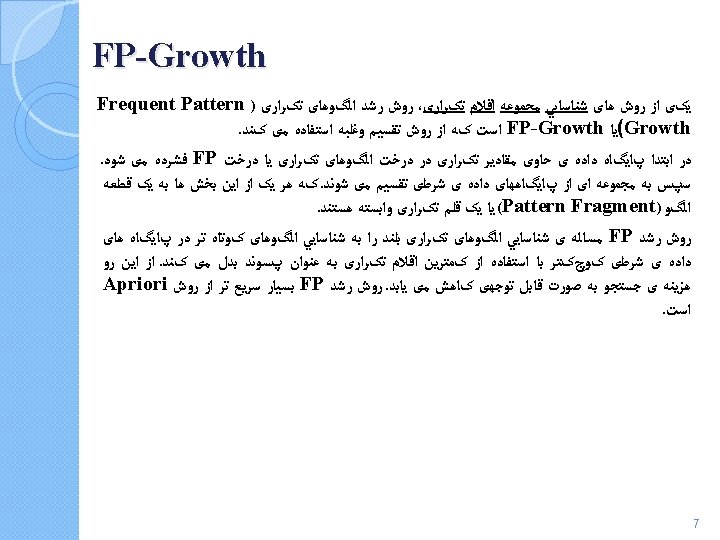
FP-Growth Transaction _ Id List of Item_Ids T 100 I 2, I 1, I 5 T 200 I 2, I 4 T 300 I 2, I 3 T 400 I 2, I 1, I 4 T 500 I 1, I 3 T 600 I 2, I 3 T 700 I 1, I 3 T 800 I 2, I 1, I 3, I 5 T 900 I 2, I 1, I 3 {} I 2: 7 I 1: 4 I 5: 1 I 1: 2 I 3: 2 I 4: 1 I 5: 1 8
FP-Growth ﻣﺴﻴﺮﻫﺎی پﻴﺸﻮﻧﺪی ( )ﺍﺯ ﺩﺭﺧﺖ Item ﺭﺧﺪﺍﺩ پﻴﺸﻮﻧﺪﻫﺎ ﺑﺎ ﻣﺮﺍﺟﻌﻪ ﺑﻪ ﺟﺪﻭﻝ Conditional Pattern Conditional FP-Tree Base ﺍﻟگﻮﻫﺎی ﺗﻮﻟﻴﺪ ﺷﺪﻩ ﺑﺎ ﺍﺳﺘﻔﺎﺩﻩ ﺍﺯ ﺳﺘﻮﻥ ﻣﺠﺎﻭﺭ Frequent Pattern Generated I 5 {{I 2, I 1: 1}, {I 2, I 1, I 3: 1}} {I 2: 2, I 1: 2} {I 2, I 5: 2}, {I 1, I 5: 2}, {I 2, I 1, I 5: 2} I 4 {{I 2, I 1: 1}, {I 2: 1}} {I 2: 2} {I 2, I 4: 2} I 3 {{I 2, I 1: 1}, {I 2: 2}, {I 1: 2}} {I 2: 4}, {I 1: 2}, {I 2, I 1: 2} {I 2, I 3: 4}, {I 1, I 3: 4}, {I 2, I 1, I 3: 2} I 1 {{I 2: 2}} {I 2: 4} {I 2, I 1: 4} Mining the FP-tree by creating conditional (sub-) pattern bases 9
Eclat (Equivalence Class Transform) Transaction _ Id List of Item_Ids T 100 I 2, I 1, I 5 T 200 I 2, I 4 T 300 I 2, I 3 T 400 I 2, I 1, I 4 T 500 I 1, I 3 T 600 I 2, I 3 T 700 I 1, I 3 Itemset TID_Set T 800 I 2, I 1, I 3, I 5 I 1 {T 100, T 400, T 500, T 700, T 800, T 900} T 900 I 2, I 1, I 3 I 2 {T 100, T 200, T 300, T 400, T 600, T 800, T 900} I 3 {T 300, T 500, T 600, T 700, T 800, T 900} I 4 {T 200, T 400} I 5 {T 100, T 800} 1 11
Eclat (Equivalence Class Transform) Itemset TID_Set {I 1, I 2} {T 100, T 400, T 800, T 900} {I 1, I 3} {T 500, T 700, T 800, T 900} {I 1, I 4} {T 400} {I 1, I 5} {T 100, T 800} {I 2, I 3} {T 300, T 600, T 800, T 900} {I 2, I 4} {T 200, T 400} {I 2, I 5} {T 100, T 800} {I 3, I 4} {} {I 3, I 5} {T 800} {I 4, I 5} {} Itemset TID_Set {I 1, I 2, I 3} {T 800, T 900} {I 1, I 2, I 5} {T 100, T 800} 2: The 2 -itemsets Minimum Support count: 2 3: The 3 -itemsetd 12
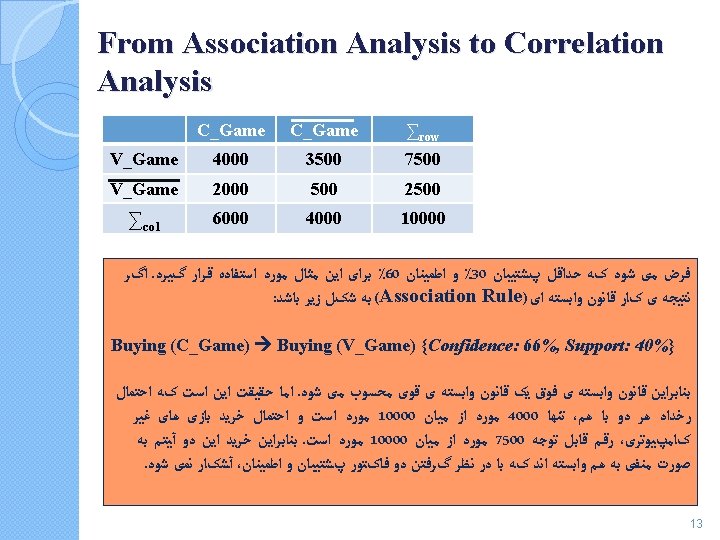
Correlation Analysis using Lift A B {Support, Confidence, Correlation} C_Game ∑row V_Game 4000 3500 7500 V_Game 2000 500 2500 ∑col 6000 4000 10000 Contingency Table (Confidence (A B) / Support (B)) = P(B|A) / P(B) Because the result of Lift is less than one, so there is a negative correlation between the occurrence of C_Game and V_Game which could not be discovered with Support and Confidence values. 14
Correlation Analysis using χ2 C_Game ∑row V_Game 4000 3500 7500 V_Game 2000 500 2500 ∑col 6000 4000 10000 C_Game ∑row V_Game 4000 (4500) 3500 (3000) 7500 V_Game 2000 (1500) 500 (1000) 2500 ∑col 6000 4000 10000 Contingency Table 15
Other Correlation Measures 1 2 3 or Harmonized Lift 4 The results of All measures is between zero and one. If it is close to one, A and B are positively correlated and if the result id less than 0. 5 they are negatively correlated. 16
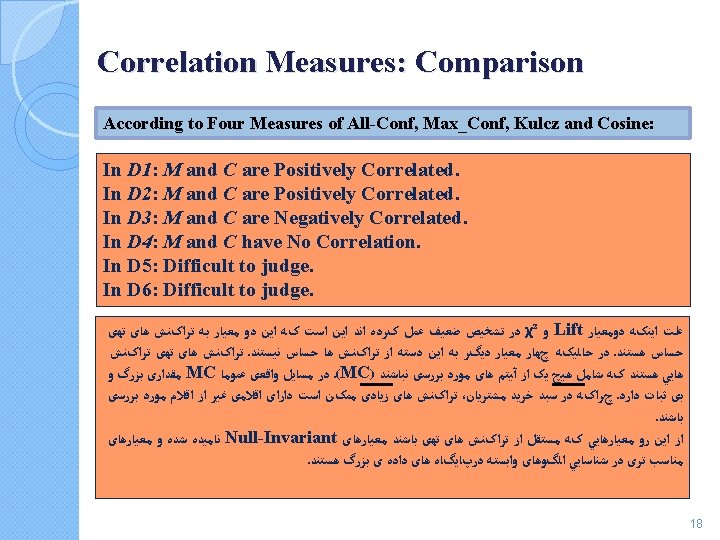
Correlation Measures: Comparison Milk ∑row Coffee MC MC C ∑col M M ∑ D MC MC χ2 Lift All. Conf Max_ Kulcz Conf Cosine D 1 10000 100000 90557 9. 26 0. 91 D 2 10000 1000 100 0 1 0. 91 D 3 100000 670 8. 44 0. 09 D 4 100000 24740 25. 75 0. 5 D 5 10000 100000 8173 9. 18 0. 09 0. 91 0. 5 0. 29 D 6 1000 10 100000 965 1. 97 0. 01 0. 91 0. 5 0. 10 17
Correlation Measures: Comparison IR represent the imbalance between A and B Itemset in a way that the more the difference between A and B, the more their imbalance ratio. Usage of Imbalance Ratio (IR) and Kulczynski make better view of D 4 to D 6 Datasets. 19