Data Manipulation Introduction to Data Visualization The Graduate

 • Car Colors (black, white, red,")


 Correlation/Causation Traps PFishing through data without an")

- Slides: 19
Data Manipulation Introduction to Data Visualization The Graduate Center at CUNY Michelle A. Mc. Sweeney
Variable Types • Categorical • Nominal (descriptive words) • Car Colors (black, white, red, silver) • Language (Spanish, Chinese, Thai) • Dichotomous (2 options) • Yes/No answers (Complete/Incomplete) • Binary classifications (On/Off) • Age Group (over 65/under 65) • Booleans (TRUE / FALSE) • Ordinal (ranked) • Olympic Winners (1 st, 2 nd, 3 rd) • School Grades (elementary, middle, high) • Likert Scale (“on a scale of 1 to 5, how do you feel about: ”) • Numeric • Integers (whole numbers) • Floats (decimals) • Logarthmic
Data Categorical DIMENSIONS GREEN PILL Nominal Examples: Occupation, Nationality, Labels Numeric MEASURES BLUE PILL Ordinal Examples: Days of week, Place in race, Grades Dichotomous Discrete Continuous Examples: Yes/No On/Off 0/1 Examples: Children, Books read, Complaints Examples: Weight, Distance, (Time)
Data & Story Determine Viz Story Numeric Categorical Basic Viz Change over time Position on y axis Distinct lines Line/Area Chart Relationship between 2 -3 variables Position on x & y axes Distinct colors Scatter/Bubble Chart Parts of a Whole Angle Colors/Fill Pie chart Parts of a Whole Size Colors/Fill Area Chart/ Tree Maps Process Line width NA Flow chart Quantity Bar length Distinct bars Bar chart Events in time Position on line Events Timeline
Comparison Story Type Dictates Visualization Type Distribution Relationship Composition
www. labnol. org/ software/find-rightchart-type-for-yourdata/6523/
https: //github. com/ftinteractive/chartdoctor/blob/master/visualvocabulary/poster. png
Tools to help you pick annkemery. com/essentials datavizcatalogue. com
Context • Narrative around the data is as important as the data itself • Allows reader to participate in your visualization • Situates the reader so they know what to look for
Context 1236 exoplanets identified by the NASA’s Kepler mission. • Narrative around the data is as important as the data itself • Allows reader to participate in your visualization • Situates the reader so they know what to look for http: //blog. blprnt. com/blog/blprnt/data-in-an-aliencontext-kepler-visualization-source-code
• Data itself is an abstraction from reality through collection and aggregation. Mathematical Representations • It is useful because it allows us to see “the world” in broad strokes • But creating data from reality to make comparisons requires some mathematical transformations.
• Averages
Normalization • Adjusting data to a “common” scale • Divide by total for each unit • i. e. , Population reported as percentages is comparable, counts are not • Shifted and scaled for comparison (log, exponent) • Normal Distribution • Quantiles
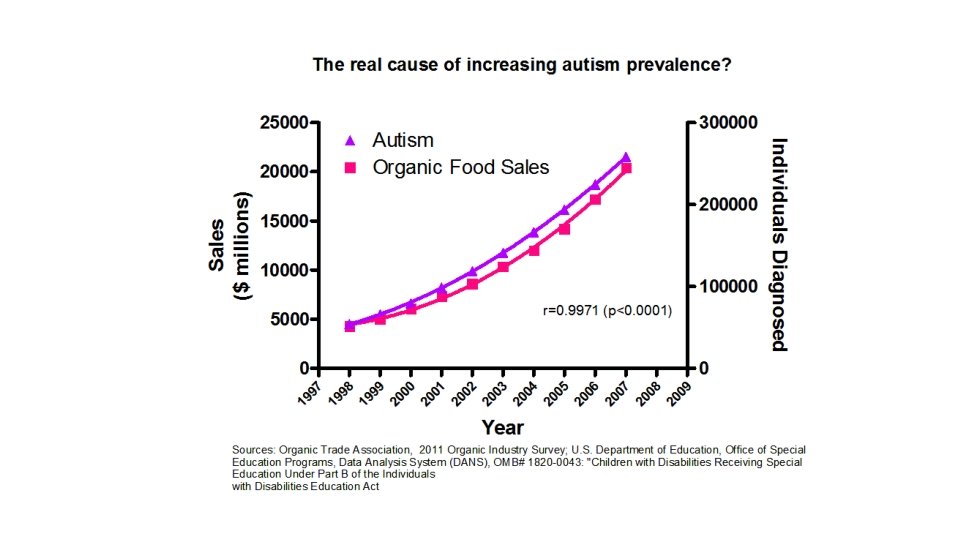
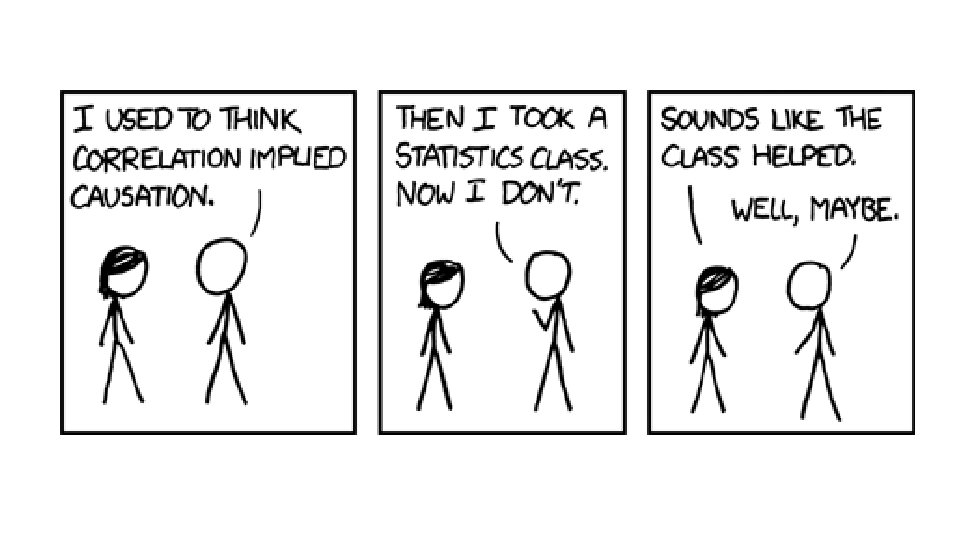
Correlation is not Causation
Correlation: • two variables change at the same rate Correlation/Causation: • One causes the other • Both are caused by an outside variable
Proxies (particularly with social Proxies Using phenomena) Correlation/Causation Traps PFishing through data without an hacking experiment or rational justification Bias Allowing pre-existing biases to guide outcome
Ways to Avoid Causation from Correlation SITUATE VISUALIZATIONS IN CONTEXT THINK ABOUT CLAIMS FROM BOTH DIRECTIONS SUPPORT CLAIMS WITH ARTICLES AND RESEARCH