Data Management Techniques How to Scrub Your Data

Data Management Techniques: How to Scrub Your Data Andrea D. Hart Catherine Callow-Heusser

Quality Assurance: The Overlooked and Underused Part of Data Management Ø Plan carefully prior to starting data collection. Ø Careful planning will reduce later data problems and cost increases. Ø Plan with data analysis in mind!

Quality Assurance Field Edits Directly after an interview, the interviewer should scan for missing data points, illogical skip patterns, quantitative items that need more complete answers, observational items, or any item that needs clarification from a supervisor. Field edits should be made in a different color (green pencil) to denote the field edit as separate from the data collection time point.
 Whether one uses paper instruments or direct computer entry,")
Quality Assurance Quality Control (QC) Whether one uses paper instruments or direct computer entry, there should be a second pair of eyes checking the data before data entry. This quality control person should be fully trained on the interviewing procedures and the data entry rules. Any edits made by the QC person should be done in a consistent color (red pen). Erasures should not be made beyond the interview, so a history of decisions is documented.

Quality Control • Communication should be clear between researcher, supervisor, interviewer, and quality control personnel to maintain consistent data collection rules and interpretations. • When the quality control person gives feedback to the interviewer regarding problems with the interview or needed clarification, this corrects similar errors in the future and prevents interviewer drift.

Double Data Entry • Entering data twice and then comparing the two data files for differences has been a standard practice for researchers for many years. • For example, datafile 1 should have the exact information as datafile 2. So var 1 from datafile 1 subtracted from var 1 from datafile 2 should equal zero. Simple code can check when they are anything but zero. Then either a scanned or hard copy of the original interview is checked to resolve the difference. Often, at this point, data entry rules are established that deal with ambiguous data points.

Double Data Entry PROS: • Leaves a “paper trail” for checking data errors • Low tech, no specialized software needed • Allows another quality control check on data points (reading clarifying comments written in margins of questionnaire) CONS: • Time consuming • Labor intensive

Scanning Data Software programs are available that scan interview forms and read data (generally filled in dots) based on a programmed template. These programs can assign variable and value labels and provide data files for use in SAS and SPSS. Pros: • Faster (depending on the design of the interview form and the ease of making a template), thereby reducing data entry budgets • Facilitates archiving hard copies as digital media (searchable by id’s) reducing storage space and tedious filing

Scanning Data Cons: • With few exceptions, generally requires expensive equipment and software. Additionally, may require higher levels of expertise from data entry personnel. • Must redo forms not designed with a scanning template in mind to allow for “dots” to be filled. • Forms that have “dots” to fill in are not user friendly to a variety of populations. • Does not allow for double data entry and the reliability of accurate entry varies across scanning programs and across the user’s ability to fill in the “dots”.

Direct Data Entry Direct data entry allows participants or interviewers to directly enter data into a computer via interactive screens. Pros: • Circumvents error introduced by multiple data handling steps • Requires little or no additional data entry personnel • Eliminates out-of-range values and skip pattern errors Cons: • Generally, no “paper trail” to check data errors or recreate corrupt data • Requires fairly sophisticated programming to create a foolproof data entry interface • Computer equipment is needed

Range Checks Queries or frequencies for values that are not possible or highly unlikely should be run. For example, a yearly income of $50, 000 is not impossible, but highly unlikely for a teen mother who qualifies for Early Head Start. Skip Patterns Queries should be run for values that are illogical. For example, if there is an item that says, “no, I’ve never drunk alcohol” on a screen for alcohol use, then there should be no data for the section on alcohol use.

Naming Protocols • In a longitudinal study, large amounts of data will be collected. Some of this data will be collected across several time points. It is crucial to have consistent, easy to decipher file names, variable names, and variable labels. • It’s an art to devise variable names for large data sets that can be “decoded” and fit into only 8 characters (if using SPSS for data analysis).

Variable Naming Protocols One strategy is to divide the variable name into 3 parts: a prefix, a stem, and a suffix. Prefix: 2 or 3 characters denoting the timepoint the data was gathered and from whom it was asked or how it was gathered. • • M 1 = Time 1, asked of the mother F 2 = Time 2, asked of the father C 3 = Time 3, asked of the childcare provider V 1 = Time 1, video-coded data

Variable Naming Protocols Stem: After the prefix, the next set of characters should denote the construct being measured. • V 1 intr = time 1, video-coded, parent intrusiveness • M 3 dep = time 3, mother data, depression

Variable Naming Protocols Suffix: The suffix can be used for scales with item numbers or summary scores. • M 3 dep 01 = time 3, mother data, construct depression, item number 1 • M 3 deptot = time 3, mother data, construct depression, total summary score • M 3 depsu = time 3, mother data, construct depression, suicide subscale score

Calculate Summary Scores or Reliability Checks • The computer should be used to calculate summary scores, reliability scores, or check hand-calculated summary scores. This allows missing data to be treated consistently with rules. • For example, a researcher may want to assign a missing value to any summary score that is missing more than 25% of the individual items.

Reports • Databases like MS Access can be used to produce any useful collection of data that is supported by the database. • These reports can be used for management of data collection, particularly when data collection time points during a longitudinal study overlap. E. g. , weekly reports of subjects who are within the window of data collection for times 1 and 2. • They can also be used to produce data codebooks, lists of variable name prefixes, stems, suffixes, database rules, etc.

Have all the data been entered into appropriate data tables? • Matching tracking data (completion codes of various stages of data collection) with data entry tables ensures all data that was collected is entered. This allows cleanup of inconsistent data OR tracking information. All data should tell the same story. • If the tracking information states that Alice completed all protocols for timepoint 1 but is missing the video portion of timepoint 2, then the data tables should also reflect this pattern.

“Business Rules” • Business rules are database management rules used to reduce the proliferation of database “junk. ” • When multiple people use a database and are designing tables and queries, it becomes necessary to have rules to live by so that the database is transparent to those who use it.

“Business Rules” These rules may include: • Naming protocols for permanent queries, tables, reports, or syntax. • Articulating cleanup procedures like automatic deletion of non-permanent queries, data tables, or syntax after a designated amount of time. • Designating personal databases or folders for individual use. • Keeping a computer file for logging data errors or changes. • Maintaining strict control over your computer directory structure—helps eliminate clutter and confusion. • Automating a backup schedule.

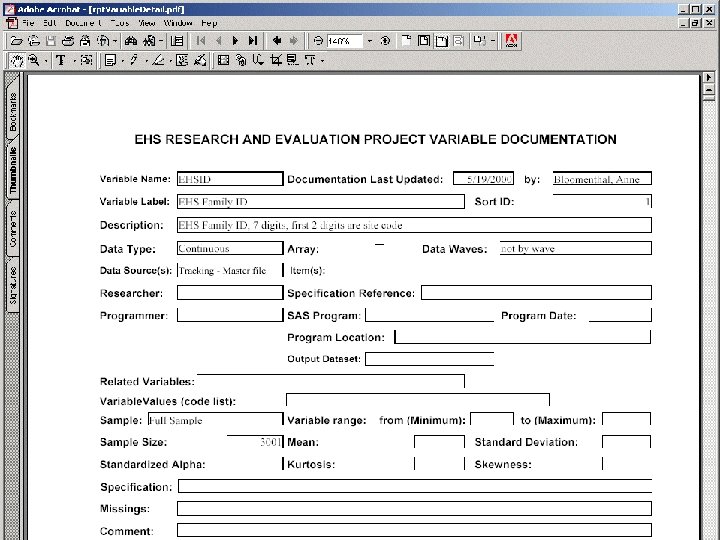
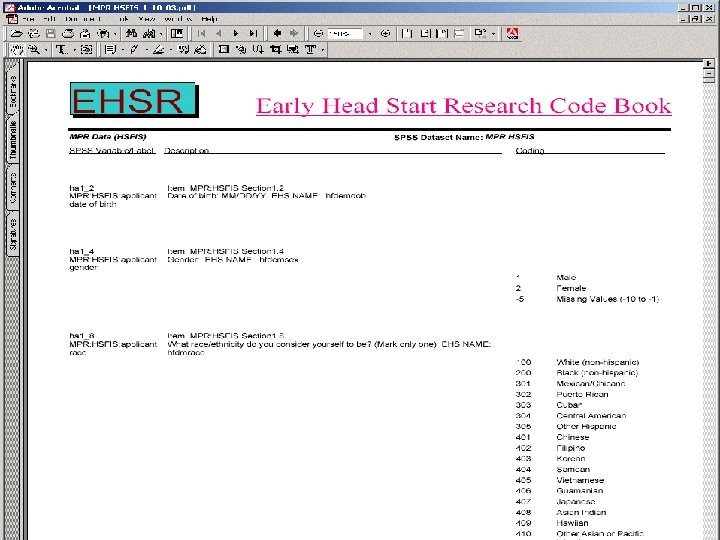
Data Codebooks • A database like MS Access can store ANY type of data. Thus you can integrate making a codebook as part of the data collection/entry process. • These types of data can include your variable labels, value labels, questionnaires, or appendices. • In preparing a longitudinal dataset, it is important to maintain consistent coding schemes across time. MS Access can be used to maintain definitions of coding schemes. yes/no in EVERY DATASET coded no = 0, yes = 1.

Two Examples of Codebooks Produced by MS Access • Differing amounts of information on each screen • Ease of readability

Summary • Your research credibility depends on sound data management techniques. • Proper data cleaning ALWAYS takes longer and requires more investment than you think it will. • Clear advance planning of data tracking, variable naming, business rules, and writing data codebooks will be invaluable for a dataset that is logical, consistent, and easy to use. • Always respect your data subjects and remember to build in data procedures that maintain their right to privacy.

Contact Information Andrea D. Hart. Andrea. D@uams. edu Catherine Callow-Heusser cheusser@cc. usu. edu University of Arkansas for Medical Sciences Partners for Inclusive Communities 2001 Pershing Circle, Suite 300 North Little Rock, AR 72114 NSF MSP/RETA Evaluation Capacity Building Project 2810 Old Main Hill Utah State University Logan, UT 84322 -2810 501 -682 -9918 FAX 501 -682 -9991 435 -797 -1111 FAX 435 -797 -1448
- Slides: 26