Data Liberation Training 2000 Weights and Measures University

Data Liberation Training 2000 Weights and Measures University of Guelph Wendy Watkins March 31, 2000 31 March, 2000 Wendy Watkins

Concepts, Definitions and Tasks u Levels of Measurement u Categorical Variables u Nominal u Ordinal u Continuous Variables u Interval u Common SPSS Procedures (and when to use them) u Weighting the Data u Population Weights u Working Weights u Exercises Using SPSS

Levels of Measurement u. Categorical Variables u. Numbers Denote Categories u. Have No Intrinsic Meaning u. Nominal u. Are unordered u. Ordinal u. Have an order

Categorical Variables u Nominal Variables u Numbers stand for names u Can’t order them u eg. Gender u 1=Female u 2=Male u Can’t use arithmetic to add, etc.

Categorical Variables u Ordinal Variables u Numbers can be ordered u Spaces between numbers can’t be measured u eg. How well do you like Harris? u 1=Not at all u 2=Less still u 3=Even less than that u Can’t use arithmetic to add, etc.

Continuous Variables u Interval Variables u Numbers stand for what they are u Spaces between numbers are equal u eg. How many children do you have? u Can use arithmetic u eg. What is the average number of children in a family?

Levels of Information u Interval Variables = most information u Ordinal Variables = less information u Nominal Variables = least information
 u Univariate Measures (1 variable) u")
Common SPSS Procedures (and when to use them) u Univariate Measures (1 variable) u Frequencies u Descriptives u Bivariate Measures (2 variables) u Crosstabs u Means u Correlations u Multivariate Measures (> 2 variables) u we’re not going there!

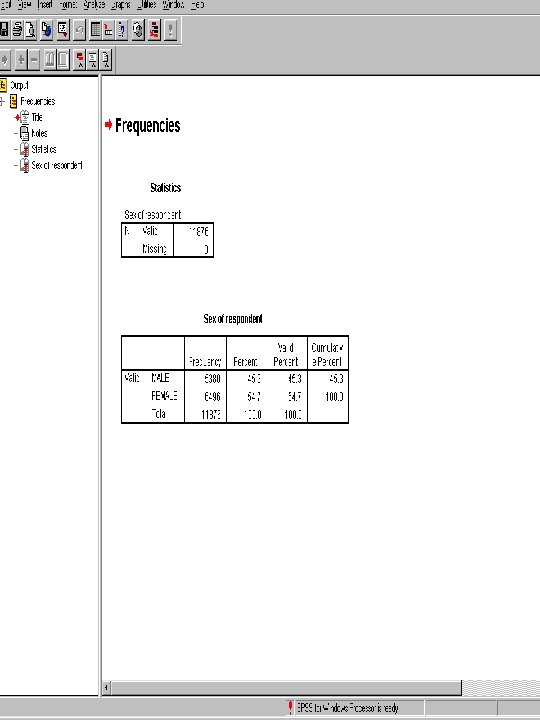
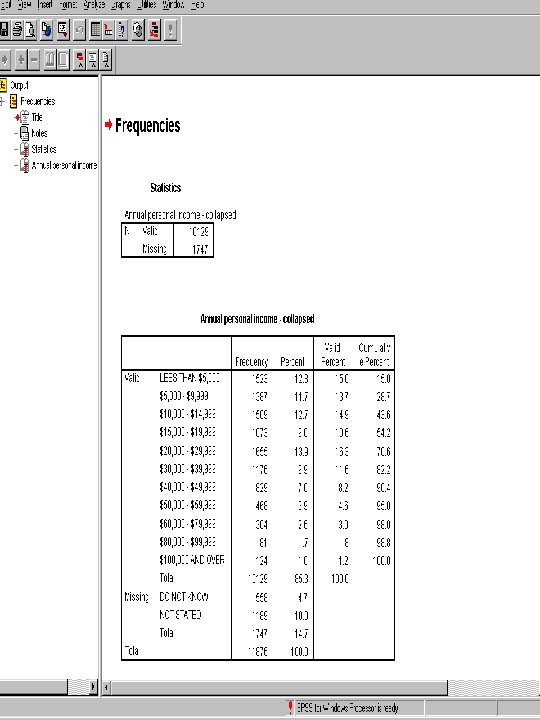
Univariate Procedures u Frequencies u How many times does ‘x’ happen? u Use with nominal and ordinal measures u eg. How many males are in the dataset? u Eg. How many people are in each income group?

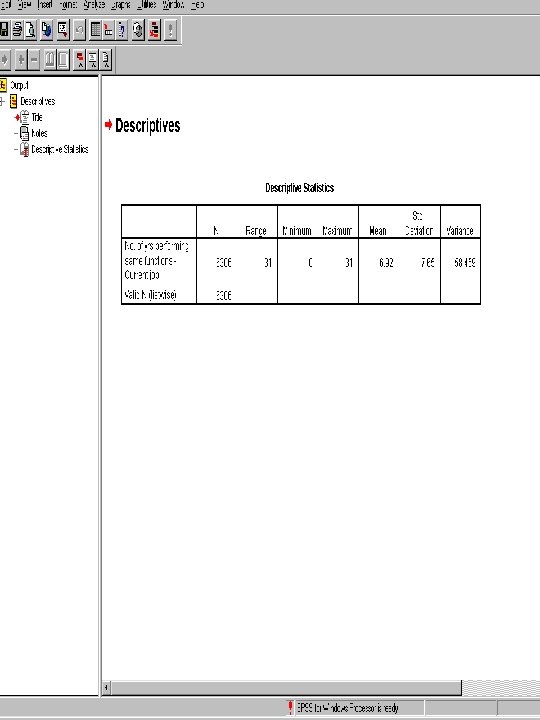
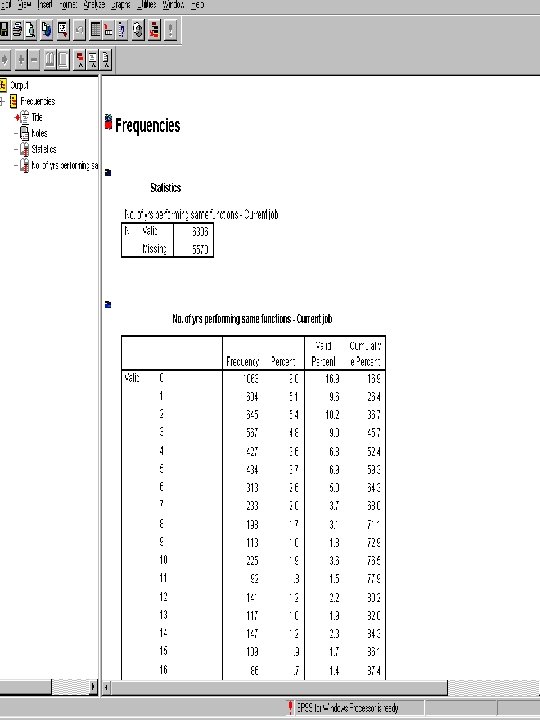
Univariate Procedures u Descriptives u Describes the distribution u Use with interval measures u eg. What is the average number of years people have been working at their current job?

Why not use frequencies? u Output is not as meaningful u Often paper wastes reams of

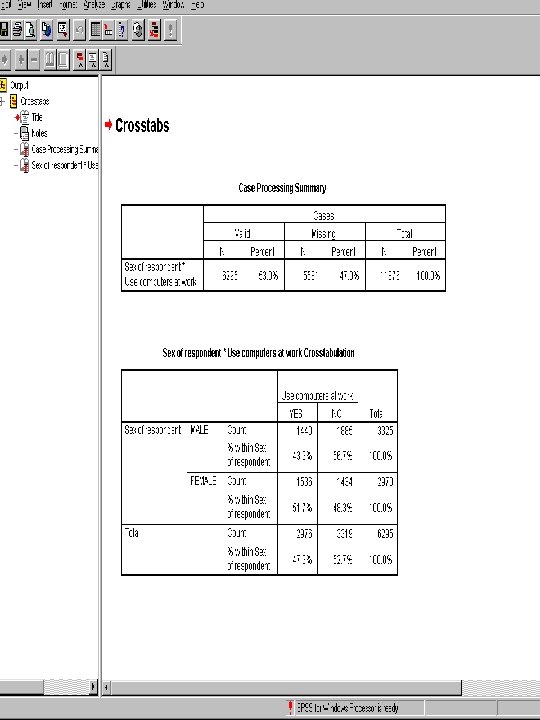
Bivariate Procedures u Crosstabs u How does ‘x’ relate to ‘y’? u Use with nominal and ordinal measures u eg. Are men or women more likely to use computers at work?
 between groups u Use when")
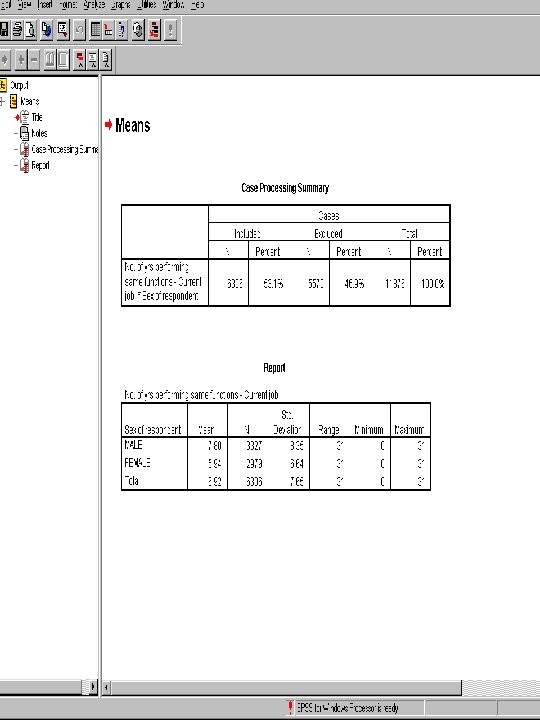
Bivariate Procedures u Means u Compares the average (mean) between groups u Use when one variable is interval and the other is ordinal or nominal u eg. Who has worked longer at their job, men or women?

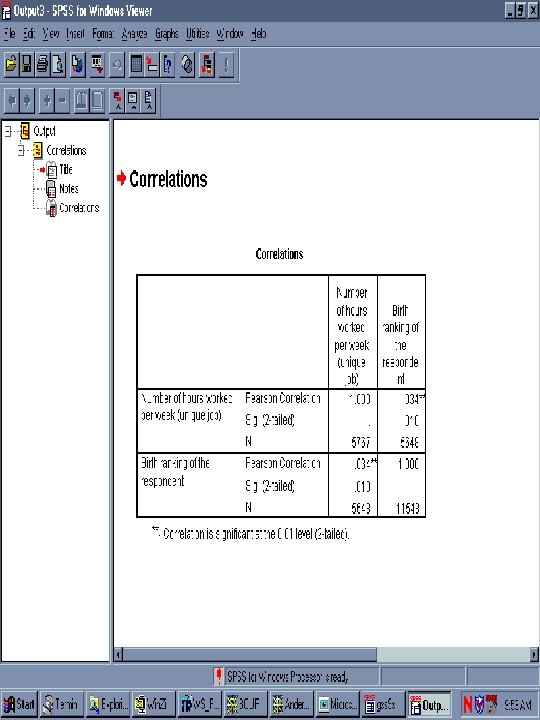
Bivariate Procedures u Correlation u Shows the degree to which two variables are related u Ranges from: -1 = perfect negative correlation 0 = no relationship +1= perfect positive correlation u Use when both variables are interval u eg. Is birth order related to hard work?

Weighting the Data u All of the prior examples used unweighted data!! I wonder if this will be a problem? ?

Weighting Terms u Population weight u Inflates the number of people in the sample up to the number of people in the population u Working weight u Population weight/mean weight u Does not inflate the sample u Needed for hypothesis testing

Why Are Weights Used? u Data are often collected in a disproportionate manner u eg. A greater percentage of the population are interviewed in PEI than in Ontario u Weighting adjusts for this bias u Each weighted observation represents one observation in the population u Not using weights may result in incorrect analyses

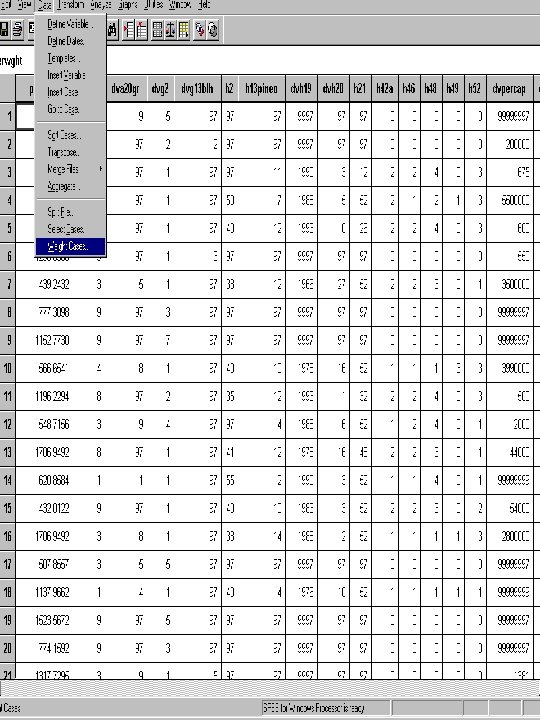
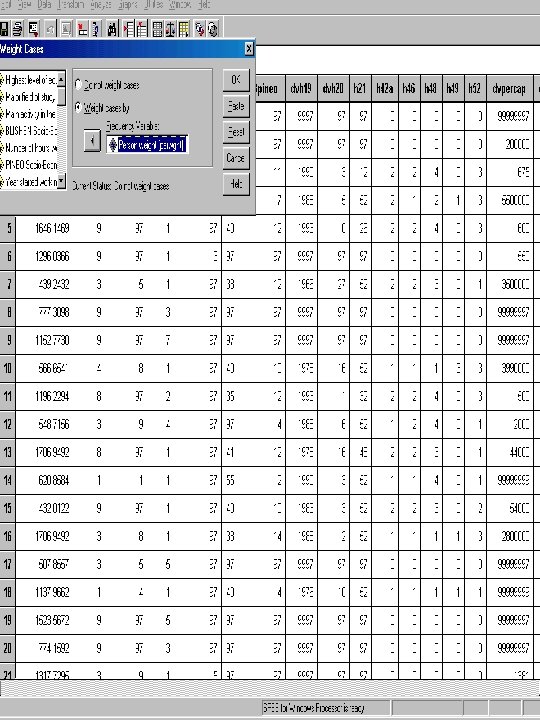
How Does SPSS Apply Weights? u SPSS has a simple procedure for applying weights u Click on “Data” u Click on “Weight Cases” u Tick circle “Weight cases by” u Choose the appropriate weight variable (read the documentation!) u Click “OK”

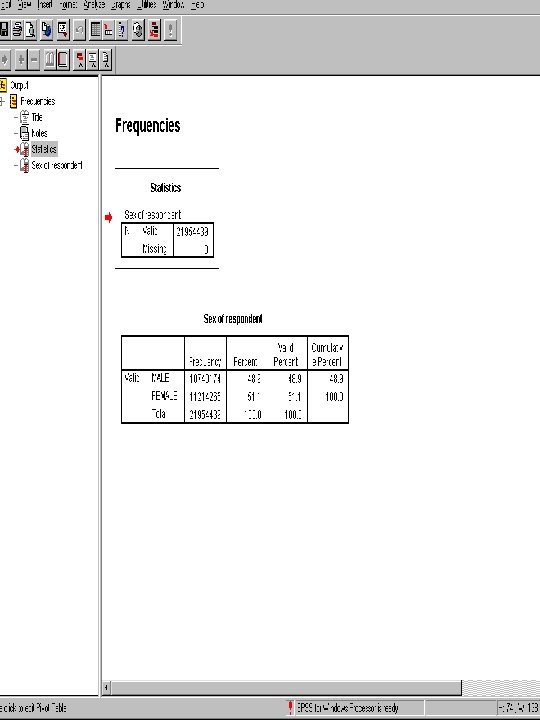
How do Weights Affect Results? u In most cases, Statistics Canada weights data to reflect population estimates u GSS 9 unweighted = 11, 876 individuals u GSS 9 weighted = 21, 944, 439 individuals u This usually results in changed percentages u GSS 9 unweighted = 54. 7% females u GSS 9 weighted = 51. 1% females u This can have a profound affect on the analyses

BUT……. u Statistical tests of significance cannot be used with population estimates because: u They are dependent on the number of observations u The larger the number of observations, the more likely the results will be significant (i. e. . appear important just because of the size of the population)! u So how do you fix that?

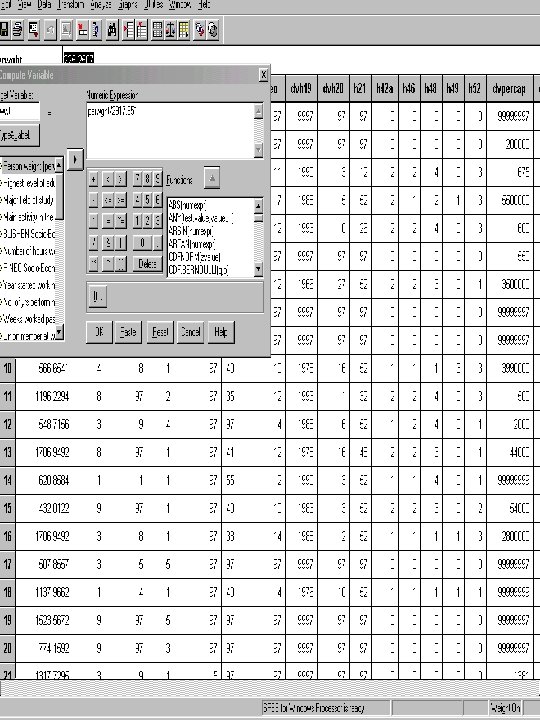
Adjusting the Weights u Problem: You need to weight the data for accurate results and you can’t use the population weight because you want to use statistical tests of significance u Solution: Calculate a working weight that will keep things in balance, but return to the sample size u Make the subset and then calculate: u Working weight= pop weight/mean pop weight
 of the weight variable u")
Calculate the Working Weight u Find the mean (average) of the weight variable u Compute a working weight variable u Apply the working weight as before

Check the Results u The percentages will be exactly the same as population percentages! u The number of respondents will be reduced to reflect the sample size!

When to Use What u Use population weights when: u you require population estimates or u you are not doing statistical tests of significance u Use working weights when: u you are using statistical tests of significance

Time for a Break!!!!

- Slides: 37