Data intensive computing Inf2202 Concurrent and System Level

![“Data, data everywhere” Source: The Economist [http: //www. economist. com/node/15557443? story_id=15557443]](https://slidetodoc.com/presentation_image_h2/bd24d54fbe77cff0cfb2192cacc7cf7c/image-2.jpg "“Data, data everywhere” Source: The Economist [http: //www. economist. com/node/15557443? story_id=15557443]")


 1. 2. 3. 4. 5. 6. 7. 8. 9. Get")
 Top-row images from Mabcent-SFI: http: //www 0. nfh. uit. no/mabcent/ Illumina Mi.")
 sequencing • A flow cell covered with")


![End-File Format (FASTQ) @x 7001_6_1_892_763 ATGTTATGTATTGGAAATGAGCATACGATAAA +x 7001_6_1_892_763 ^^^^^^^^^^]\\\V\YX @x 7001_6_1_887_763 TTAGCAGCATCTGCTTCAACATATACCAAAGC +x 7001_6_1_887_763](https://slidetodoc.com/presentation_image_h2/bd24d54fbe77cff0cfb2192cacc7cf7c/image-29.jpg "End-File Format (FASTQ) @x 7001_6_1_892_763 ATGTTATGTATTGGAAATGAGCATACGATAAA +x 7001_6_1_892_763 ^^^^^^^^^^]\\\V\YX @x 7001_6_1_887_763 TTAGCAGCATCTGCTTCAACATATACCAAAGC +x 7001_6_1_887_763")


 Next gen. sequencing machine Images 700 GB in")
 Heidelberg, KB, Gilbert, JA and")


")


 Sequencer METApipe DB´s Ge. Store (incremental updates) (Interactive data")


- Slides: 53
Data intensive computing Inf-2202 Concurrent and System Level Programming University of Tromsø, Fall 2013 Lars Ailo Bongo (larsab@cs. uit. no)
“Data, data everywhere” Source: The Economist [http: //www. economist. com/node/15557443? story_id=15557443]
Big Data Sources • Human produced content – Videos, photos, audio… • Involuntary produced content – Online activity logging, tax records… • Scientific instruments – CERN LHC, Sloan Digital Sky Survey, DNA sequencers… • Sensor data – Deborah Estrin
Outline • Today: – Introduction – Case-study: life science data – My research • 15. 10: – Storage – Batch processing • 22. 10 – Analytics – Interactive processing
Big data players • Industry: – – Google, Facebook, Twitter, Amazon, Netflix, Visa, … Use data to provide services Use data to make money Has developed (most of the) technology for managing and processing peta-scale datasets • Government: – NSA, Skatteetaten, Kartverket, e-resept, … – Use data to make (hopefully) informed decisions – Make data available for public and commercial services • Science – Jim Gray´s last talk – 4 th paradigm book
Outline • Today: – Introduction – Case-study: life science data • Biology • Biotechnology • Computer science challenges – My research • 15. 10: – Storage – Batch processing • 22. 10 – Analytics – Interactive processing
Biology
1. Cell Source: wikipedia
2. Evolution Source: wikipedia
3. Genes • • • Unit of heredity Encoded in DNA Provides some function to the cell Source: wikipedia
4. Homeostasis
5. Energy Source: wikipedia
DNA • Blueprint for the development and function of all organisms • Double helix structure • Four base pairs: A, C, G and T • Also other forms of “DNA”: RNA, m. RNA, etc Source: wikipedia
Human Genome • • • 3 billion base pairs About 23. 000 protein-coding genes First sequenced in 2001 Cost: $3. 000 Ten years later more than 600 persons sequenced Many “personal genomics” startups (such as 23 and. Me) $10. 000 Will all Norwegian cancer patients be sequenced. Cost: in 10 (per person) years? 20 years?
Genomics • Reading a DNA sequence is relatively easy and cheap • Hard part is to understand what it does – Annotation – Function prediction – Regulation prediction • Methods: – Statistics and machine learning = Bioinformatics
Genomics Instruments • Really old days: selective breeding – Example: breading of reindeers • Old days: systematic selective breeding – Example: study of mutation inheritance in fruit flies • Up to a few years ago: microarrays – Machine to read gene expression values • Current: next-generation sequencing – Machine to read DNA sequences
Microarrays to Next-generation Sequencing • Microarrays: innovation is at end of pipeline • Next-generation sequencing: still learning to use technology
“What would you do if you could sequence everything? ”
Next Generation Sequencing (simplified) 1. 2. 3. 4. 5. 6. 7. 8. 9. Get some DNA to sequence Chop DNA into millions of pieces Replicate the pieces Distribute pieces into a matrix on a chip Put chip in a sequencing machine Read sequence in each matrix element in parallel Output millions of short reads Do multiple reads to ensure improve quality Use parallel processing to combine short reads
Biology (again) Top-row images from Mabcent-SFI: http: //www 0. nfh. uit. no/mabcent/ Illumina Mi. Seq image from: www. illumina. com
Chemistry • “Cluster generation” on Illumina (Solexa) sequencing • A flow cell covered with primers is sparsely populated with single-stranded fragments for amplification 1. Cut DNA into many small parts (of 100 -1000 bases) 2. Replicate parts 3. Add parts to chip 4. Read bases of each small part in parallel • Key point: parallel technology with good scalability and low cost
Astronomy • • • Use astronomy grade cameras 800 tiles imaged in four channels – One image per base Typically 37 cycles 118 400 images – 2048 x 1794 16 -bit grey-scale TIFF Best compression algorithm, and expected ratio?
Image Analysis • Goal: measure intensity of each tile for each base 1. Background subtraction: make signal clearer 2. Image correlation: correct camera skew or lens artifacts 3. Object identification: detect cluster representing tile and measure intensity • Easy to parallelize?
Base Calling • Goal: read bases in each short DNA piece 1. Crosstalk correction: signal “leaks” between bases 2. Phasing correction: signal “leaks” between cycles 3. Chastity filtering: tiles may overlap 4. Base calling
Gabor Marth
Amzon AWS
Gabor Marth
End-File Format (FASTQ) @x 7001_6_1_892_763 ATGTTATGTATTGGAAATGAGCATACGATAAA +x 7001_6_1_892_763 ^^^^^^^^^^]\\\V\YX @x 7001_6_1_887_763 TTAGCAGCATCTGCTTCAACATATACCAAAGC +x 7001_6_1_887_763 ^^^^^^^^^^]\\\X\YX Quality scores: int quality = (int) q + 33;
Sequence Analysis • • Do an interesting analysis Publish paper Publish experiment data in a repository Curators integrate results with existing knowledge
Big Data in Life Science
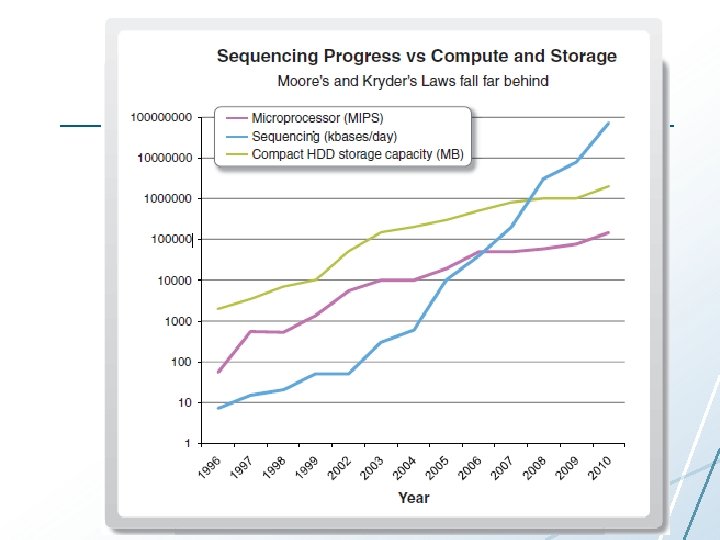
How Bad Is It? • New machines produce more than 1 TB of data per experiment and can run one experiment per day – – Norwegian High-Throughput Sequencing Centre has 4 There is one in Bodø Beijing Genomics Institute (ca. 2008) Dep. Of Chemistry has one • 30 sequencers • one 500 node (dedicated) UNN plans to buy at least in near future supercomputer • 10 TB raw data processed each 24 hours • Let’s compare a microarray data analysis pipeline with a short-read sequencing analysis In 2010 they pipeline bought 128 additional sequencers
Microarray Pipeline Microarray machine Image analysis Values+ quality scores Preprocessing Matrix Clustering, etc. Visualization Graph Bayesian interference “Database”
Microarray Pipeline Microarray machine Image analysis 1 -2 GB per image Values+ quality scores Maunally: one week (single machine, no parallelism) Preprocessing MBs Matrix Clustering, etc. Visualization Graph Bayesian interference “Database” <5 TB (everything)
Next-generation sequencing pipeline Next gen. sequencing machine Images Image analysis Values+ quality scores Base-calling Short reads Alignment or assembly New tools Browsing and annotation Sequence
Next-generation sequencing – pipeline (per Experiment) Next gen. sequencing machine Images 700 GB in hundreds of images Image analysis Values+ quality scores One experiment: One day (big machine, parallelism) Base-calling Short reads 200 -300 GB in text files Alignment or assembly Data exploration Browsing and annotation Sequence 5 -10 GB in text files (per experiment)
Cost of Sequence Based Screening (on Amazon EC 2) Heidelberg, KB, Gilbert, JA and Joint, I (2010) Marine genomics: at the interface of marine microbial ecology and biodiscovery. Microb Biotechnol. 3(5): 531– 543
Big Data in Science • Generally accepted that industry is ahead – HDFS, Map. Reduce, Hbase being adapted • Many custom built systems – CERN CASTOR • Design is typically not published in systems papers – Exception: Sloan Digital Sky Survey & Jim Gray • System requirements may differ from industry – Scientific big data is more interesting than industry big data!
Scientific Storage Systems Source: http: //www. usenix. org/events/lisa 10/tech/slides/cass. pdf
Life Sciences (in 2010)
LHC vs. Life Sciences • LHC – One very expensive instrument – Dedicated compute, storage, and network bandwidth – Computer infrastructure planned for many years • Life science – Many cheap instruments – Computation, storage, and data transfer often afterthought – Compute infrastructure will not be in place for many years
Life Science e. Infrastructure Data feeders Parser Pipelines Cleaning tool Processed data storage Batch processed Data flow Interactive GUIs Data exploration services Single node Data search and exploration Distributed and parallel
Outline • Today: – Introduction – Case-study: life science data – My research • 15. 10: – Storage – Batch processing • 22. 10 – Analytics – Interactive processing
Main goal
Motivation Increase in bionformaticians? @Ui. T
My Research Goals • Observation: the people analyzing genomics data are the main bottleneck for novel scientific insight • Make bioinformatics more efficient – – System support for data management System support for next-generation bioinformatics algorithms Tools for data exploration Take care of scalability, replication, fault-tolerance, data communication, performance, resource allocation…
Google for Bioinformatics • http: //imp. princeton. edu/ • IMP parts: – – • Our parts: • Scalable visualization Interactive visualization What is missing? • Parallel prediction algorithm Prediction algorithm • Automated testing of pipeline data Data integration pipeline • Scalable pipeline fault tolerance • in. Data pipeline Tens • of. Better terabytes of data management • Graphical user interface • Collaboration with Profs. Olga Troyanskaya and Kai Li (Princeton)
Computer Science Challenges • Data storage and compression – Collaborator Kai Li is expert on compression and storage systems (among other things) • Data cleaning and management – Challenging to integrate all available data • Data analytics on peta-scale heterogeneous datasets – Support for advanced machine learning applications • Data exploration tools – Scalability and easy to use (all tools are used by biologists)
Marine bioprospecting Galaxy (computation specification) Sequencer METApipe DB´s Ge. Store (incremental updates) (Interactive data processing, Iterative pipeline steering) Meta. Rep
Compute Science Challenges • Data management – Multiple users in research and industry • Simple and flexible workflow management – Users have different needs • Simple and flexible data exploration and visualization • Cost-effective processing • Integration with national supercomputing resources
A cure for cancer NOWAC Statistical analysis Data cleaning and parameter tuning Visualization
Computer Science Challenges • Data analytics • User interfaces – For analytics and data management • Very large interactive 3 D visualizations
Summary • Big data opportunities and challenges • Next-generation sequencing data – Domain background – Technology producing data – Challenges for building infrastructure • My own research • Next week: systems for storing and processing all the data