Data Gathering and Analysis Sampath Jayarathna Cal Poly


- Slides: 23
Data Gathering and Analysis Sampath Jayarathna Cal Poly Pomona Credit for some of the slides in this lecture goes to www. id-book. com
Data recording • Notes, audio, video, photographs can be used individually or in combination: • Notes plus photographs • Audio plus photographs • Video • Different challenges and advantages with each combination
Interviews • Unstructured - are not directed by a script. Rich but not replicable. • Structured - are tightly scripted, often like a questionnaire. Replicable but may lack richness. • Semi-structured - guided by a script but interesting issues can be explored in more depth. Can provide a good balance between richness and replicability. • Focus groups – a group interview 3
Interview questions • Two types: − ‘closed questions’ have a predetermined answer format, e. g. . ‘yes’ or ‘no’ − ‘open questions’ do not have a predetermined format • Closed questions are easier to analyze • Avoid: − Long questions − Compound sentences - split them into two − Jargon and language that the interviewee may not understand − Leading questions that make assumptions e. g. . why do you like …? − Unconscious biases e. g. . gender stereotypes 4
Enriching the interview process • Props - devices for prompting interviewee, e. g. use a prototype, scenario 5
Questionnaires • Questions can be closed or open • Closed questions are easier to analyze, and may be distributed analyzed by computer • Can be administered to large populations • Disseminated by paper, email and the web • Sampling can be a problem when the size of a population is unknown as is common online evaluation 6
Question and response format • ‘Yes’ and ‘No’ checkboxes • Checkboxes that offer many options • Rating scales – Likert scales Strongly disagree (1), disagree(2), undecided (3), agree(4), strongly agree (5) – semantic scales (fair…. . biased), (weak…. strong) – 3, 5, 7 or more points • Open-ended responses
Observation • Direct observation in the field • Structuring frameworks • Degree of participation (insider or outsider) • Ethnography • Direct observation in controlled environments • Indirect observation: tracking users’ activities • Diaries • Interaction logging • Video and photographs collected remotely by drones or other equipment
Ethnography · Ethnography is a philosophy with a set of techniques that include participant observation and interviews · Ethnographers immerse themselves in the culture that they study · A researcher’s degree of participation can vary along a scale from ‘outside’ to ‘inside’ · Analyzing video and data logs can be time-consuming · Collections of comments, incidents, and artifacts are made 9
Online Ethnography • Virtual, Online, Netnography • Online and offline activity • Interaction online differs from face-to-face • Virtual worlds have a persistence that physical worlds do not have • Ethical considerations and presentation of results are different
Observation in a controlled environment • Direct observation • Think aloud techniques • Indirect observation – tracking users’ activities • Diaries • Interaction logs • Web analytics • Video, audio, photos, notes are used to capture data in both types of observations
A section of Google analytics dashboard for idbook. com
Data Analysis Discuss the difference between qualitative and quantitative data and analysis. Enable you to analyze data gathered from: Questionnaires. Interviews. Observation studies.
Quantitative and qualitative Quantitative data o expressed as numbers o numerical methods to ascertain size, magnitude, amount Qualitative data o difficult to measure sensibly as numbers, e. g. count number of words to measure dissatisfaction o expresses the nature of elements and is represented as themes, patterns, stories Be careful how you manipulate data and numbers! 14
Simple quantitative analysis • Averages, Percentages • Mean: add up values and divide by number of data points • Median: middle value of data when ranked • Mode: figure that appears most often in the data • Be careful not to mislead with numbers! • Graphical representations give overview of data • Google Forms
Simple qualitative analysis • Recurring patterns or themes – Emergent from data, dependent on observation framework if used • Categorizing data – Categorization scheme may be emergent or pre-specified • Looking for critical incidents – Helps to focus in on key events 16
Theoretical frameworks for qualitative analysis • Basing data analysis around theoretical frameworks provides further insight • Two such frameworks are: – Grounded Theory – Distributed Cognition 17
Grounded Theory • Aims to derive theory from systematic analysis of data • Based on categorization approach (called here ‘coding’) • Three levels of ‘coding’ – Open: identify categories – Axial: flesh out and link to subcategories (process of relating categories) – Selective: form theoretical scheme (choose one category to be core category) • Researchers are encouraged to draw on own theoretical backgrounds to inform analysis 18
Code book used in grounded theory analysis 19
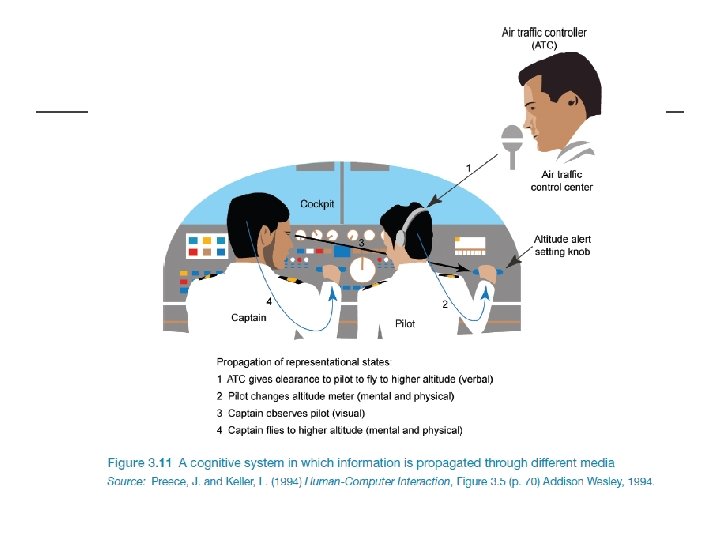
Distributed Cognition • The people, environment & artefacts are regarded as one cognitive system • Used for analyzing collaborative work • Focuses on information propagation & transformation 20
Tools to support data analysis • Spreadsheet – simple to use, basic graphs • Statistical packages, e. g. SPSS • Qualitative data analysis tools – Categorization and theme-based analysis – Quantitative analysis of text-based data – Nvivo http: //www. qsrinternational. com/ – Atlas. ti http: //atlasti. com/ – QDA Miner https: //provalisresearch. com/ 22
Presenting the findings • Only make claims that your data can support • The best way to present your findings depends on the audience, the purpose, and the data gathering and analysis undertaken • Graphical representations (as discussed above) may be appropriate for presentation • Other techniques are: – Rigorous notations, e. g. UML – Using stories, e. g. to create scenarios – Summarizing the findings 23