Data Flow Diagram A method used to analyze

 • A graphical representation of how the data is moving")


- Slides: 14
Data Flow Diagram • A method used to analyze a system in a structured way • Used during: – Analysis stage: to describe the current system – Design stage: to describe the proposed solution
Data Flow Diagrams (DFD) • A graphical representation of how the data is moving inside the system or organization • Advantages – Graphics is better in showing the relationship between subsystems – Easier for the user to validate – Easy to check if there is some information missing – Free from implementation details
DFD Symbols Name Unique No. Name – Anything in the system which receives or originates data • Process – Action done on data (data format changes) • Data Flow Label Unique No. • External Entity| Entity – Data is being moved from one point to another Name • Data Store – Manual or computerized
Steps to Create DFD • • • Make a list of business activities Create a context diagram Create diagram 0 Create child diagrams Check for errors in diagrams • Go back to the user when you have unclear areas
Context Diagram • A diagram which shows the system and its boundaries • Shows overview of the system – All external entities – One general process that represents the whole system
Diagram 0 • Shows major processes in the system • Shows external entities • Shows major data stores • All the input and output data in diagram 0 should be consistent with context diagram
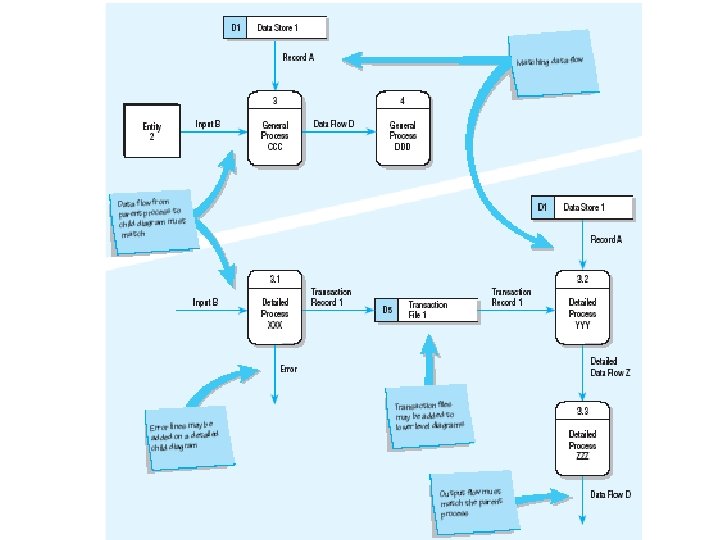
Child Diagrams • Each complex process in diagram 0 will have a child diagram to show its details • Process that expands into child diagram is called “parent process” • Includes data stores and sub processes – Includes exception handling processes • No external entities are shown in child diagrams • Primitive process: a process that doesn’t have a child diagram
Rules for DFD • A process should have at least one input and one output • Do not connect an entity to another or to a data store directly • Diagram 0 should not have more than 9 processes • Give unique numbers to processes and data stores • Give meaningful names to symbols
Rules for DFD • Check the consistency of data flow between context diagram and diagram 0 • Child diagram should have the same input/output as the parent diagram • Process names should have an action (verb) • Data flow labels should be nouns and should not be too long
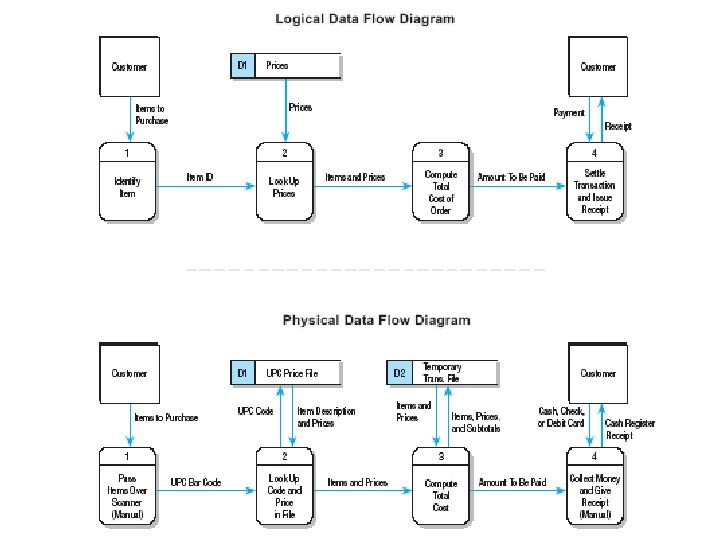
DFD Types • Logical – Describes business operation – Used during analysis to better understand the analyzed system and to communicate with the users – Processes are business activities • Physical – Describes system implementation – Used during the design stage – Processes are program modules
Partitioning a DFD • After finishing the DFD, analyze it and partition processes according to their types • Draw dashed lines to partition • Partition process that are: – Done by different users – Done at different times – Needs different security operations – Working on same data
Partition a DFD • Manual process • Batch process – Processes that follow each other from a data store • Online or interactive process • Job streaming process – Programs running back-to-back