Data Collection Training Session 7 Power Point Created


 or (0) is a data point")


 Incorrect Response = Slash (/)")
 OR Prompt")
 Use the graph provided on the right hand side")
 Step 1: Add the total number of")
 STEP 2: Add the total number of")
 STEP 3: 68/120 = 57%")

")
 STEP 1: Add the")
 STEP 2: 50/5 =")

")
 STEP 1: Add the")
 STEP 2: P –")


 run")


- Slides: 37
Data Collection Training Session 7 Power Point Created by: Suzanne Fitzgerald & Candice Styer styer. fitzgerald@gmail. com www. styer-fitzgerald. com
Training Objectives Participants will: § Become familiar with the different data collection systems used in the Styer-Fitzgerald program. § Learn how to collect data while applying the teaching procedures you learned in Training Session 6.
Process of Implementation
For this section of the training, you will need: YOUR CURRICULUM BOOK YOUR REPRODUCIBLE MATERIALS
Why Collect Data? 1. To track progress 2. To track lack of progress
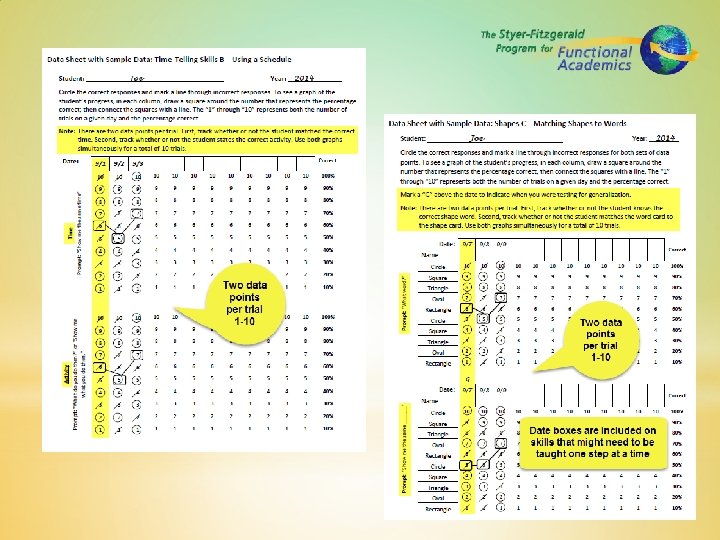
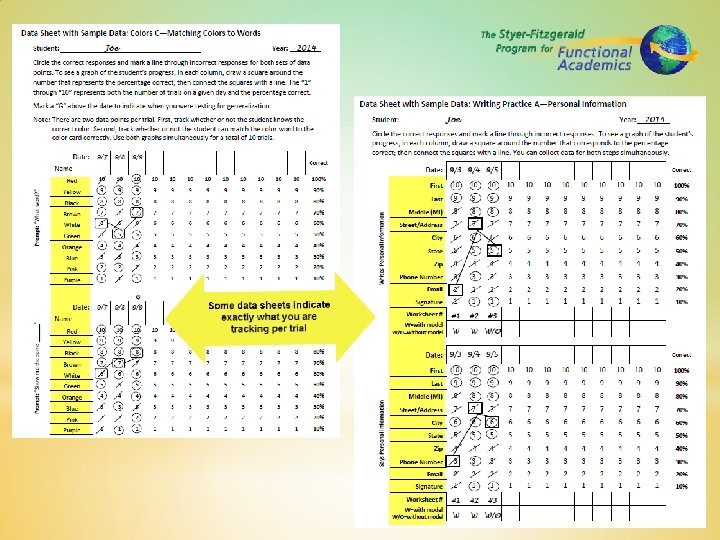
What is a Data Point? § Every (/) or (0) is a data point § At the top of each data sheet, it will tell you how many data points there are.
Discrete Trial Data Sheets
Task Analysis Data Sheets
Other Data Sheets
What Constitutes a Prompt?
The Data Collection Rule Correct Response = Circle (O) Incorrect Response = Slash (/) Remember – Even if a student responds correctly after a correction procedure is used, the trial is still marked incorrect (/).
Defining a Trial Prompt Correct Response Reinforce = 1 Trial, Mark (O) OR Prompt Incorrect Response Correction Procedure Correct Response = 1 Trial, Mark (/)
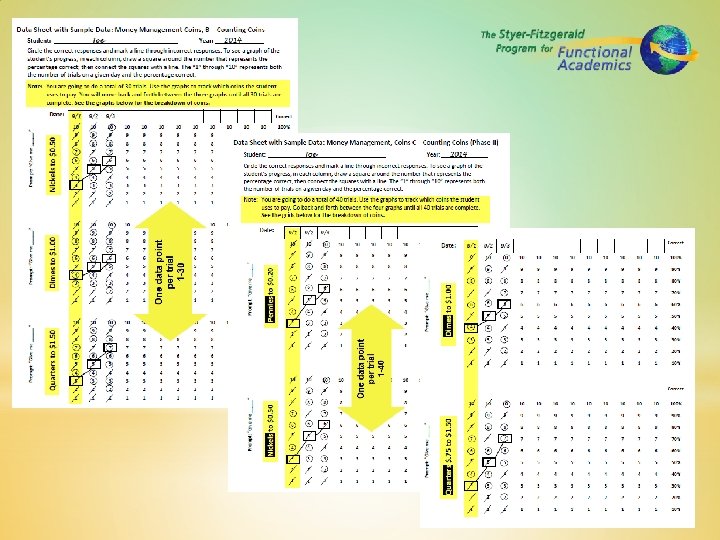
Summarizing Data – Daily (DTT) Use the graph provided on the right hand side of each DTT data sheet to indicate the daily percentage correct.
SUMMARIZING DATA – FOR IEP/PROGRESS REPORTING (DTT) Step 1: Add the total number of correct responses over the past 12 days (i. e. , 68) 3 + 5 + 4 + 5 + 6 + 7 + 5 + 7 + 6 + 8 + 6 = 68
SUMMARIZING DATA – FOR IEP/PROGRESS REPORTING (DTT) STEP 2: Add the total number of possible correct response (i. e. , 120). 10 + 10 + 10 + 10 = 120
SUMMARIZING DATA – FOR IEP/PROGRESS REPORTING (DTT) STEP 3: 68/120 = 57%
Using Data for IEP Progress Reporting FOR EXAMPLE: Short-Term Objective: Student will count money using next-dollar strategy from $. 01 to $5. 00 with 70% accuracy. Progress: Student is making progress toward the objective but has not met the long-term goal.
SUMMARIZING DATA - DAILY (TA # OF PROMPTS)
SUMMARIZING DATA – FOR IEP/PROGRESS REPORTING (TA # OF PROMPTS) STEP 1: Add the total number of prompts for each day (i. e. , 50) 17 + 9 + 10 + 7 = 50
SUMMARIZING DATA – FOR IEP/PROGRESS REPORTING (TA # OF PROMPTS) STEP 2: 50/5 = 10
Using Data for IEP Progress Reporting FOR EXAMPLE: Short-Term Objective: Student will put on a shirt with less than 2 prompts. Progress: Student is making progress toward the objective but has not met the long-term goal.
SUMMARIZING DATA - DAILY (TA TYPE OF PROMPT)
SUMMARIZING DATA – FOR IEP/PROGRESS REPORTING (TA TYPE OF PROMPT) STEP 1: Add the total number of prompts for each type (i. e. , P = 25, G = 20, V = 10)
SUMMARIZING DATA – FOR IEP/PROGRESS REPORTING (TA TYPE OF PROMPT) STEP 2: P – 25/5 = 5 G – 20/5 = 4 V -10/5 = 2
Using Data for IEP Progress Reporting FOR EXAMPLE: Short-Term Objective: Student will put on a shirt with less than 2 prompts. Progress: Student is making progress toward the objective but has not met the long-term goal.
Data Collection – When & How Often § Take data consistently and frequently. § Take data on the first 10 trials. NOTE: You do not need to retake baseline data (without reinforcement or correction procedures)
Tracking Progress & Decision Making § Review data frequently. § If a student is not progressing, break the task into additional steps or additional prompts. § If a student has met criteria, move them to the next step. § Use data for IEP progress reporting.
Using the CPG to monitor progress over time § Use the Curriculum Progress Guide to track progress on IEP goals. § The Placement Guide provides an easy-to manage system for tracking IEP progress. § The Progress Guide gives parents, guardians & administrators an overview of students’ learning achievements.
For Example: Curriculum Progress Guide
Data Collection – Reliability § Take data while others (Peer Tutors or Para-Educators) run programs to check for reliability. § If reliability is under 90%, revisit teaching strategies and data collection. § It is very common to misunderstand how to mark data following a correction procedure. § Use the rule for marking (0) or (/)
Use Initials to Check for Reliability
ACTIVITY 1 –RELIABILITY DATA § Get out a piece of paper & write the numbers 10 -1 to look like a discrete trial data sheet. § Watch the trainers run 10 trials and take data during this process. § After the 10 trials are complete, compare data with the trainers. § Pay attention to the teacher’s use of prompting, reinforcement & correction procedures.
ACTIVITY 2 –PRACTICE RUNNING LESSONS § Find a partner. § Use the provided data sheets & Reproducibles from your training materials to practice running various lessons from several different content areas. Refer to your Curriculum book from your Teaching Package for specific lesson plans and instructional guidelines. § Be sure to practice prompting, reinforcing, correcting & taking data.
Continue to: Organizing the Classroom Training Session 5