Data Collection Survey Sampling Survey Sampling Aim Obtain

Data Collection Survey Sampling 問卷調查和訪談
 by examining only")
Survey Sampling • Aim : –Obtain information about large populations (母群體) by examining only a portion (樣本, Sample). –是否可推算母群體之可能特性,並作為決策之參考? –Traffic, tax audits, quality control, census preparation, 市場調查. . . –Systematic enumeration of the beginning of the list is NOT a good idea, alphabetical, age-related, hour-related order. • Random sampling guards against investigator bias. • Above all, this randomness, as we will see allows an estimate of the error, (we can even design the sample size necessary to obtain a given precision). • Population Parameters –Numerical characteristics we are interested in. –We will derive approximations of their values through estimates based on part of the population only: the sample. –Population size N, sample size n. –We will use x 1, x 2, x 3, …, x. N to denote the population numbers, they could be real integers, binary(dichotomous), or categorical.
 samples taken")
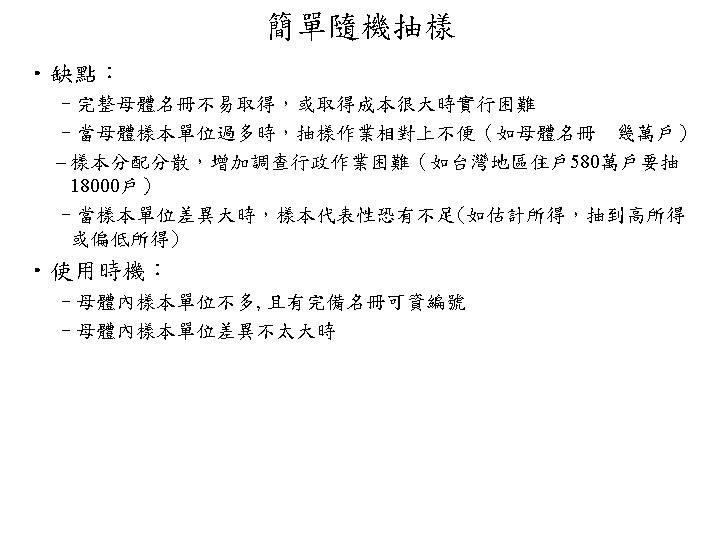
簡單隨機抽樣 Simple Random Sampling • Definition: 母體中的每個元素均有相同的機率被抽中 – There are C(N, n) samples taken without replacement. – How is this done? Imagine, numbered billiard balls in urns. Old days : tables, now computer random number generator, based on uniform random number generator – Composition of the sample is random (the labels are random) implies that the sample mean, the sample total. . . are random variables. – The population mean is a number, the sample mean is a random variable whose accuracy as an estimate can be evaluated by a probabilistic analysis. • Expectation and Variance of the Sampling Mean – From sample mean we can also estimate the total if we know the population size. – Xi's distribution is called the sampling distribution. – Determines how accurately sample mean estimates population mean (m)?

Example • Population N=393 short-stay hospitals, • xi = # patients discharged during the month of January 1968. • As a list of 393 values would have been useless, we can use histogram (into groups of 200) to present it. –Population mean (average) is 814. 6031 –Population variance is 347, 776 and std=589. 7 • Use SRS with n=16 to determines how accurately sample mean estimates population mean? –The total number of possible samples 393 choosing 16 is around 1033. –We will use simulation techniques, say create 500 samples of different sizes.
. Coefficient alpha and the internal structure of")
Cronbach’s α信度 • Cronbach, L. J. (1951). Coefficient alpha and the internal structure of tests. Psychometrika. 16, 297 -334. • It is a measure of squared correlation between observed scores and true scores. Put another way, reliability is measured in terms of the ratio of true score variance to observed score variance. – The theory behind it is that the observed score is equal to the true score plus the measurement error (xni = tn + eni). – For example, I know 80% of the materials but my score is 85% because of lucky guessing. In this case, my observed score is 85 while my true score is 80. The additional five points are due to the measurement error. – A reliable test should minimize the measurement error so that the error is not highly correlated with the true score. On the other hand, the relationship between true score and observed score should be strong. Cronbach Alpha examines this relationship.

Calculation of Cronbach’s α • Cronbach's Alpha measures how well a set of items measures a single one-dimensional latent construct. – When data have a multidimensional structure, Cronbach's Alpha will usually be low. (Xni = Tn + eni) • Population: [Cov(T, S 1≦i ≦k Xi)]2/[Var(T)Var(S 1≦i ≦k Xi)] = k 2 Var(T)/Var(S 1≦i ≦k Xi) =[ k/(k-1) ] ×[1 - S 1≦i ≦k Var(Xi)/Var(S 1≦i ≦k Xi) ] • k/(k-1) ×[1 - (S 1≦i ≦k Var(item i)/Var(total score)] – k:測驗題數 • Suppose we have a 5 (k=5) item instrument and 15 (n=1, …, 15) testers. –測驗分數之變異數:Use 15 total scores to figure out Var(total score). –個別題目分數之變異數:For each item, use 15 item scores to figure out Var(item 1), …, Var(item 5). • 低信度:α<0. 35, 中信度: 0. 35<α<0. 70, 高信度: 0. 70<α
- Slides: 21