Data coding and entry in SPSS Dr Samira


 1. Click Open- Data… 2. Change Files of type")
 3. Select the worksheet, the range (if desired), and")

- Slides: 37
Data coding and entry in SPSS Dr. Samira M. Mahboub Ph. D Public Health, Alexandria University FHEA, Higher Education Academy, UK
Working with data • Pretest the questionnaire • Data coding • Data entry
PRETESTING THE QUESTIONNAIRE • Find 5 -10 people from your target groups • Ask them to complete the survey while thinking out loud • Observe how they complete the study • Make improvements based on the results
Quantitative data DATA ENTRY Don’t forget: The first step is to give each questionnaire a serial number
Level of measurements of variables There are 2 main types of quantitative data: 1. Categorical variables • Nominal, e. g. gender • Ordinal, e. g. low, medium & high economic status 2. Numerical variables …scale
Level of measurements of variables • scale: to represent a numeric variable that can take discrete or continuous values along a range • Continuous e. g. Weight…. 75. 2 kg • Discrete e. g. No. of siblings 3
Categorical • Ordinal: to represent values that, although numeric, only represent an ordered listing of such values e, g, educational level • Nominal: to represent values that are simply names (no order) e. g. sex; male and female
DATA ENTRY Coding Every response item in the questionnaire needs to be entered as numbered code For each question a coding scheme is designed on the basis of the response items included. e. g. What is your gender? “ 1” code for = male, “ 2” code for = female How many cigarettes do you smoke in a day? 20 The method of coding is largely dictated by 2 considerations: 1. 2. The way a variable has been measured in our research instrument The way we want to communicate the findings about a variable to your readers
e. g. “Women decision making power in family of Bangladesh” Questionnaire 1 2 3 4
e. g. “Women decision making power in family of Bangladesh” Code book
Coding with Likert scale Suggest coding system for each response • 5 for strongly agree, • 4 agree • 3 neutral • 2 disagree • 1 strongly disagree In case of negatively quoted questions, reverse scoring should be used
• So scoring system is consistent and keeping high values for positive meanings and vice versa • Example
Quantitative data Data Entry
Quantitative data DATA ENTRY Entering Data Identify each variable, then enter the data for each questionnaire. Name of variable
Opening SPSS • Start → All Programs → SPSS Inc→ SPSS 16. 0
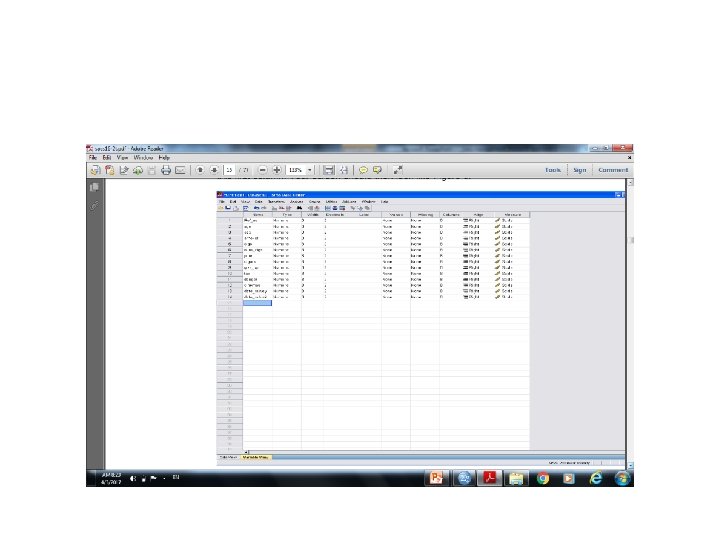
Opening SPSS • The default window will have the data editor • There are two sheets in the window: 1. Data view 2. Variable view
Data View window • The Data View window This sheet is visible when you first open the Data Editor and this sheet contains the data • Click on the tab labeled Variable View Click
Variable View window • This sheet contains information about the data set that is stored with the datasheet • Name • The first character of the variable name must be alphabetic • Variable names must be unique, and have to be less than 64 characters. • Spaces are NOT allowed.
• the name must begin with a letter. The remaining characters can be any letter, any digit, a period, or the symbols @, #, _, or $ • spaces and special characters (eg !, ? , ', and *) cannot be used • each variable name must be unique; duplication is not allowed
Variable View window: Type • Click on the ‘type’ box. The two basic types of variables that you will use are numeric and string. This column enables you to specify the type of variable.
Variable View window: Width • Width allows you to determine the number of characters SPSS will allow to be entered for the variable
Variable View window: Decimals • Number of decimals • It has to be less than or equal to 16
Variable View window: Label • You can specify the details of the variable • You can write characters with spaces up to 256 characters
Variable View window: Values • This is used and to suggest which numbers represent which categories when the variable represents a category
Defining the value labels • Click the cell in the values column as shown below • For the value, and the label, you can put up to 60 characters. • After defining the values click add and then click OK. Click
Variable View window: Missing • Values that the system will recognize as missing
Variable View window: Columns • # of columns used to display variable in data view
Variable View window: Align • Variable left, right, or center aligned
Variable View window: Measure • Scale on which variable is measured – Nominal, Ordinal, or Scale (Interval or Ratio)
Variable Formats • Scale. Data values are numeric values on an interval or ratio scale-for example, age or income. Scale variables must be numeric. • Ordinal. Data values represent categories with some intrinsic order (for example, low, medium, high; strongly agree, disagree, strongly disagree). Ordinal variables can be either string (alphanumeric) or numeric values that represent distinct categories (for example, 1 = low, 2 = medium, 3 = high). • Nominal. Data values represent categories with no intrinsic order--for example, job category or company division. Nominal variables can be either string (alphanumeric) or numeric values that represent distinct categories--for example, 1 = Male, 2 = Female.
Quantitative data DATA ENTRY Entering Data • If the question is not answered – leave the cell blank or code it as no response(e. g. 99) • If the respondent missed an entire page of the survey – if possible, contact that respondent again to complete the survey. Or leave the cells for unanswered questions blank • If 2 responses are selected for a question when only one is requested – treat this question as if it were not answered, as this invalidates the data for the question. • If an open-ended response is incomplete – enter the data that are given
Quantitative data DATA ENTRY Cleaning Data • After entering all the data, you will want to clean it to make sure it is accurate. • Data cleaning is the act of detecting & correcting (or removing) corrupt or inaccurate records from a record set, table or database. • Identify incomplete, incorrect, inaccurate, irrelevant parts of data. • If you have a small number of questionnaires – Go through each paper survey & compare it with your data in the database to make sure the 2 documents match. • If you have a large number of questionnaires – frequency tables are done for all variables to detect unusual entries, such as a 14 when the responses range from 1 to 4.
Saving the data • To save the data file you created simply click ‘file’ and click ‘save as. ’ You can save the file in different forms by clicking “Save as type. ” Click
Data Entry (import from Excel) 1. Click Open- Data… 2. Change Files of type to Excel, then browse and open the file. SPSS- Tutorial- Sample Files 35
Data Entry (import from Excel) 3. Select the worksheet, the range (if desired), and if to read variable names- click OK The data and variable names will appear 36
Exporting SPSS Output to a File • SPSS output can be exported to other programs • Either entire output file, or selected tables • Export to Word, HTML, Excel, Text, PDF, or Power. Point