
Data Analytics BE2015 Pattern UnitI Introduction and Life
Data Analytics (BE-2015 Pattern) Unit-I: Introduction and Life Cycle By Prof. B. A. Khivsara Note: The material to prepare this presentation has been taken from internet and are generated only for students reference and not for commercial use.
Big Data Overview • Industries that gather and exploit data • Credit card companies monitor purchase • Good at identifying fraudulent purchases • Mobile phone companies analyze calling patterns – e. g. , even on rival networks • Look for customers might switch providers • For social networks data is primary product • Intrinsic value increases as data grows

Attributes Defining Big Data Characteristics • Huge volume of data • Not just thousands/millions, but billions of items • Complexity of data types and structures • Varity of sources, formats, structures • Speed of new data creation and grow • High velocity, rapid ingestion, fast analysis
Attributes Defining Big Data Characteristics • Volume • Big Data observes and tracks what happens from various sources which include business transactions, social media and information from machine-to-machine or sensor data. This creates large volumes of data. • Variety • Data comes in all formats that may be structured, numeric in the traditional database or the unstructured text documents, video, audio, email, stock ticker data. • Velocity • The data streams in high speed and must be dealt with timely. The processing of data that is, analysis of streamed data to produce near or real time results is also fast.
Big Data Analytics Importance • Cost Savings : help in identifying more efficient ways of doing business. • Time Reductions : helps businesses analyzing data immediately and make quick decisions based on the learnings. • New Product Development : By knowing the trends of customer needs and satisfaction through analytics you can create products according to the wants of customers. • Understand the market conditions : By analyzing big data you can get a better understanding of current market conditions. • Control online reputation: Big data tools can do sentiment analysis. Therefore, you can get feedback about who is saying what about your company.
Sources of Big Data Deluge • • Mobile sensors – GPS, accelerometer, etc. Social media – 700 Facebook updates/sec in 2012 Video surveillance – street cameras, stores, etc. Video rendering – processing video for display Smart grids – gather and act on information Geophysical exploration – oil, gas, etc. Medical imaging – reveals internal body structures Gene sequencing – more prevalent, less expensive, healthcare would like to predict personal illnesses
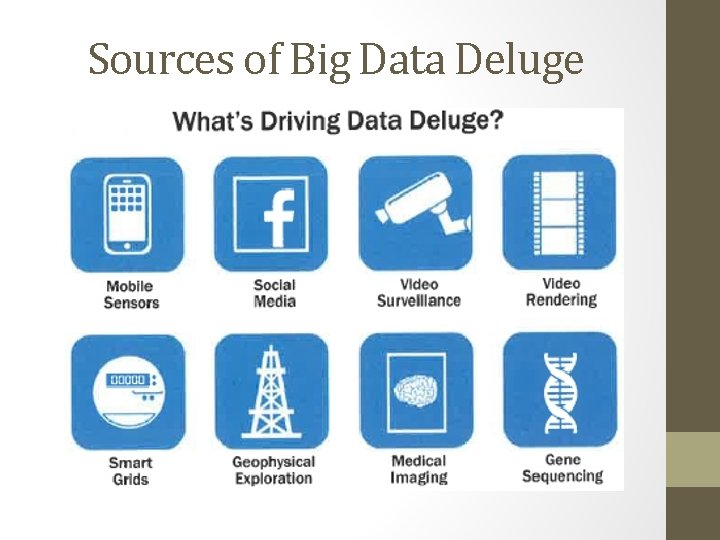
Sources of Big Data Deluge
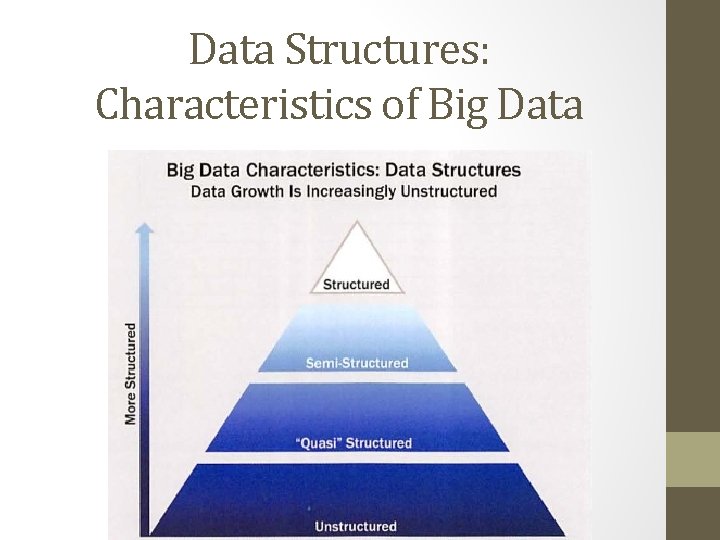
Data Structures: Characteristics of Big Data
Data Structures: Characteristics of Big Data • Structured – defined data type, format, structure • Transactional data, OLAP cubes, RDBMS, CVS files, spreadsheets • Semi-structured • Text data with discernable patterns – e. g. , XML data • Quasi-structured • Text data with erratic data formats – e. g. , clickstream data • Unstructured • Data with no inherent structure – text docs, PDF’s, images, video
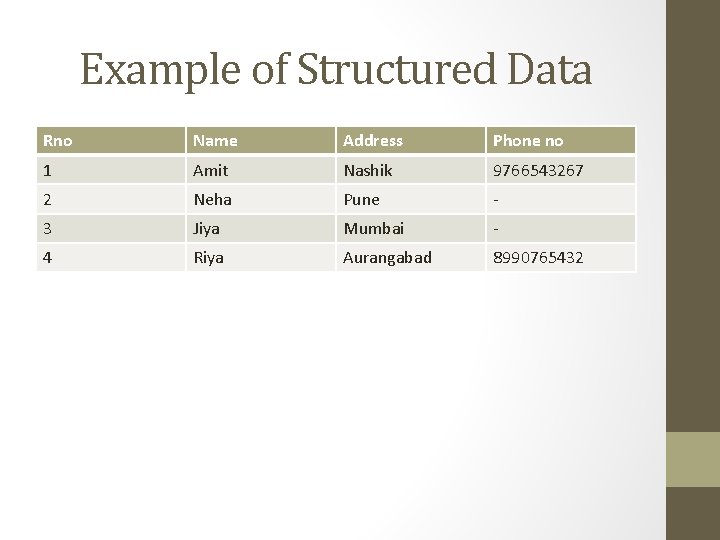
Example of Structured Data Rno Name Address Phone no 1 Amit Nashik 9766543267 2 Neha Pune - 3 Jiya Mumbai - 4 Riya Aurangabad 8990765432
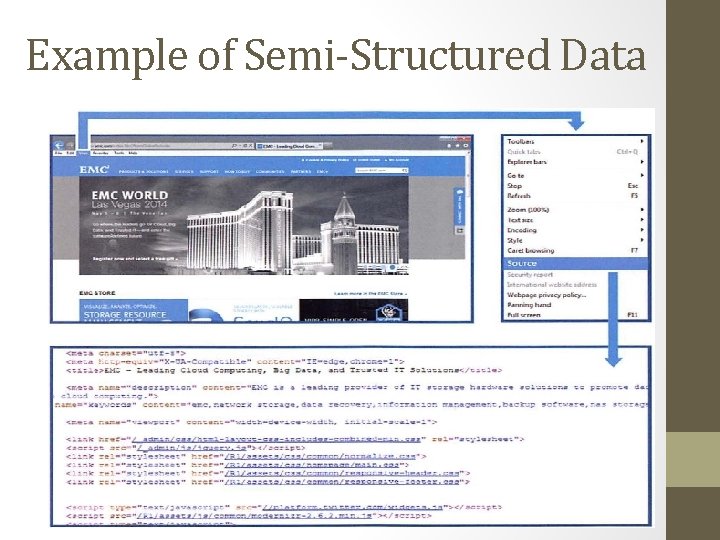
Example of Semi-Structured Data

Example of Quasi-Structured Data visiting 3 websites adds 3 URLs to user’s log files
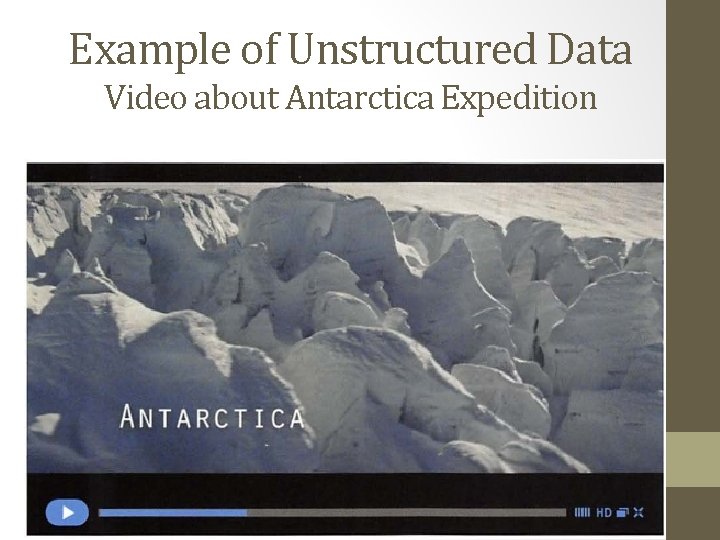
Example of Unstructured Data Video about Antarctica Expedition
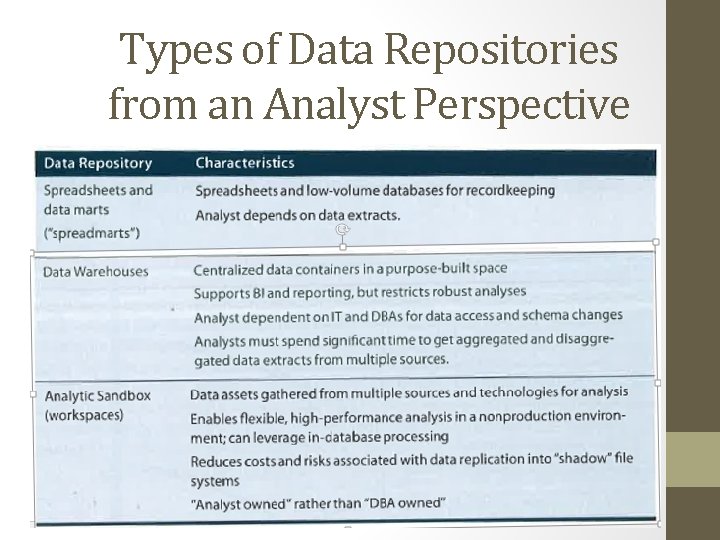
Types of Data Repositories from an Analyst Perspective
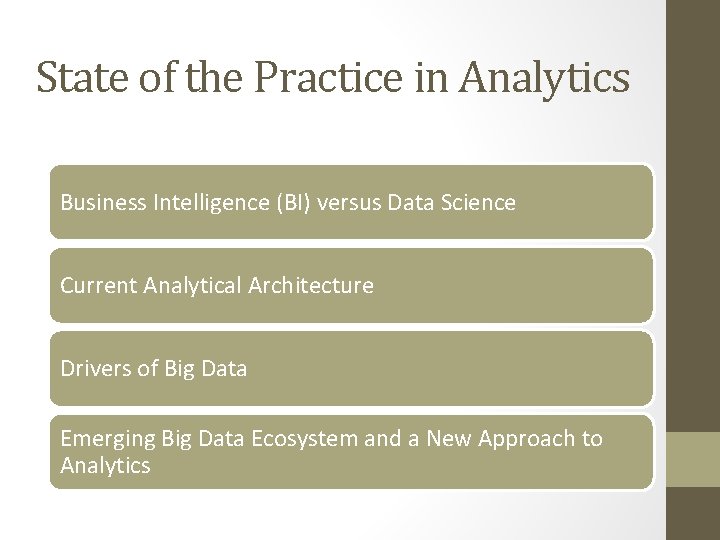
State of the Practice in Analytics Business Intelligence (BI) versus Data Science Current Analytical Architecture Drivers of Big Data Emerging Big Data Ecosystem and a New Approach to Analytics
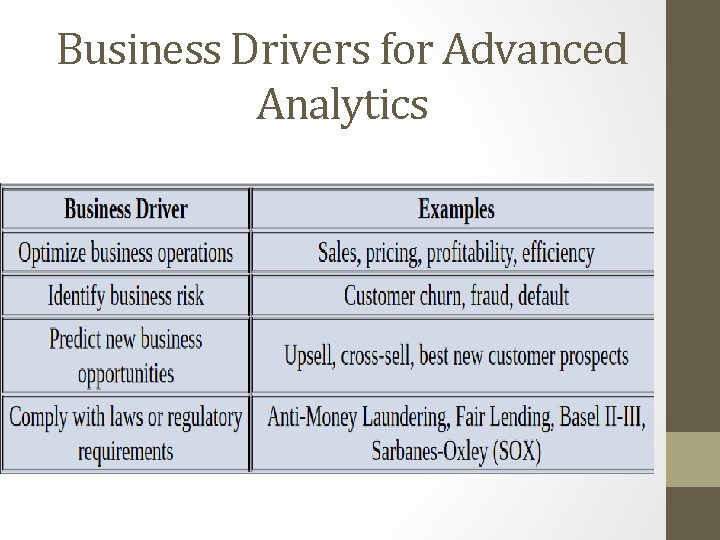
Business Drivers for Advanced Analytics
Data Analytics Techniques BI (Business Intelligence) Data Science
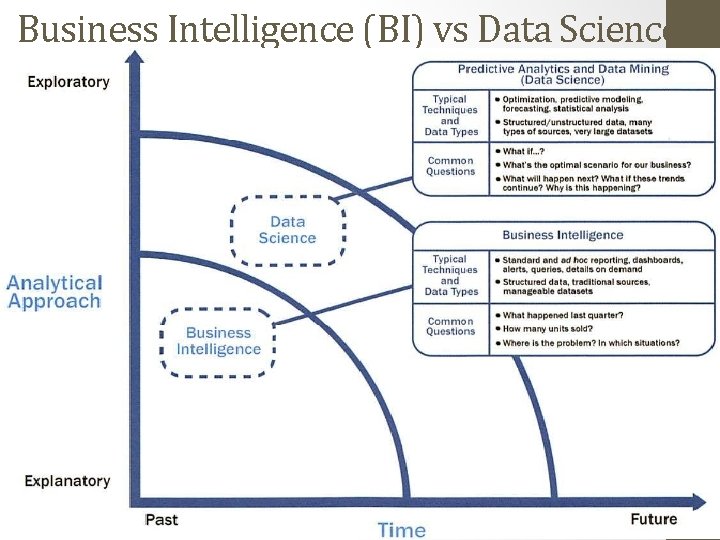
Business Intelligence (BI) vs Data Science
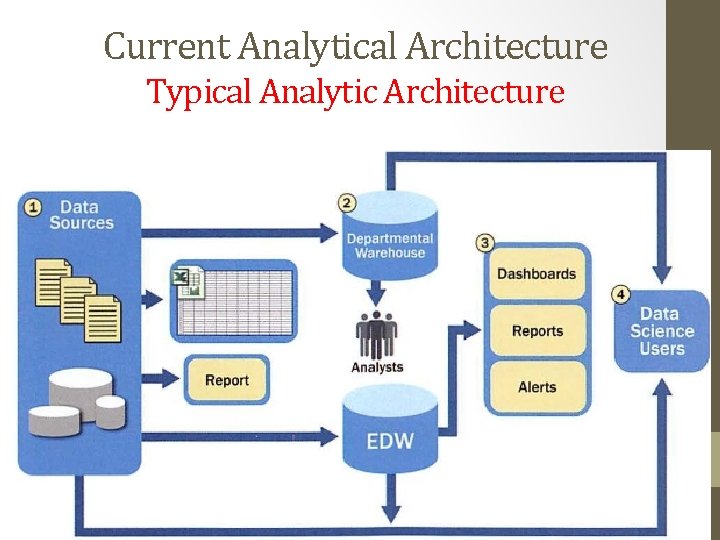
Current Analytical Architecture Typical Analytic Architecture
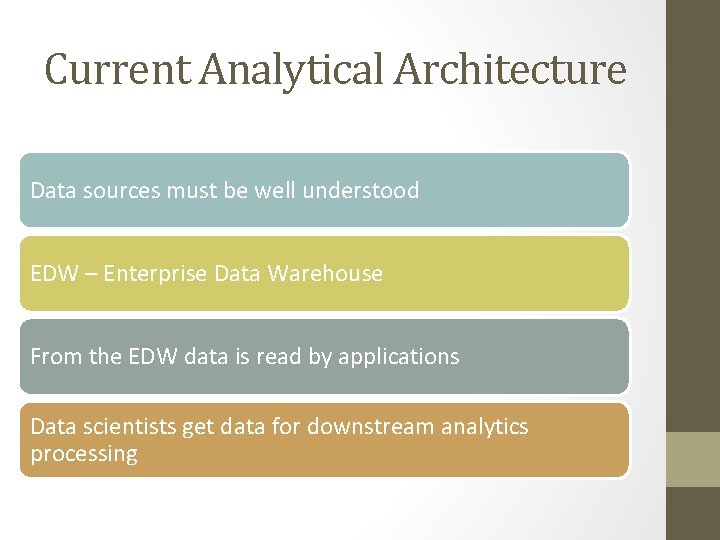
Current Analytical Architecture Data sources must be well understood EDW – Enterprise Data Warehouse From the EDW data is read by applications Data scientists get data for downstream analytics processing
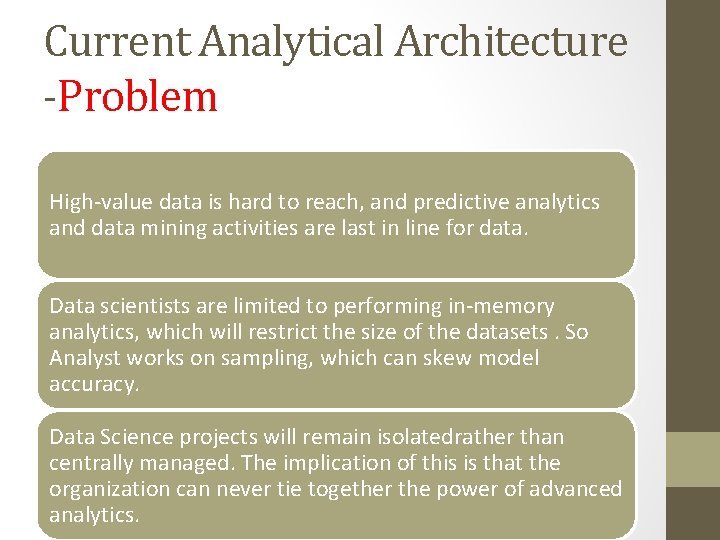
Current Analytical Architecture -Problem High-value data is hard to reach, and predictive analytics and data mining activities are last in line for data. Data scientists are limited to performing in-memory analytics, which will restrict the size of the datasets. So Analyst works on sampling, which can skew model accuracy. Data Science projects will remain isolatedrather than centrally managed. The implication of this is that the organization can never tie together the power of advanced analytics.
Current Analytical Architecture -Solution • One solution to this problem is to introduce analytic sandboxes to enable data scientists to perform advanced analytics.
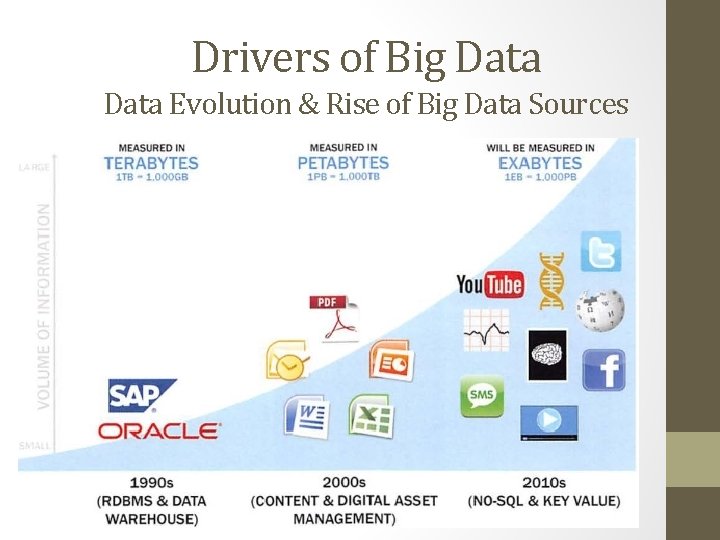
Drivers of Big Data Evolution & Rise of Big Data Sources
Drivers of Big Data Evolution & Rise of Big Data Sources • Medical information, such as diagnostic imaging • Photos and video footage uploaded to the World Wide Web • Video surveillance, such as the thousands of video cameras across a city • Mobile devices, which provide geospatial location data of the users • metadata about text messages, phone calls, and application usage on smart phones • Smart devices, which provide sensor-based collection of information from smart • Nontraditional IT devices, including the use of radio-frequency identification (RFID) readers, GPS navigation systems, and seismic processing
Emerging Big Data Ecosystem and a New Approach to Analytics • Four main groups of players • Data devices • Games, smartphones, computers, etc. • Data collectors • Phone and TV companies, Internet, Gov’t, etc. • Data aggregators – make sense of data • Websites, credit bureaus, media archives, etc. • Data users and buyers • Banks, law enforcement, marketers, employers, etc.
Emerging Big Data Ecosystem and a New Approach to Analytics • Data devices • Gather data from multiple locations and continuously generate new data about this data. For each gigabyte of new data created, an additional petabyte of data is created about that data. • For example, playing an online video game, Smartphones data, Retail shopping loyalty cards data • Data collectors • Include sample entities that collect data from the device and users. • For example, Retail stores tracking the path a customer • Data aggregators – make sense of data • They transform and package the data as products to sell to list brokers for specific ad campaigns. • Data users and buyers • These groups directly benefit from the data collected and aggregated by others within the data value chain. • For Example, People want to determine public sentiments toward a candidate by analyzing related blogs and online comments
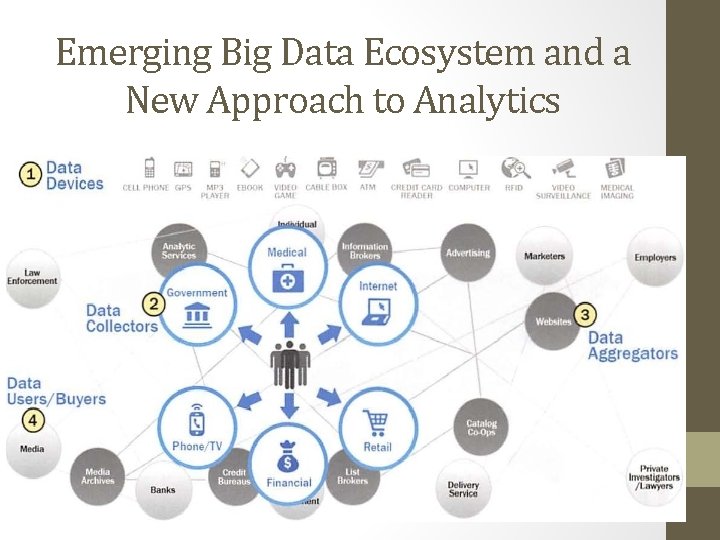
Emerging Big Data Ecosystem and a New Approach to Analytics
Key Roles for the New Big Data Ecosystem 1. Deep analytical talent • Advanced training in quantitative disciplines – e. g. , math, statistics, machine learning 2. Data savvy(Intelligent , knowledgeable) professionals • Savvy but less technical than group 1 3. Technology and data enablers • • • Support people – e. g. , DB admins, programmers, etc. This group represents people providing technical expertise to support analytical projects, such as provisioning and administrating analytical sandboxes, and managing large-scale data architectures
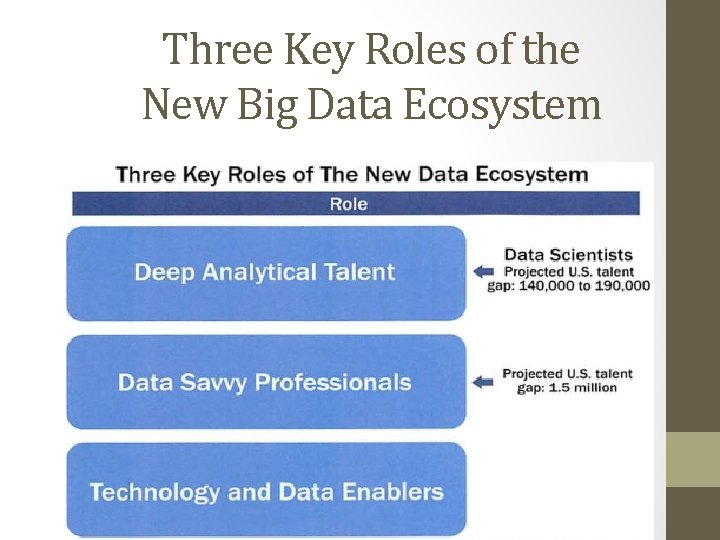
Three Key Roles of the New Big Data Ecosystem
Three Recurring Data Scientist Activities 1. Reframe business challenges as analytics challenges 2. Design, implement, and deploy statistical models and data mining techniques on Big Data 3. Develop insights that lead to actionable recommendations
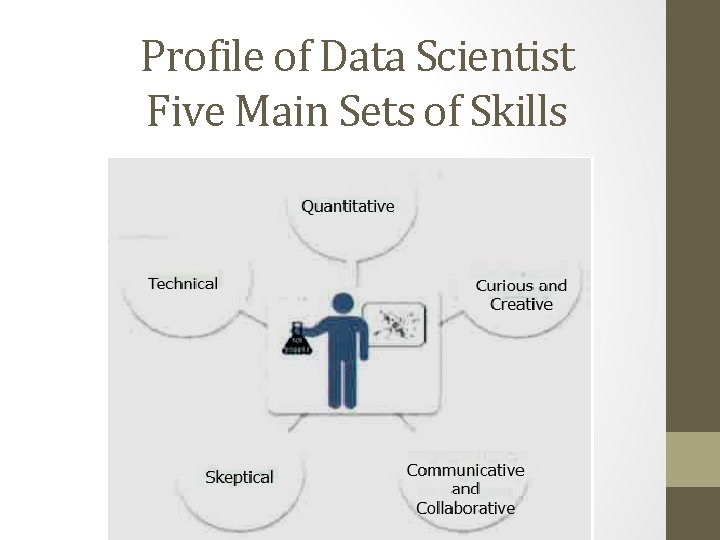
Profile of Data Scientist Five Main Sets of Skills
Profile of Data Scientist Five Main Sets of Skills • Quantitative skill – e. g. , math, statistics • Technical aptitude – e. g. , software engineering, programming • Skeptical mindset and critical thinking – ability to examine work critically • Curious and creative – passionate about data and finding creative solutions • Communicative and collaborative – can articulate ideas, can work with others
Examples of Big Data Analytics • Retailer Target • Uses life events: marriage, divorce, pregnancy • Apache Hadoop • Open source Big Data infrastructure innovation • Map. Reduce paradigm, ideal for many projects • Social Media Company Linked. In • Social network for working professionals • Can graph a user’s professional network • 250 million users in 2014
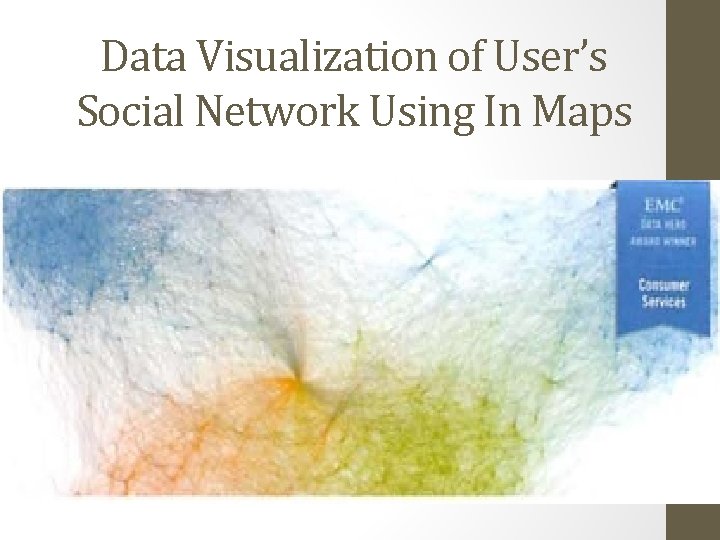
Data Visualization of User’s Social Network Using In Maps
Summary • Big Data comes from myriad(many) sources • Social media, sensors, Io. T, video surveillance, and sources only recently considered • Companies are finding creative and novel ways to use Big Data • Exploiting Big Data opportunities requires • New data architectures • New machine learning algorithms, ways of working • People with new skill sets
Exercise • 1. What are three characteristics of Big Data, and what are the main considerations in processing Big Data? • 2. What is an analytic sandbox, and why is it important? • 3. Explain the differences between BI and Data Science. • 4. Describe the challenges of the current analytical architecture for data scientists. • 5. What are the key skill sets and behavioral characteristics of a data scientist?
Data Analytics Lifecycle
Data Analytics Lifecycle • Data science projects differ from BI projects • More exploratory in nature • Critical to have a project process • Participants should be thorough and rigorous • Break large projects into smaller pieces • Spend time to plan and scope the work • Documenting adds rigor and credibility
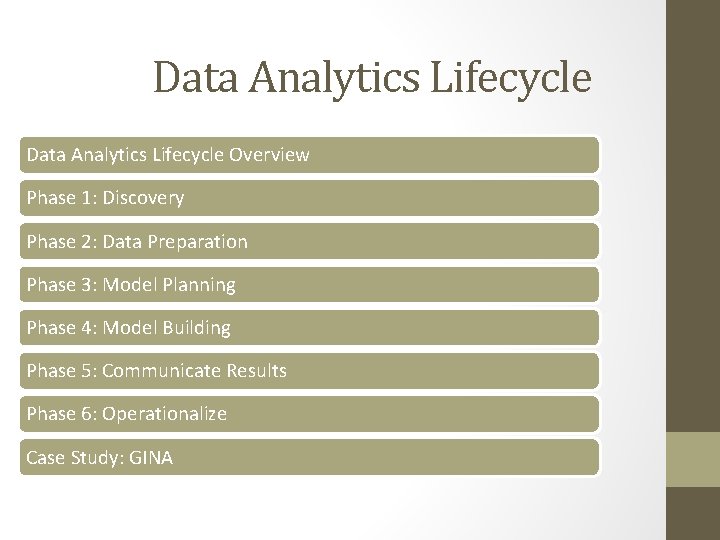
Data Analytics Lifecycle Overview Phase 1: Discovery Phase 2: Data Preparation Phase 3: Model Planning Phase 4: Model Building Phase 5: Communicate Results Phase 6: Operationalize Case Study: GINA
Data Analytics Lifecycle Overview • The data analytic lifecycle is designed for Big Data problems and data science projects • With six phases the project work can occur in several phases simultaneously • The cycle is iterative to portray a real project • Work can return to earlier phases as new information is uncovered
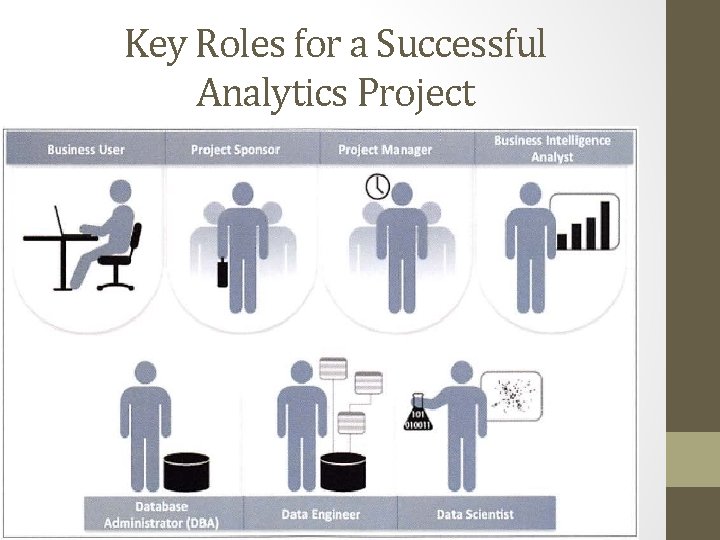
Key Roles for a Successful Analytics Project
Key Roles for a Successful Analytics Project Business User – understands the domain area Project Sponsor – provides requirements Project Manager – ensures meeting objectives Business Intelligence Analyst – provides business domain expertise based on deep understanding of the data • Database Administrator (DBA) – creates DB environment • Data Engineer – provides technical skills, assists data management and extraction, supports analytic sandbox • Data Scientist – provides analytic techniques and modeling • •
Background and Overview of Data Analytics Lifecycle • Data Analytics Lifecycle defines the analytics process and best practices from discovery to project completion • The Lifecycle employs aspects of • Scientific method • Cross Industry Standard Process for Data Mining (CRISP-DM) • Process model for data mining • Davenport’s DELTA framework • Hubbard’s Applied Information Economics (AIE) approach • MAD Skills: New Analysis Practices for Big Data by Cohen et al.
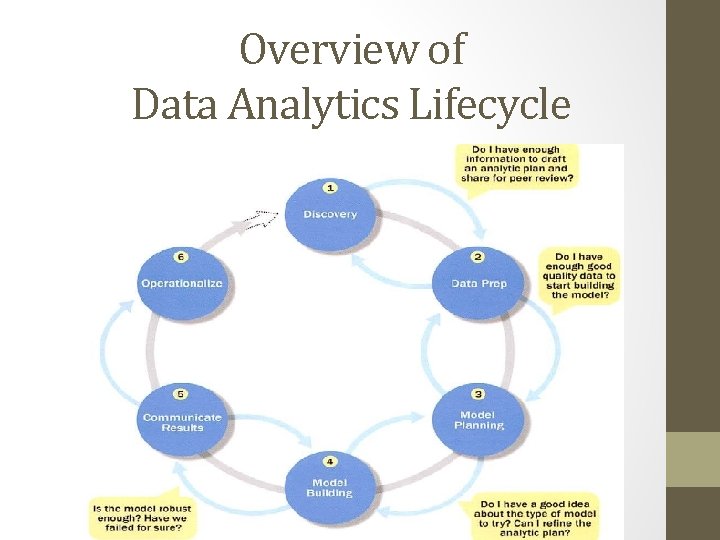
Overview of Data Analytics Lifecycle
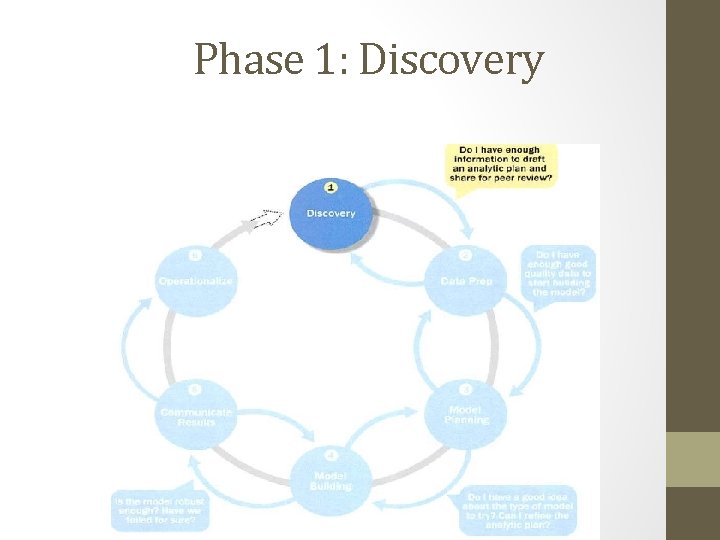
Phase 1: Discovery
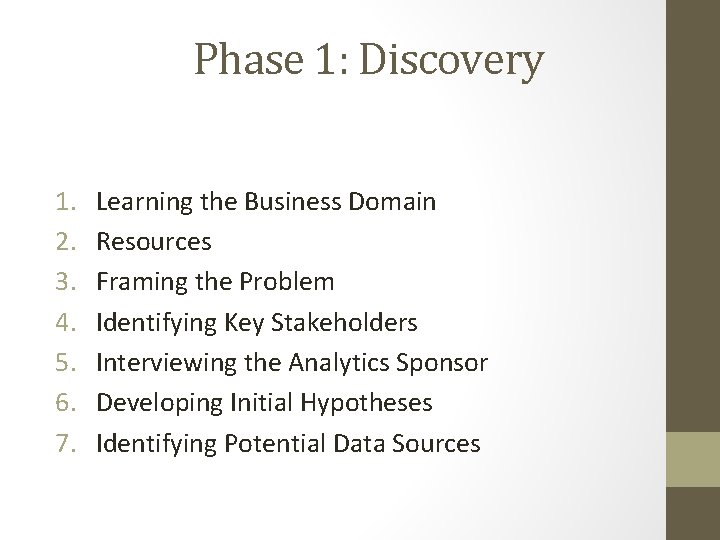
Phase 1: Discovery 1. 2. 3. 4. 5. 6. 7. Learning the Business Domain Resources Framing the Problem Identifying Key Stakeholders Interviewing the Analytics Sponsor Developing Initial Hypotheses Identifying Potential Data Sources
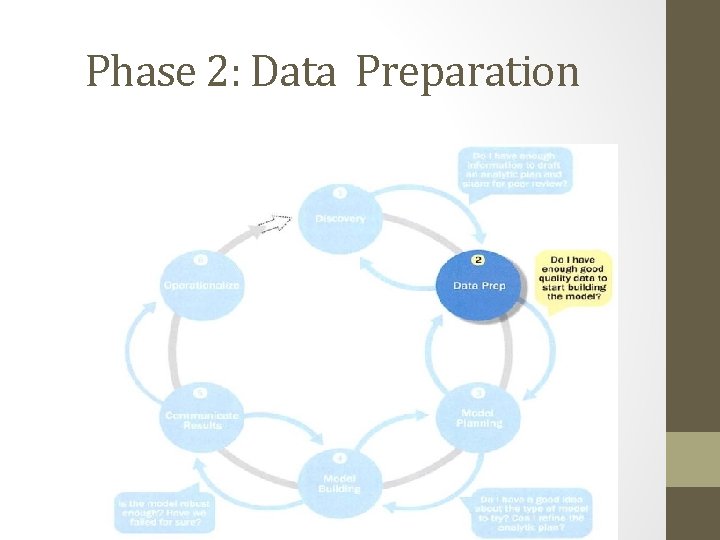
Phase 2: Data Preparation
Phase 2: Data Preparation • Includes steps to explore, preprocess, and condition data • Create robust environment – analytics sandbox • Data preparation tends to be the most laborintensive step in the analytics lifecycle • Often at least 50% of the data science project’s time • The data preparation phase is generally the most iterative and the one that teams tend to underestimate most often
Preparing the Analytic Sandbox • Create the analytic sandbox (also called workspace) • Allows team to explore data without interfering with live production data • Sandbox collects all kinds of data (expansive approach) • The sandbox allows organizations to undertake ambitious projects beyond traditional data analysis and BI to perform advanced predictive analytics • Although the concept of an analytics sandbox is relatively new, this concept has become acceptable to data science teams and IT groups
Performing ETLT (Extract, Transform, Load, Transform) • In ETL users perform extract, transform, load • In the sandbox the process is often ELT – early load preserves the raw data which can be useful to examine • Example – in credit card fraud detection, outliers can represent high-risk transactions that might be inadvertently filtered out or transformed before being loaded into the database
Learning about the Data • Becoming familiar with the data is critical • This activity accomplishes several goals: • Determines the data available to the team early in the project • Highlights gaps – identifies data not currently available • Identifies data outside the organization that might be useful
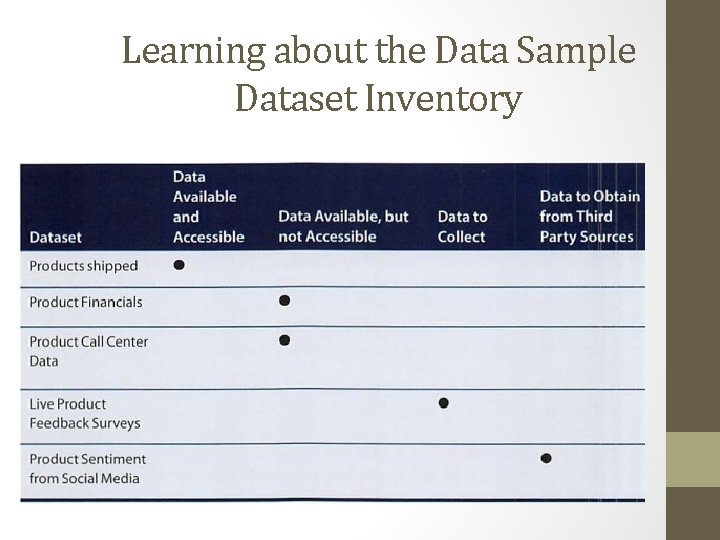
Learning about the Data Sample Dataset Inventory
Data Conditioning • Data conditioning includes cleaning data, normalizing datasets, and performing transformations • Often viewed as a preprocessing step prior to data analysis, it might be performed by data owner, IT department, DBA, etc. • Best to have data scientists involved • Data science teams prefer more data than too little
Data Conditioning • Additional questions and considerations • What are the data sources? Target fields? • How clean is the data? • How consistent are the contents and files? Missing or inconsistent values? • Assess the consistence of the data types – numeric, alphanumeric? • Review the contents to ensure the data makes sense • Look for evidence of systematic error
Survey and Visualize • Leverage data visualization tools to gain an overview of the data • Shneiderman’s mantra: • “Overview first, zoom and filter, then details-ondemand” • This enables the user to find areas of interest, zoom and filter to find more detailed information about a particular area, then find the detailed data in that area
Survey and Visualize Guidelines and Considerations • Review data to ensure calculations are consistent • Does the data distribution stay consistent? • Assess the granularity of the data, the range of values, and the level of aggregation of the data • Does the data represent the population of interest? • Check time-related variables – daily, weekly, monthly? Is this good enough? • Is the data standardized/normalized? Scales consistent? • For geospatial datasets, are state/country abbreviations consistent
Common Tools for Data Preparation • Hadoop can perform parallel ingest and analysis • Alpine Miner provides a graphical user interface for creating analytic workflows • Open. Refine (formerly Google Refine) is a free, open source tool for working with messy data • Similar to Open. Refine, Data Wrangler is an interactive tool for data cleansing an transformation
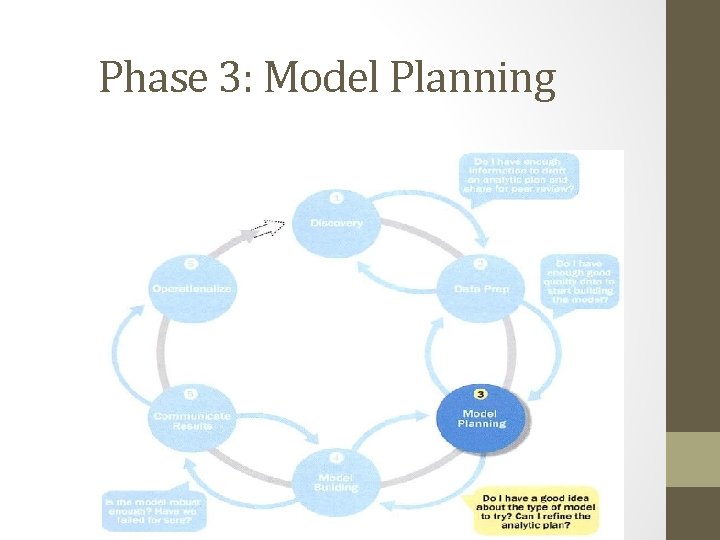
Phase 3: Model Planning
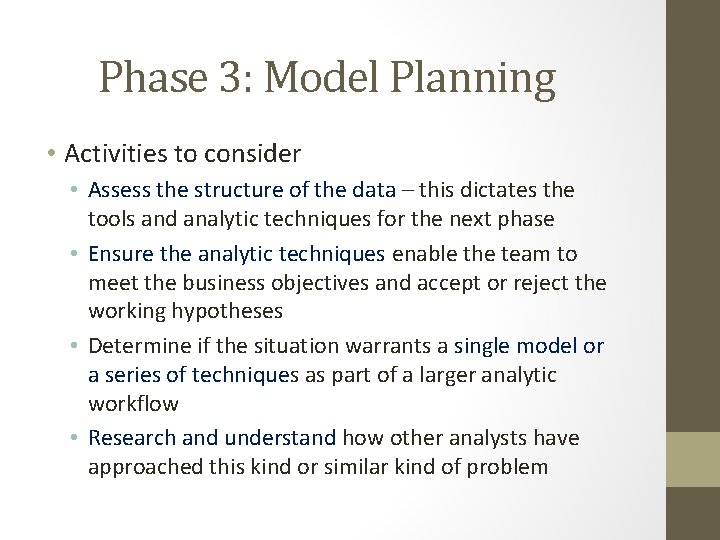
Phase 3: Model Planning • Activities to consider • Assess the structure of the data – this dictates the tools and analytic techniques for the next phase • Ensure the analytic techniques enable the team to meet the business objectives and accept or reject the working hypotheses • Determine if the situation warrants a single model or a series of techniques as part of a larger analytic workflow • Research and understand how other analysts have approached this kind or similar kind of problem
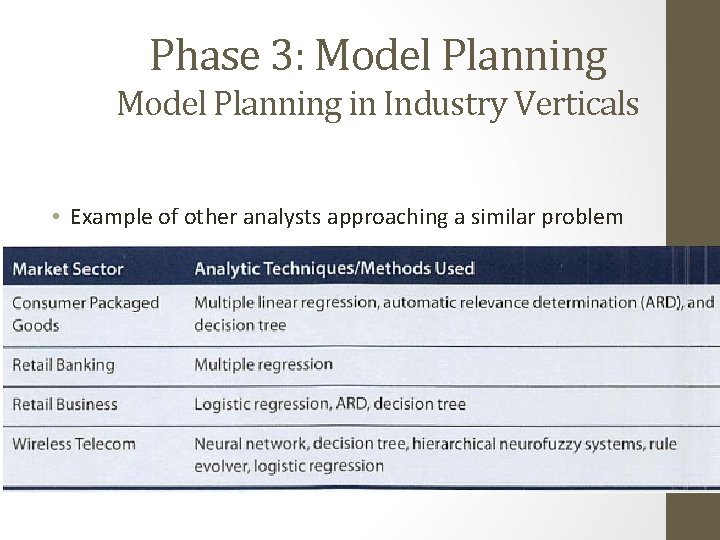
Phase 3: Model Planning in Industry Verticals • Example of other analysts approaching a similar problem
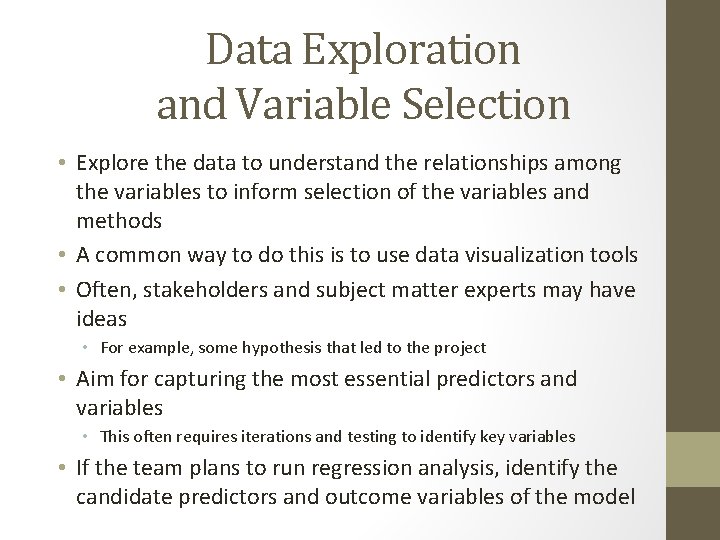
Data Exploration and Variable Selection • Explore the data to understand the relationships among the variables to inform selection of the variables and methods • A common way to do this is to use data visualization tools • Often, stakeholders and subject matter experts may have ideas • For example, some hypothesis that led to the project • Aim for capturing the most essential predictors and variables • This often requires iterations and testing to identify key variables • If the team plans to run regression analysis, identify the candidate predictors and outcome variables of the model
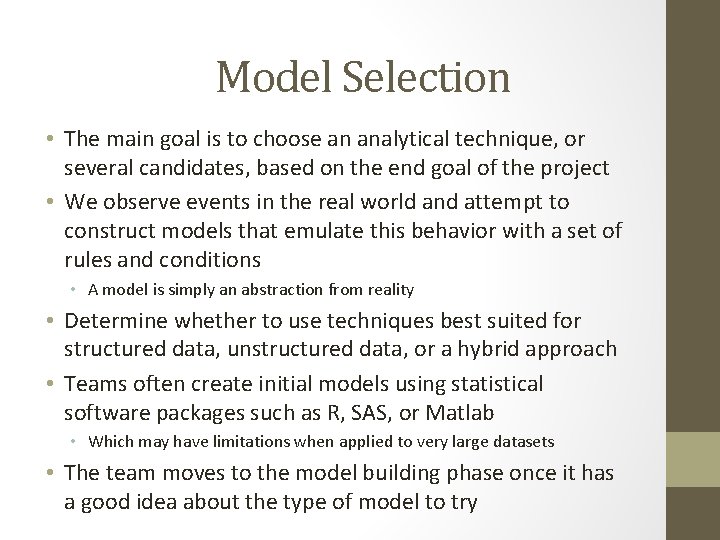
Model Selection • The main goal is to choose an analytical technique, or several candidates, based on the end goal of the project • We observe events in the real world and attempt to construct models that emulate this behavior with a set of rules and conditions • A model is simply an abstraction from reality • Determine whether to use techniques best suited for structured data, unstructured data, or a hybrid approach • Teams often create initial models using statistical software packages such as R, SAS, or Matlab • Which may have limitations when applied to very large datasets • The team moves to the model building phase once it has a good idea about the type of model to try
Common Tools for the Model Planning Phase • R has a complete set of modeling capabilities • R contains about 5000 packages for data analysis and graphical presentation • SQL Analysis services can perform in-database analytics of common data mining functions, involved aggregations, and basic predictive models • SAS/ACCESS provides integration between SAS and the analytics sandbox via multiple data connections
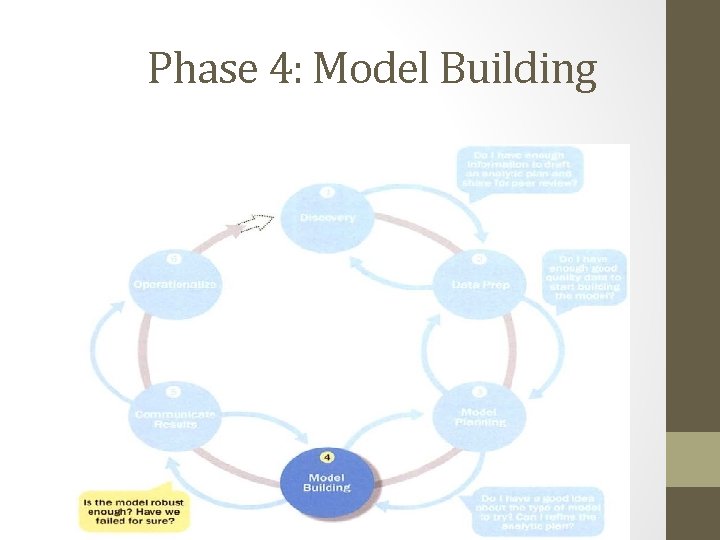
Phase 4: Model Building
Phase 4: Model Building • • Execute the models defined in Phase 3 Develop datasets for training, testing, and production Develop analytic model on training data, test on test data Question to consider • • Does the model appear valid and accurate on the test data? Does the model output/behavior make sense to the domain experts? Do the parameter values make sense in the context of the domain? Is the model sufficiently accurate to meet the goal? Does the model avoid intolerable mistakes? (see Chapters 3 and 7) Are more data or inputs needed? Will the kind of model chosen support the runtime environment? Is a different form of the model required to address the business problem?
Common Tools for the Model Building Phase • Commercial Tools • SAS Enterprise Miner – built for enterprise-level computing and analytics • SPSS Modeler (IBM) – provides enterprise-level computing and analytics • Matlab – high-level language for data analytics, algorithms, data exploration • Alpine Miner – provides GUI frontend for backend analytics tools • STATISTICA and MATHEMATICA – popular data mining and analytics tools • Free or Open Source Tools • • • R and PL/R - PL/R is a procedural language for Postgre. SQL with R Octave – language for computational modeling WEKA – data mining software package with analytic workbench Python – language providing toolkits for machine learning and analysis SQL – in-database implementations provide an alternative tool
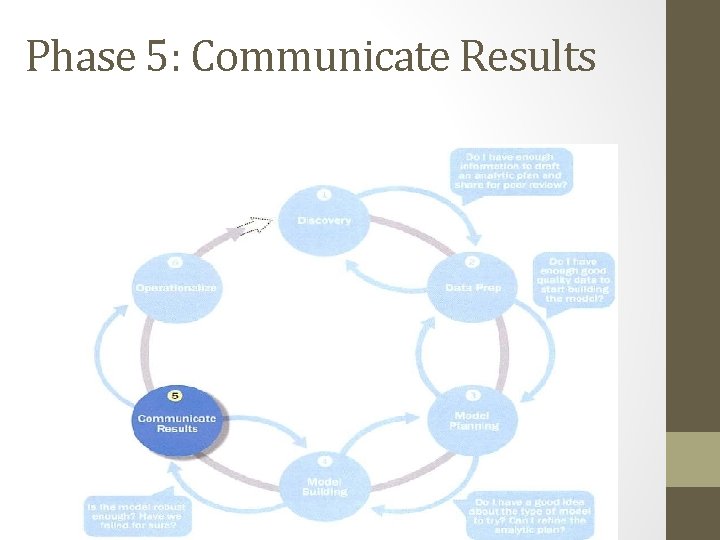
Phase 5: Communicate Results
Phase 5: Communicate Results • Determine if the team succeeded or failed in its objectives • Assess if the results are statistically significant and valid • If so, identify aspects of the results that present salient findings • Identify surprising results and those in line with the hypotheses • Communicate and document the key findings and major insights derived from the analysis • This is the most visible portion of the process to the outside stakeholders and sponsors
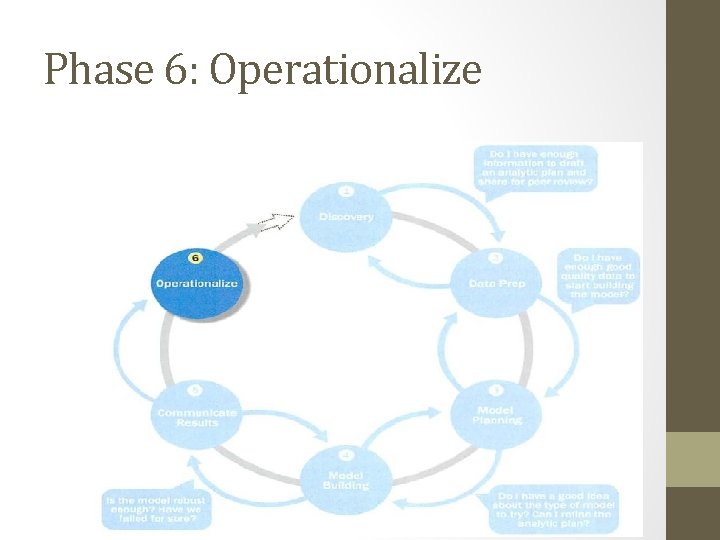
Phase 6: Operationalize
Phase 6: Operationalize • In this last phase, the team communicates the benefits of the project more broadly and sets up a pilot project to deploy the work in a controlled way • Risk is managed effectively by undertaking small scope, pilot deployment before a wide-scale rollout • During the pilot project, the team may need to execute the algorithm more efficiently in the database rather than with inmemory tools like R, especially with larger datasets • To test the model in a live setting, consider running the model in a production environment for a discrete set of products or a single line of business • Monitor model accuracy and retrain the model if necessary
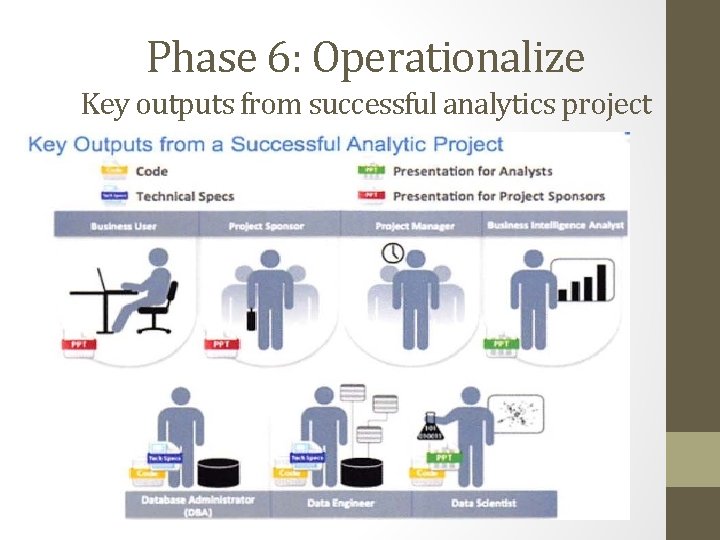
Phase 6: Operationalize Key outputs from successful analytics project
Phase 6: Operationalize Key outputs from successful analytics project • Business user – tries to determine business benefits and implications • Project sponsor – wants business impact, risks, ROI • Project manager – needs to determine if project completed on time, within budget, goals met • Business intelligence analyst – needs to know if reports and dashboards will be impacted and need to change • Data engineer and DBA – must share code and document • Data scientist – must share code and explain model to peers, managers, stakeholders
Phase 6: Operationalize Four main deliverables • Although the seven roles represent many interests, the interests overlap and can be met with four main deliverables 1. Presentation for project sponsors – high-level takeaways for executive level stakeholders 2. Presentation for analysts – describes business process changes and reporting changes, includes details and technical graphs 3. Code for technical people 4. Technical specifications of implementing the code
Case Study: Global Innovation Network and Analysis (GINA) • In 2012 EMC’s new director wanted to improve the company’s engagement of employees across the global centers of excellence (GCE) to drive innovation, research, and university partnerships • This project was created to accomplish • Store formal and informal data • Track research from global technologists • Mine the data for patterns and insights to improve the team’s operations and strategy
Phase 1: Discovery • Team members and roles • Business user, project sponsor, project manager – Vice President from Office of CTO • BI analyst – person from IT • Data engineer and DBA – people from IT • Data scientist – distinguished engineer
Phase 1: Discovery • The data fell into two categories • Five years of idea submissions from internal innovation contests • Minutes and notes representing innovation and research activity from around the world • Hypotheses grouped into two categories • Descriptive analytics of what is happening to spark further creativity, collaboration, and asset generation • Predictive analytics to advise executive management of where it should be investing in the future
Phase 2: Data Preparation • Set up an analytics sandbox • Discovered that certain data needed conditioning and normalization and that missing datasets were critical • Team recognized that poor quality data could impact subsequent steps • They discovered many names were misspelled and problems with extra spaces • These seemingly small problems had to be addressed
Phase 3: Model Planning • The study included the following considerations • Identify the right milestones to achieve the goals • Trace how people move ideas from each milestone toward the goal • Tract ideas that die and others that reach the goal • Compare times and outcomes using a few different methods
Phase 4: Model Building • Several analytic method were employed • NLP on textual descriptions • Social network analysis using R and Rstudio • Developed social graphs and visualizations
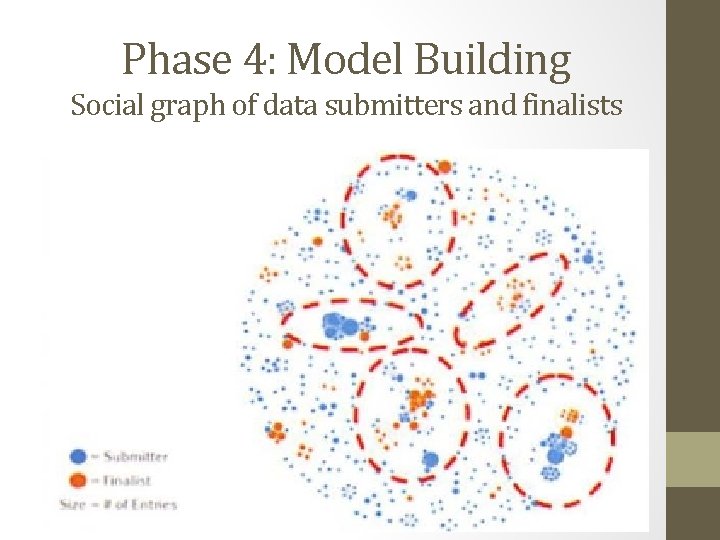
Phase 4: Model Building Social graph of data submitters and finalists
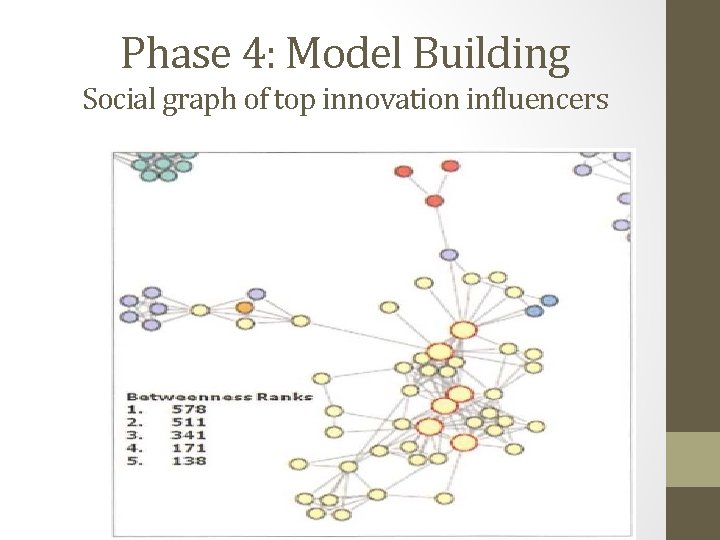
Phase 4: Model Building Social graph of top innovation influencers
Communicate Results • Study was successful in in identifying hidden innovators • Found high density of innovators in Cork, Ireland • The CTO office launched longitudinal studies
Operationalize • Deployment was not really discussed • Key findings • Need more data in future • Some data were sensitive • A parallel initiative needs to be created to improve basic BI activities • A mechanism is needed to continually reevaluate the model after deployment
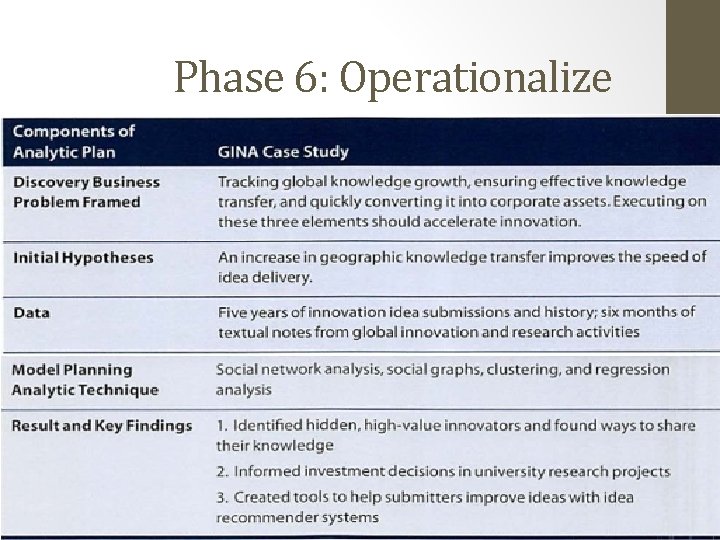
Phase 6: Operationalize
Summary • The Data Analytics Lifecycle is an approach to managing and executing analytic projects • Lifecycle has six phases • Bulk of the time usually spent on preparation – phases 1 and 2 • Seven roles needed for a data science team • Review the exercises
References • http: //www. csis. pace. edu/~ctappert/cs 816 -15 fall/slides/ • https: //norcalbiostat. github. io/ADS/notes/Data%20 Analytics%20 Lifecycle%2 0 -%20 EH 1. pdf • http: //srmnotes. weebly. com/it 1110 -data-science--big-data. html • http: //www. csis. pace. edu/~ctappert/cs 81615 fall/books/2015 Data. Science&Big. Data. Analytics. pdf
- Slides: 86