
Data Analytics at American Electric Power Presentation to
- Slides: 18
Data Analytics at American Electric Power Presentation to: SWEDE May 8, 2014 Tom Weaver, PE
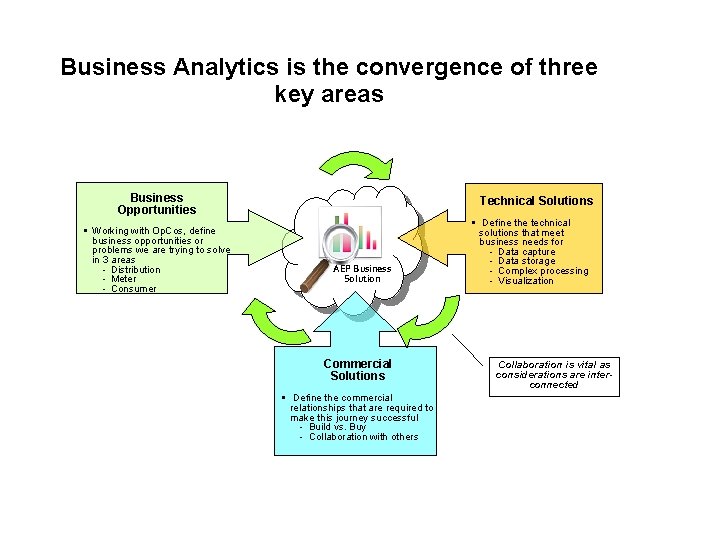
Business Analytics is the convergence of three key areas Business Opportunities § Working with Op. Cos, define business opportunities or problems we are trying to solve in 3 areas ‐ Distribution ‐ Meter ‐ Consumer Technical Solutions AEP Business Solution Commercial Solutions § Define the commercial relationships that are required to make this journey successful ‐ Build vs. Buy ‐ Collaboration with others § Define the technical solutions that meet business needs for ‐ Data capture ‐ Data storage ‐ Complex processing ‐ Visualization Collaboration is vital as considerations are interconnected
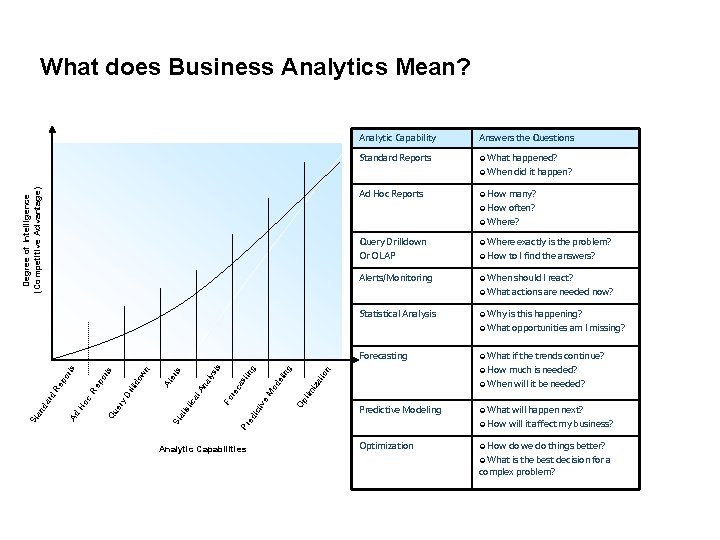
What does Business Analytics Mean? Analytic Capability Answers the Questions Standard Reports ¢ What happened? ¢ When did it happen? Degree of Intelligence (Competitive Advantage) Ad Hoc Reports ¢ How many? ¢ How often? ¢ Where? Query Drilldown Or OLAP ¢ Where exactly is the problem? Alerts/Monitoring ¢ When should I react? ¢ How to I find the answers? ¢ What actions are needed now? Statistical Analysis ¢ Why is this happening? ¢ What opportunities am I missing? n tio tim Op e. M od tiv dic ¢ When will it be needed? Predictive Modeling ¢ What will happen next? ¢ How will it affect my business? Pr e Analytic Capabilities ¢ What if the trends continue? ¢ How much is needed? iza eli sti ca re Fo na l. A ica ist ng ng is lys ts Al er St at wn do rill y. D er Qu Re oc Ad H St an da rd Re po po rts Forecasting Optimization ¢ How do we do things better? ¢ What is the best decision for a complex problem?
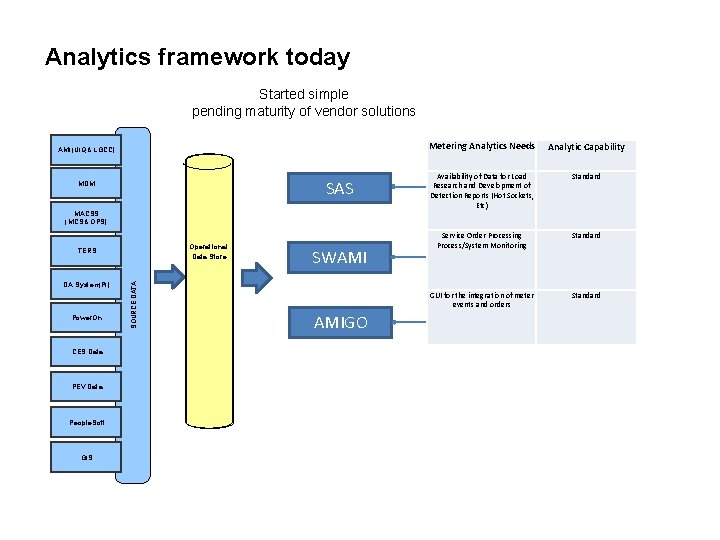
Analytics framework today – Conceptual View Started simple pending maturity of vendor solutions OPERATIONAL AMI (UIQ & LGCC) SAS MDM Metering Analytics Needs Analytic Capability Availability of Data for Load Research and Development of Detection Reports (Hot Sockets, Etc) Standard Service Order Processing Process/System Monitoring Standard GUI for the integration of meter events and orders Standard MACSS (MCS& OPS) Operational Data Store DA System(PI) Power. On CES Data PEV Data People. Soft GIS SOURCE DATA TERS SWAMI AMIGO
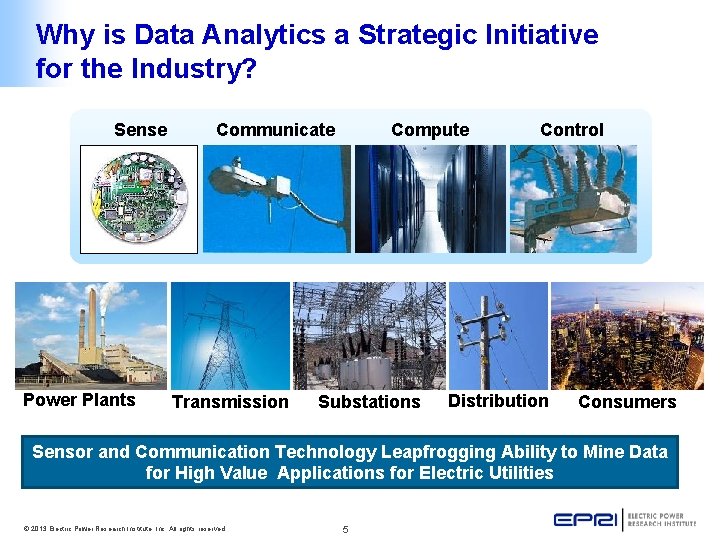
Why is Data Analytics a Strategic Initiative for the Industry? Sense Power Plants Communicate Transmission Compute Substations Control Distribution Consumers Sensor and Communication Technology Leapfrogging Ability to Mine Data for High Value Applications for Electric Utilities © 2013 Electric Power Research Institute, Inc. All rights reserved. 5
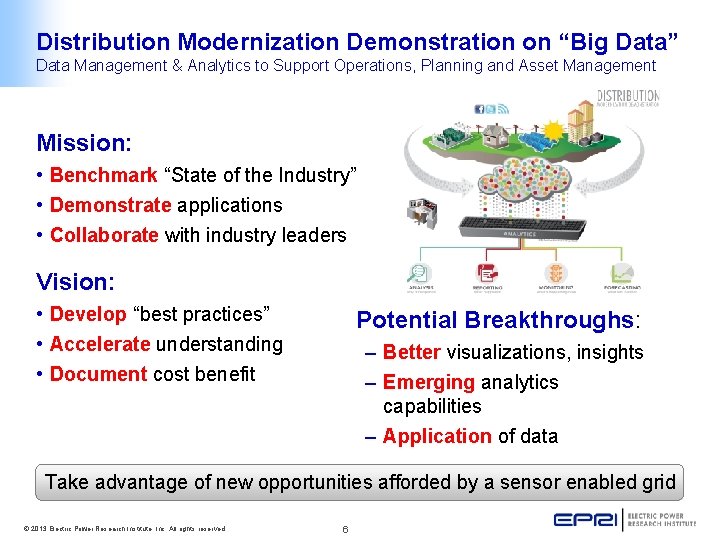
Distribution Modernization Demonstration on “Big Data” Data Management & Analytics to Support Operations, Planning and Asset Management Mission: • Benchmark “State of the Industry” • Demonstrate applications • Collaborate with industry leaders Vision: • Develop “best practices” • Accelerate understanding • Document cost benefit Potential Breakthroughs: – Better visualizations, insights – Emerging analytics capabilities – Application of data Take advantage of new opportunities afforded by a sensor enabled grid © 2013 Electric Power Research Institute, Inc. All rights reserved. 6
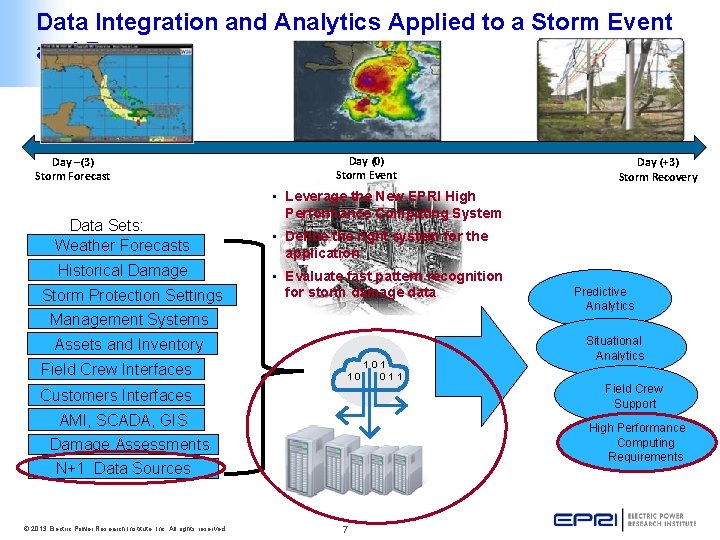
Data Integration and Analytics Applied to a Storm Event and Recovery Day –(3) Storm Forecast Data Sets: Weather Forecasts Historical Damage Storm Protection Settings Day (0) Storm Event • Leverage the New EPRI High Performance Computing System • Define the right system for the application • Evaluate fast pattern recognition for storm damage data Management Systems Assets and Inventory Field Crew Interfaces 10 Customers Interfaces AMI, SCADA, GIS 101 011 Predictive Analytics Situational Analytics Field Crew Support High Performance Computing Requirements Damage Assessments N+1 Data Sources © 2013 Electric Power Research Institute, Inc. All rights reserved. Day (+3) Storm Recovery 7
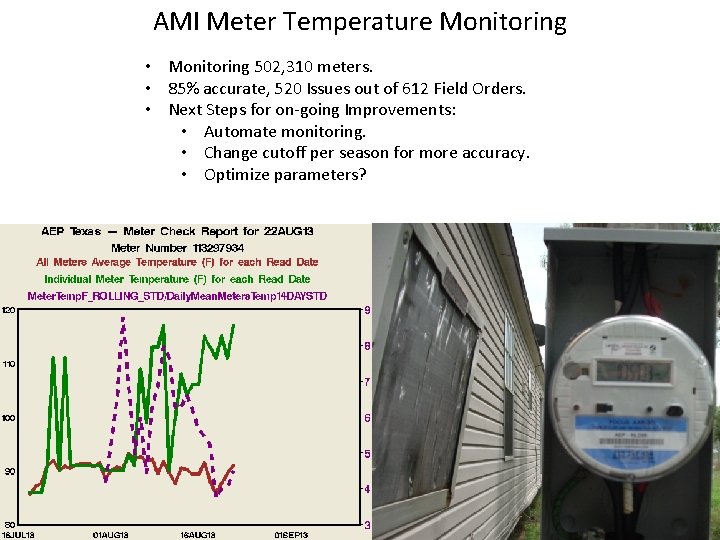
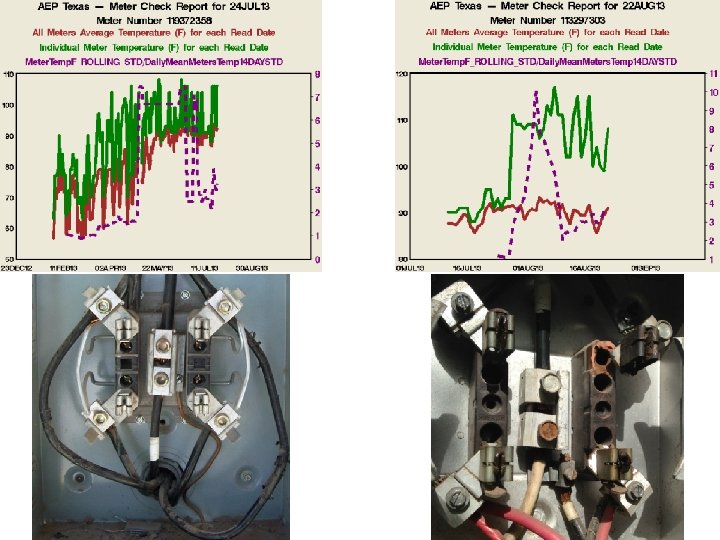
AMI Meter Temperature Monitoring • Monitoring 502, 310 meters. • 85% accurate, 520 Issues out of 612 Field Orders. • Next Steps for on-going Improvements: • Automate monitoring. • Change cutoff per season for more accuracy. • Optimize parameters?
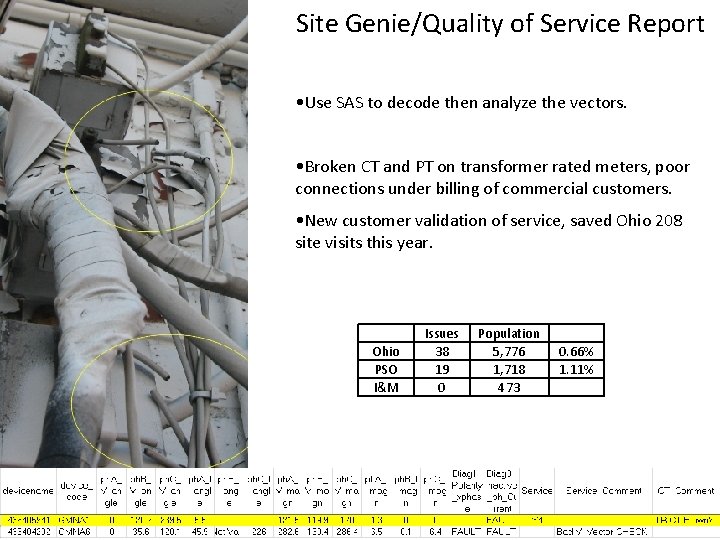
Site Genie/Quality of Service Report • Use SAS to decode then analyze the vectors. • Broken CT and PT on transformer rated meters, poor connections under billing of commercial customers. • New customer validation of service, saved Ohio 208 site visits this year. Ohio PSO I&M Issues 38 19 0 Population 5, 776 1, 718 473 0. 66% 1. 11%
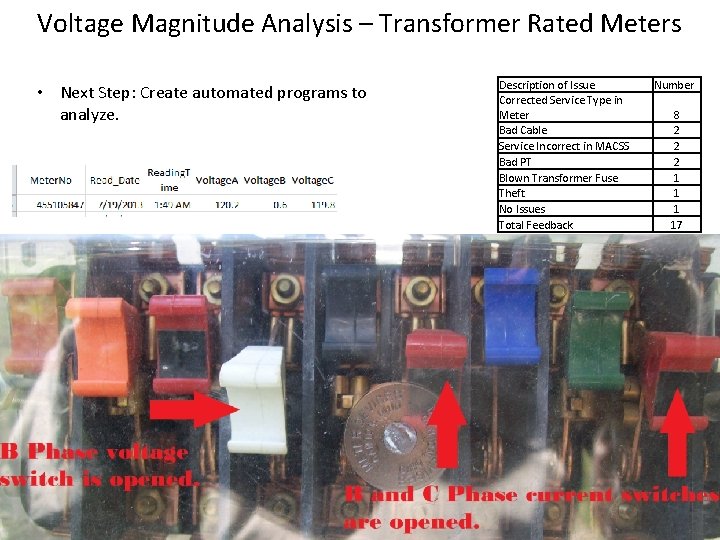
Voltage Magnitude Analysis – Transformer Rated Meters • Next Step: Create automated programs to analyze. Description of Issue Corrected Service Type in Meter Bad Cable Service Incorrect in MACSS Bad PT Blown Transformer Fuse Theft No Issues Total Feedback Number 8 2 2 2 1 17
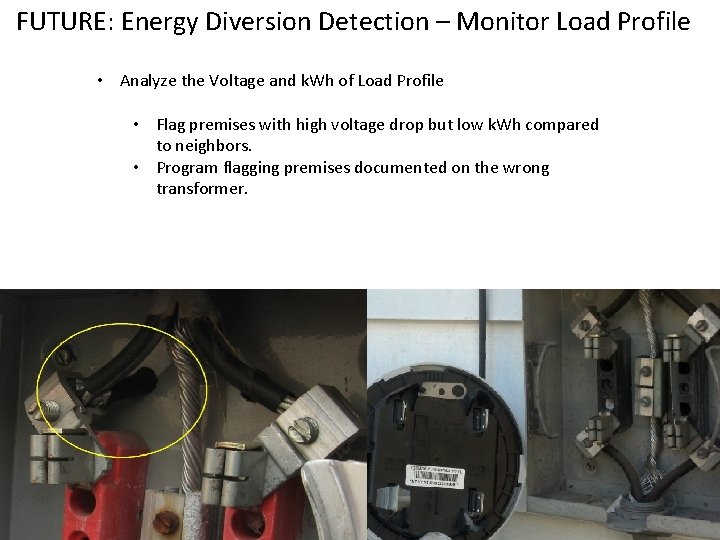
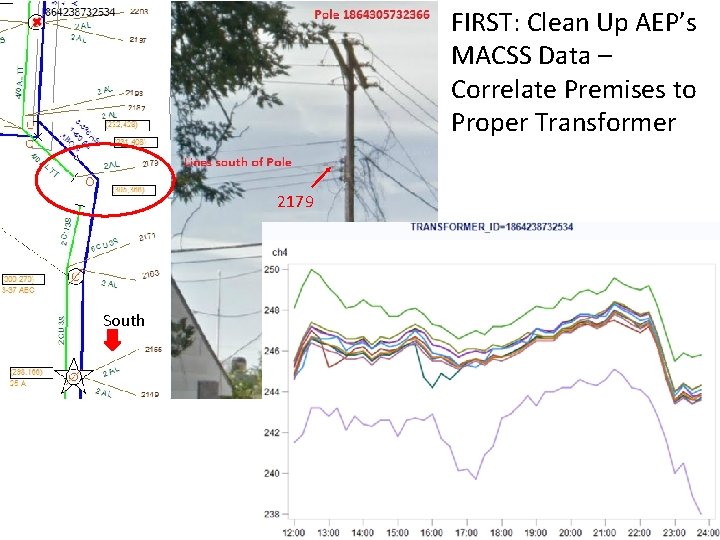
FUTURE: Energy Diversion Detection – Monitor Load Profile • Analyze the Voltage and k. Wh of Load Profile • Flag premises with high voltage drop but low k. Wh compared to neighbors. • Program flagging premises documented on the wrong transformer.
FIRST: Clean Up AEP’s MACSS Data – Correlate Premises to Proper Transformer 2179 South
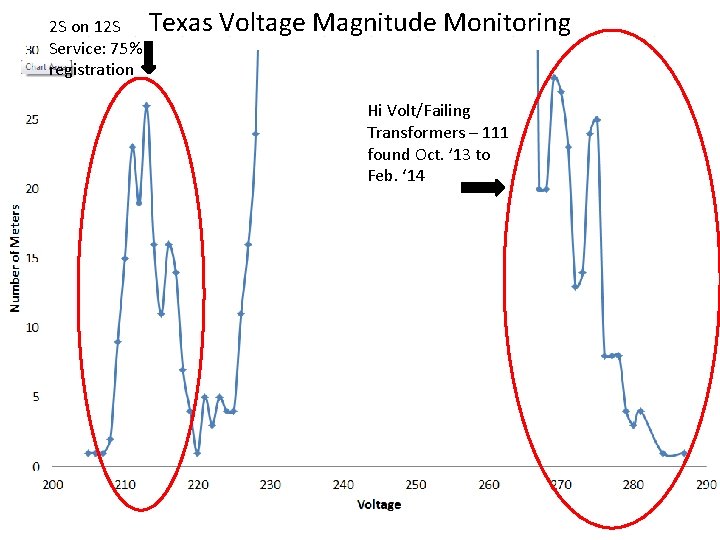
2 S on 12 S Service: 75% registration Texas Voltage Magnitude Monitoring Hi Volt/Failing Transformers – 111 found Oct. ’ 13 to Feb. ‘ 14
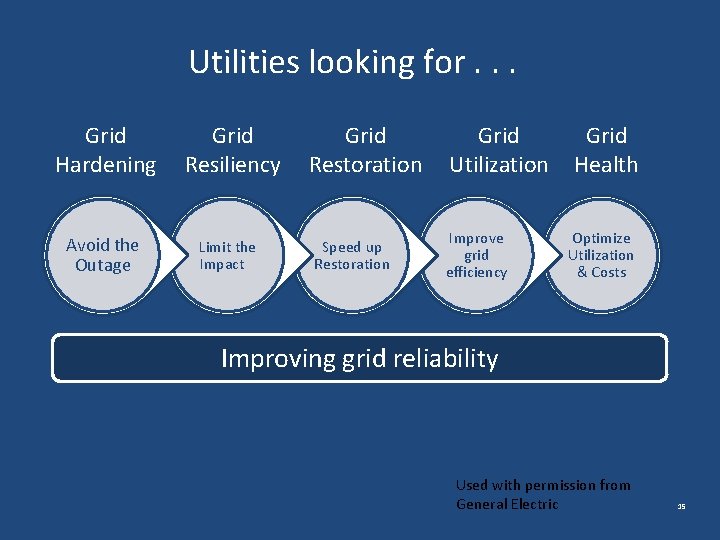
Utilities looking for. . . Grid Hardening Avoid the Outage Grid Resiliency Limit the Impact Grid Restoration Speed up Restoration Grid Utilization Improve grid efficiency Grid Health Optimize Utilization & Costs Improving grid reliability Used with permission from General Electric 15
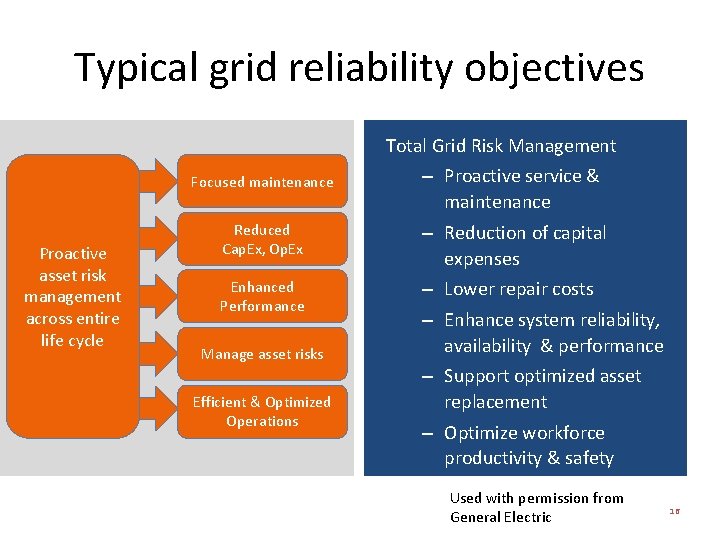
Typical grid reliability objectives Total Grid Risk Management Focused maintenance Proactive asset risk management across entire life cycle Reduced Cap. Ex, Op. Ex Enhanced Performance Manage asset risks Efficient & Optimized Operations – Proactive service & maintenance – Reduction of capital expenses – Lower repair costs – Enhance system reliability, availability & performance – Support optimized asset replacement – Optimize workforce productivity & safety • Used with permission from General Electric • General Electric 16
AEP Distribution Analytics Currently planning • Load analytics • Vegetation management • Convert sensor data to actionable steps Future Plans • Automating reliability metrics • Tying asset age and health to outage trends • Storm damage prediction
Questions? Tom Weaver – tfweaver@aep. com 18