Data Analysis Nirvana Excel 2013 Business Intelligence Features

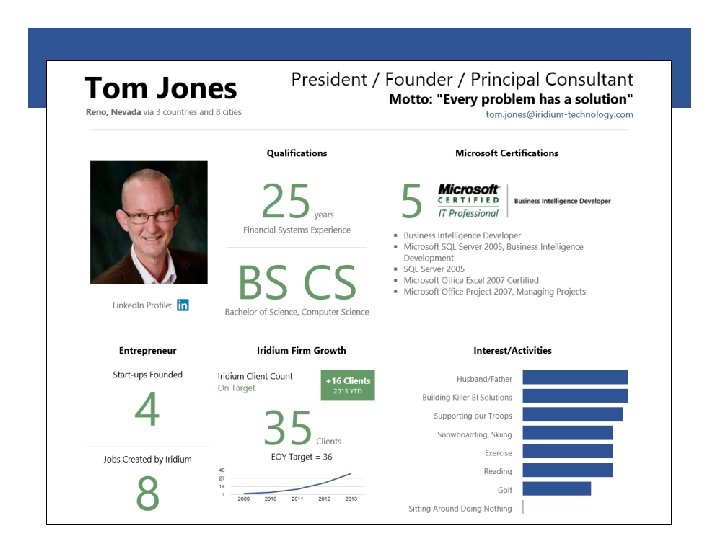
Data Analysis Nirvana: Excel 2013 Business Intelligence Features Tom Jones – President, Iridium Technology LLC

Introduction – Iridium Technology • “Business Intelligence for Law Firms. Period. ” • Founded in 2009 • 8 -member team 100% focused on legal BI § BI solutions for ADERANT and ELITE clients § Tuning of existing BI solutions § Custom dashboards/reports • 35 clients in all regions • Client firm size 85 – 2300 timekeepers

Agenda • Part 1 § Mini-Demos: slicers, timelines, tables, Quick Explore, etc. § Ad-hoc querying of cubes § Publishing your results through dashboards § “Grab Bag” topics § Calculated member and dimensions ** § Pivot table tips and tricks • Part 2 (? ) § Internal Data Model § Power. Pivot § Power. View (including MDX Designer) § Dashboarding with Power. View Business Intelligence for Law Firms. Period. © 2013 Iridium Technology LLC

References • Google “Excel 2013 BI features”

Become Microsoft Office Certified Business Intelligence for Law Firms. Period. © 2013 Iridium Technology LLC

Cool Features – Mini Demos

Quick Analysis • Quick Analysis tool lets you convert your data into a chart or table in two steps or less. You can preview the data and make your choice in one click. • You can instantly create different types of charts, including line and column charts, or add miniature graphs (called spark lines). • You can also apply a table style, create Pivot. Tables, quickly insert totals, and apply conditional formatting. • Everything performed by Quick Analysis can be done manually Mini-Demo
 • My favorite feature that not enough people use • A Table")
Tables (2010/2013) • My favorite feature that not enough people use • A Table is not a Pivot Table • Features § Total Row § Formulas applied to columns § Styles § Data Validation § Conditional Formatting § Tab to insert • (Table Tools, Convert to Range to remove table) Mini-Demo
 Turning Off GETPIVOTDATA() • GETPIVOTDATA() function is § Awkward § Misleading Mini-Demo")
(Digression) Turning Off GETPIVOTDATA() • GETPIVOTDATA() function is § Awkward § Misleading Mini-Demo

Slicers • Previously slicers were only available for Pivot. Table data • Now slicers can also filter data in Excel tables, query tables, and other data tables • Slicers show the current filter so you’ll know exactly what data you’re looking at Mini-Demo

Timeline • A timeline makes it simpler to compare your Pivot. Table or Pivot. Chart data over different time periods • It's more visual and intuitive than the traditional filter • There must be a DATE format column Mini-Demo

Charts Made Easier • Formatting, picking and previewing changes to chart elements are quicker and easier • With Chart Recommendations, Excel will recommend the most suitable charts with for data with previews Mini-Demo
 • Improved toolset")
Trendlines • Another cool feature that not enough people use (2010/2013) • Improved toolset (tool pane) in 2013 Mini-Demo

Quick Explore: Drill into Pivot. Table Data • Quick Explore feature lets you drill into your Online Analytical Processing (OLAP) cube or Data Model-based Pivot. Table hierarchy to analyze data details on different levels. • I admit it… • This is the one new feature that I didn’t do much for me Mini-Demo (Next Time)

Let’s Talk about Cubes

No Cubes? Then you Don’t Have BI • What is a cube? • Data storage optimized for querying and reporting § Microsoft SQL Server component “SSAS” § Topic specific: GL, Salary, Profitability, etc. • What can it do for me? § Ad-hoc query capabilities § Data source for dashboards § Data source for firm-wide reporting Business Intelligence for Law Firms. Period. © 2013 Iridium Technology LLC

Ad-hoc Querying with SSAS Cubes • Excel is Iridium’s preferred query tool for working with SSAS Cubes • Excel 2013 offers tighter integration with SQL Server • We strongly encourage our clients to use Excel 2013 Demo: Ad-hoc querying in Excel

Training: “QOTD” Program • QOTD is part of Iridium’s training curriculum • 23 lessons to get our clients to “expert” level in analysis • Focused on working with pivot tables connected to a cube

Cubes and Dashboards • Cubes are a great source for dashboards • 2 second average screen refresh • You have a choice of tools: § Excel Services / Share. Point § SSRS Demo: Cube-based Dashboards Business Intelligence for Law Firms. Period. © 2013 Iridium Technology LLC

Oh, and one more thing…

Oh, and one more thing… “Desktop Dashboards”

What About Excel Services? • Excel is a great mockup tool and great for personal analysis, but what next? • Excel Services is a server technology included in Share. Point 2010 and Share. Point 2007. This shared service enables users to load, calculate, and display Excel 2010 workbooks on Microsoft Office Share. Point Server 2010. • Using Excel Services, users can reuse and share Excel workbooks on Microsoft Office Share. Point Server 2010 portals and dashboards. The entire workbook or just parts of it (such as just a single sheet, chart or table) can be shared. • End-users can view live, interactive workbooks using only a web browser. Business Intelligence for Law Firms. Period. © 2013 Iridium Technology LLC

Grab Bag Topics Business Intelligence for Law Firms. Period. © 2013 Iridium Technology LLC

Pet Peeve #1: Poor Cube Navigation in Excel 2010 SQL Server Mgmt Studio Excel 2013 (Partially Fixed)

Pet Peeve #2: ‘Not all items showing’ error when filtering over 10, 000 rows of data • Not fixed in Excel 2013 • Workaround exists (filtering)

Pet Peeve #3: Lack of Cascading Filters • You filter on FY 2010… • So why are 2005 FY periods offered? • Not fixed in Excel 2013 • “Workaround” exists

Pet Peeve #4: Slow Filtering Large Dimensions • With large dimensions, “Keep Only Selected Items” is very slow • Fixed in Excel 2013! • This one feature is worth upgrading for if you are a power user
 Business laptops §")
Got Kids? Office 365 Home • The Jones home: § (2) Business laptops § (1) Personal Windows laptop § (2) Mac. Books for the boys

Calculated Measures and Dimensions

Calculated Measures and Dimensions • New in Excel 2013 • Allows ad-hoc Measure and Dimension creation • Calculations inside Pivot. Table – no more references to data in a Pivot. Table that must be modified after every change in the Report!

Creating a Calculated Measure • The function is located in OLAP Tools:
 • Point-click-and-drag – No MDX Knowledge Required!")
Creating a Calculated Measure (cont. ) • Point-click-and-drag – No MDX Knowledge Required!

Creating a Calculated Dimension • Much the same as creating a Calculated Measure • However, more complicated – hierarchies, individual member manipulation • But still click-and-drag! • Huge step forward from Excel 2010

Pivot. Table Tips, Tricks, and Techniques

Expand All + Collapse All • New function in Excel 2013 • Very useful when building out a Pivot. Table

Deferring Layout • “Don’t send me data until I finish telling you what data I need!” • Lessens the amount of data transferred • No more waiting on data to be returned after every little change to the Pivot. Table

Refresh on Open and Actions on Refresh • Refresh on Open: Get updated data from the data source whenever the workbook is opened § Great for Excel-based Reports • Actions on Refresh § Preserve Formatting § Auto-fit Column Widths (no more cutoffs)

Manual Sorting • Not all data fits into Excel’s sorting Paradigm • Sort small data sets manually to present the data in the most useful way

Filter Early • Filter early to cut down on server load, data transfer times, and wait times. • Filter to a subset of the data you’ll eventually need when building the Report § Same benefits plus you can build out the Pivot. Table faster § Once the Pivot. Table is complete, remove any unnecessary Report Filters and retrieve the data once.

Part 2? • Internal Data Model • Power. Pivot • Power. View (including MDX Designer) • Dashboarding with Power. View Business Intelligence for Law Firms. Period. © 2013 Iridium Technology LLC
- Slides: 41