Data Analysis for Experimental Design Method Section Data

 Sample Design")


 n n Sensitivity n ceiling effect - too easy n")


 n Approaches for Dealing with Missing Data n n Use")

 n Ordinal n Interval n Ratio")


 1. 2. 3. 4. 5. 6. If I")
 1. 2. 3. 4. 5. I encourage friends and relatives to do")


")


 Determines if mean group scores are far apart relative to")


 Conceptually, ANOVA compares: difference among means/uncertainty OR n explained variance/unexplained")
 n F-test n n n The larger F-value, the better")
")
 The statistical test of significance is based on the")


 n Scale attenuation effects n n floor and ceiling effects")
 n Interpreting non-significant results n n n poor design poor")
- Slides: 60
Data Analysis for Experimental Design Method Section & Data Analysis
Components of the Research Method of Experimental Design n n Method (Overview) Sample Design and experimental stimuli (manipulations) Pre-manipulation and post-manipulation measures Administration procedure
Independent Variables n n Setting the stage n informed consent n brief explanation of what is expected Types of manipulations n straightforward n staged n to create a psychological state n to simulate a real world situation n use confederates
Dependent Measures n Types of measures n self-report n rating scales n behavioral n reaction time n error rate n physiological n GSR, heart rate
Dependent Measures (cont. ) n n Sensitivity n ceiling effect - too easy n floor effect - too hard n no effect Multiple Measures n e. g. time perception n Ethics of measures (e. g. privacy) n Cost
Data Defects n n n Missing data n some statistics allow for missing data n can replace with averaging techniques n SPSS have several missing data options Extreme score or outliers n techniques for discarding n replace with averaging Appropriate Statistics!!!!!!!!!
Missing Data n n A Simple Example of a Missing Data Analysis Understanding the Reasons Leading to Missing Data n n Ignorable Missing Data Other Types of Missing Data Processes Examining the Patterns of Missing Data Diagnosing the Randomness of the Missing Data Process
Missing Data (Cont. ) n Approaches for Dealing with Missing Data n n Use of Only Observations with Complete Data Delete Case(s) and/or Variable(s)
Outliers n Detecting Outliers n n n Univariate Detection Bivariate Detection Outlier Designation Outlier Description and Profiling Retention or Deletion of the Outlier
Measurement Scales n Nominal (categorical) n Ordinal n Interval n Ratio
Nominal Scales n n Mutually exclusive categories Labels only, no arithmetic properties Examples: Sex, location, marital status Statistical operations: Mode, frequencies, crosstabs
Ordinal Scales n n n Implies more or less, but not how much more or less Can use median or mode, but not average Crosstabs
Interval/Ratio Scales n n n Numbers in scale represent equal increments Scales have the most desirable statistical properties (The ratio scale is an interval scale with a fixed zero point, e. g. age and temperature)
The Multiple Choice Question n n Simple, versatile Single or multiple response No more than 8 -10 so categories Mutually exclusive categories Pre-testing should show labeled alternatives cover 90% of answers
Single Response, Multiple Choice Questions n n Choice criterion must be clearly stated Choice criterion must define a single answer
Forced Ranking Scales
Forced Ranking Scales n n Options judged relative to one another Mimics actual decision making Disadvantage: interval between items not measured Limited number of items can be ranked
Guidelines for Using Forced Ranking Scales n n 10 Items or less Relative standing is focus Use single judgment criterion Analysis confined to frequencies, special procedures for ranked data
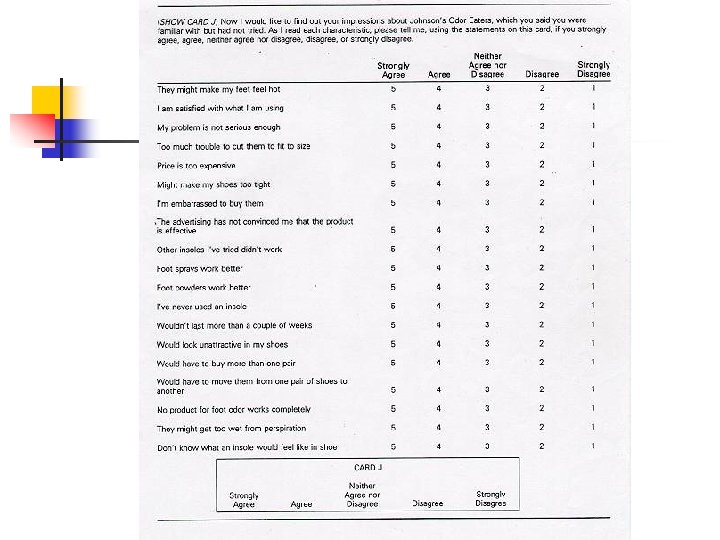
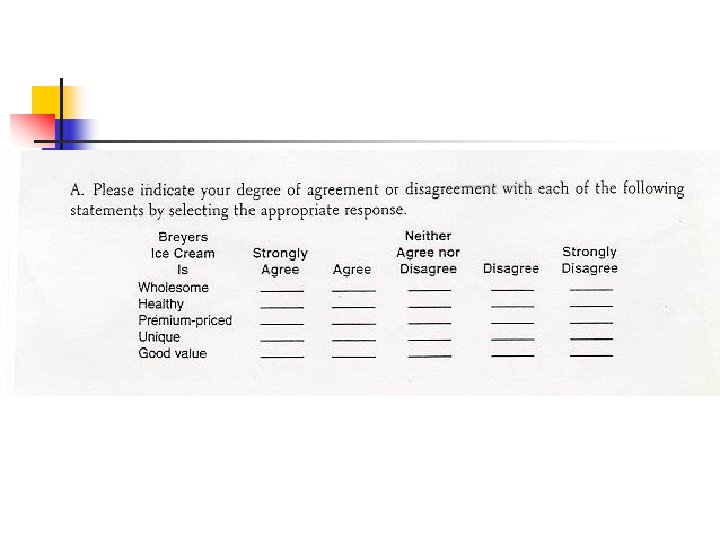
The Likert Scale n n n Widely used scale 5 points Degree of agreement with statements Use several statements to measure a “construct” e. g. “customer satisfaction, ” “loyalty, ” “attitudes towards technology”
Developing Constructs
Curiosity 1. I think learning about things is interesting and exciting. 2. I am curious about things. 3. My spare time is filled with interesting activities. 4. I like to solve problems that puzzle me. 5. I want to probe deeply into things. 6. I enjoy exploring new places. 7. New situations capture my attention. 8. I feel inquisitive. 9. The prospect of learning new things excites me. 10. I feel like searching for answers.
Attitudes towards Technology 4. I can usually figure out new hi-tech products and services without help from others. New technologies are often too complicated to be useful. I get overwhelmed by how much I need to know to use the latest technology. Technology gives people more control over their daily lives. 5. People get too dependent on technology to do things for them. 1. 2. 3. 6. 7. 8. 9. New technologies are mentally stimulating. Learning about new technologies can be as rewarding as the technology itself. The products and services with the newest technologies are more convenient to use. New technologies are not designed for use by people like me.
Customer Satisfaction (tailored for online purchases) 1. 2. 3. 4. 5. 6. If I had it to do over again, I’d make my most recent purchase at this website. I am sure it was the right thing to make my most recent online purchase at this website. I have truly enjoyed purchasing from this website. My choice to purchase from this website was a wise one. I am satisfied with my most recent decision to purchase from this website. I am happy I made my most recent online purchase at this website.
Loyalty (intentions) 1. 2. 3. 4. 5. I encourage friends and relatives to do business with this website. I say positive things about the website to other people. I will do more business with the website in the next few years. I would recommend the website to someone who seeks my advice. I consider this website to be my first choice to buy the kind of product I most recently purchased online.
The Likert Scale n n Easy to use Easy to code Useful in statistical analyses Usually treated as interval level
The Likert Scale Keep in mind: n Only use for statements that ask for degree of agreement n Use for several items to use space well n Items should be diverse enough to cover the issue
The Likert Scale n n Items for a construct can be summed Recode reverse scored items before summing
Likert-like Scales (NOT Likert-Scales)
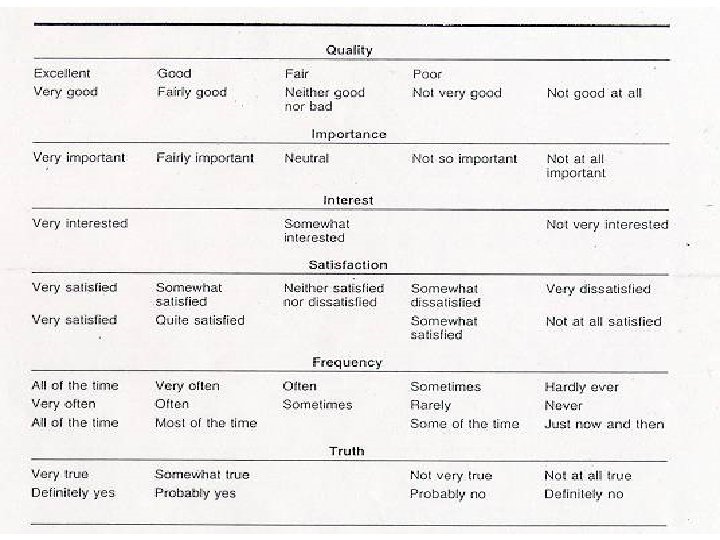
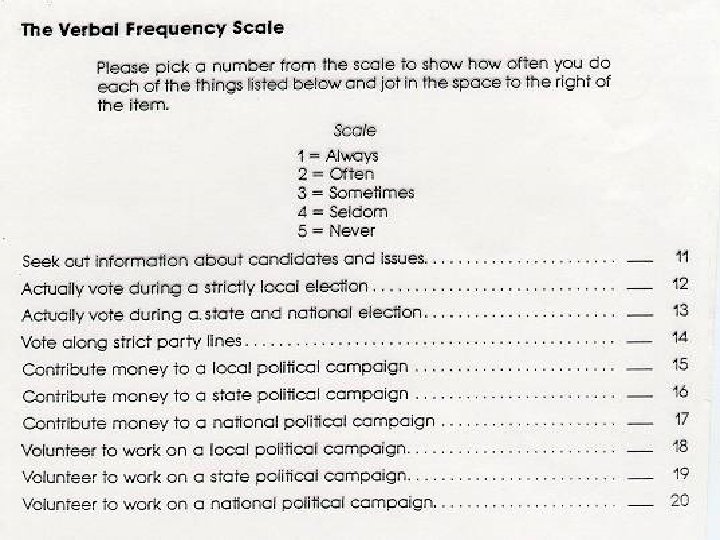
Verbal Frequency Scale n n Indicates how often Likert-like, but usually not interval level
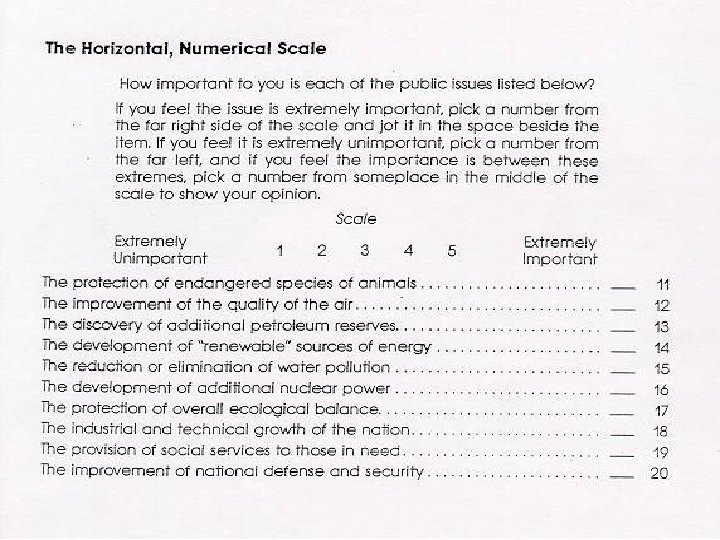
The Horizontal Numeric Scale n n Items judged on a single dimension Intermediate values are not labeled
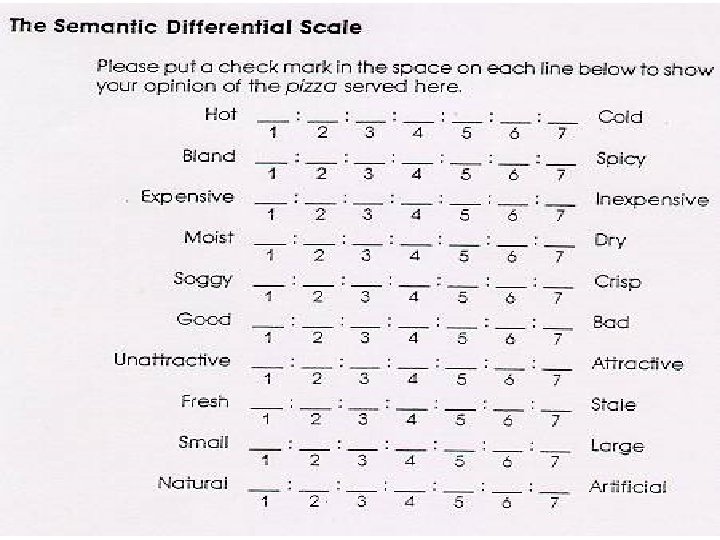
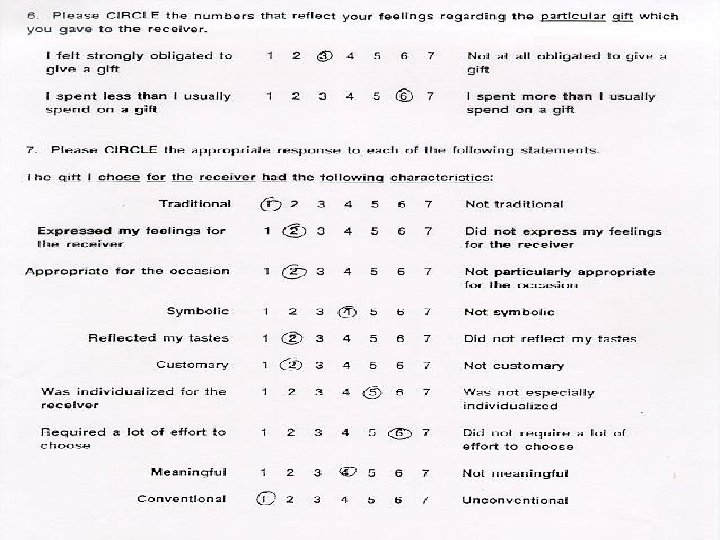
The Semantic Differential Scale n n n 7 point scale Bipolar adjectives/statements Can give quick comparative profile of objects
Purchase Intent Scales n n Often of interest in marketing Write them carefully
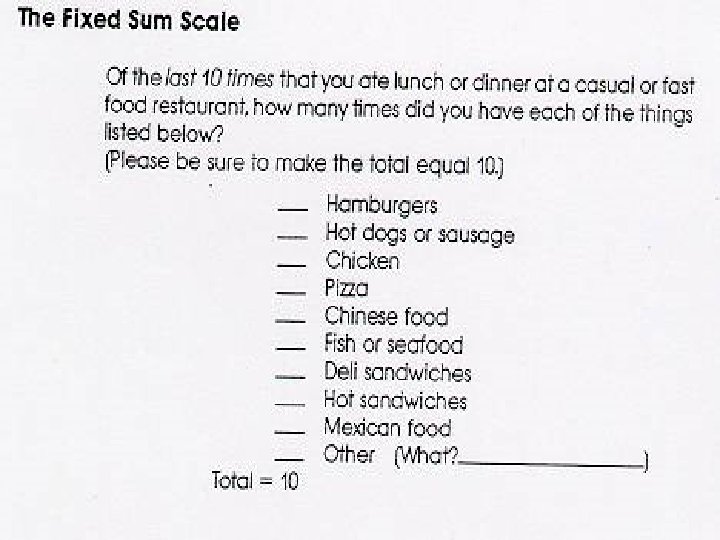
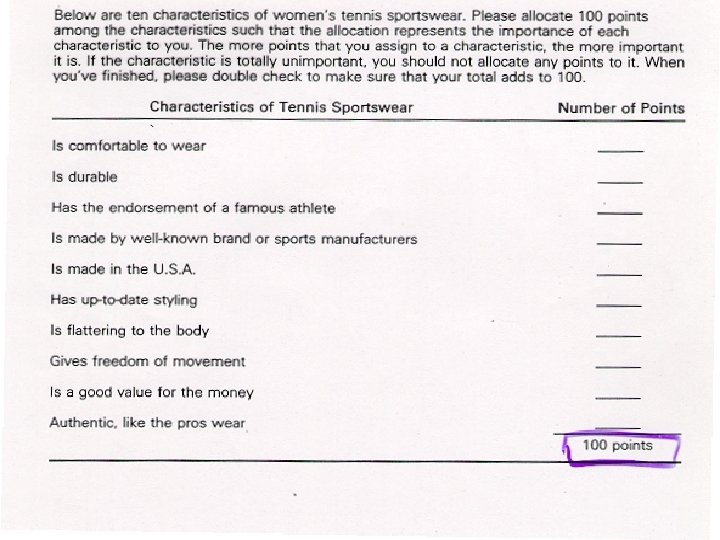
The Fixed Scale n Rs allocate a fixed number of points (usually 10 or 100) to choices
Univariate Statistical Analysis n n What is hypothesis? Null and alternative hypotheses Significance level Chi-square test (test of a proportion) n n “Is the difference between the expected (hypothetical) distribution and the observed distribution statistically significant? ” Illustration of an Example
Bivariate Statistical Analysis: Tests of Differences n Chi-square test (a test of differences among groups) n n n “Is the difference between the distribution statistically different? ” Illustration of an Example T-test for Difference of Means n “Is the difference between the means of men and women statistically different? ”
ANOVA (Analysis of Variance) Determines if mean group scores are far apart relative to our uncertainty about the actual value of the means
Example Grand Mean= 11+8+5/3 = 8
Example There seems to be an overall average difference Questions: n Is this difference statistically significant? n If so, is the size of the difference managerially significant? n
ANOVA (Analysis of Variance) Conceptually, ANOVA compares: difference among means/uncertainty OR n explained variance/unexplained variance OR n between treatment variance/within treatment variance
Analysis of Variance (ANOVA) n F-test n n n The larger F-value, the better result Determines whethere is more variability in the scores of one sample than in the scores of another sample) “Are the two sample variances different from each other or are they are from the same population? ”
Logic of ANOVA n n Each observation is different from the Grand (total sample) Mean by some amount There are two sources of variance from the mean 1) That due to the treatment or independent variable 2) That which is unexplained by our treatment
Logic of ANOVA (cont. ) The statistical test of significance is based on the relative size of the variance caused by the IV relative to unexplained variance Three quantities are calculated: n Total variance n Between treatment sum of squares (explained) n Within treatment sum of squares (unexplained) n
The F-ratio n n n MS = mean square bg = between groups wg = within groups n n Numerator is the “effect” and denominator is the “error” df = # of categories – 1 (k-1)
F-Statistic n n n Used in Factorial Designs Is an extension of the t-test. It is an analysis of variance that is a more general procedure than the t-test. When a study has only one independent variable and only two groups using an F or a t makes no difference. However analysis of variance (ANOVA) is conducted when there are more than two levels of an independent variable and when a factorial design with two or more independent variables is used.
One-Way ANOVA Partitions Total Variation Total variation Variation due to treatment n n Sum of Squares Among Sum of Squares Between Sum of Squares Treatment (SST) Among Groups Variation due to random sampling n n n Sum of Squares Within Sum of Squares Error (SSE) Within Groups Variation
Post Hoc Tests Vs Planned Comparisons n n n Post hoc tests allow us to make all pairwise comparisons. These tests trawl the data, searching for significant differences and so are not very sensitive. Planned comparisons enable us to address specific questions with a higher degree of sensitivity. It is not appropriate to use both in order to answer the same question.
Statistical Issues n Assumptions of the test n n are your data normally distributed is the sd about equal in each group Statistically significant difference vs. “real” difference Hypotheses n n null vs. research never “prove” anything
Statistical Issues (cont. ) n Scale attenuation effects n n floor and ceiling effects restricted range n Regression to the mean n Criterion choice n n the. 05 “rule” Type I and Type II errors
Statistical Issues (cont. ) n Interpreting non-significant results n n n poor design poor procedures poor instructions poor operational definitions power of the test n N and effect size